How to Master Rectangle Chart Patterns in Forex Trading
2024-04-11 11:42:02


In the ebb and flow of Forex markets, rectangle patterns are like a rest stop for prices: they shuffle sideways, trapped between two parallel lines known as support and resistance. These levels act like a floor and a ceiling where prices take a breather. Eventually, they either continue in the same direction they were heading before or decide to take a new path.
Picture a rectangle as a tug-of-war zone where neither buyers nor sellers get the upper hand. The battle ends when prices break through either the top or bottom line of the rectangle, signalling a breakout. To catch these moments, savvy traders, like those at ACY Securities, keep an eye on the larger picture the charts paint, scouting for any hints of a shift in the market tide.
Rectangle patterns pop up during both rising and falling trends. By learning to spot these patterns, traders can tap into ACY Securities' wealth of educational content and user-friendly trading platforms to better navigate the waves of market trends.
Bullish Rectangle Pattern: The Market's Intermission
The Bullish Rectangle Pattern is like a pause in the action of an uptrend. It's like the stock market is taking a breather before it goes even higher. Traders love this pattern because it's often a sign that the uptrend is going to keep going.
- Trend Indicator: This pattern occurs during a pause in an uptrend, suggesting a consolidation phase where the price oscillates between two horizontal levels.
- Consolidation Phase: Characterised by a price movement that zigzags between support around 1.0766 and resistance at approximately 1.1001, indicating a market gathering momentum.
- Breakout Potential: The pattern is recognised for leading to a bullish breakout, where prices can surge above the resistance level, signalling a continuation of the upward trend.
Market Example: EUR/USD Pair Analysis
- Rectangle Identification: In the EUR/USD chart, the Bullish Rectangle pattern is noticeable during March and April of 2020. It appears as a flat, sideways price movement following a previous uptrend.

- Price Levels: The price fluctuates between the lower support line, near 1.0766, and the upper resistance line, close to 1.1001.
- Bullish Breakout: A bullish breakout is confirmed when the price closes above the resistance line. On the chart, this occurred around the end of May 2020, when the market closed above 1.1001.
- Subsequent Trend: After the breakout, the price continued to climb, reaching higher levels and confirming the pattern's expectative reliability.
Bearish Rectangle Pattern: The Market's Breather
The Bearish Rectangle Pattern is like a break in the downward trend, a time-out, if you will. It's as if the sellers are taking a rest stop, just to gather their strength before pushing the prices down even further. But don't be fooled, it's just a temporary pause. The downtrend is likely to pick up right where it left off, as the selling pressure is still in full swing.
- Formation Phase: This pattern develops when prices fluctuate within a defined range, indicating a period of consolidation in a prevailing downtrend.
- Support and Resistance Levels: The prices move sideways, touching the upper resistance line around 1.2523 and bouncing back from the support line near 1.2175 multiple times.
- Expectation of Continuation: While the pattern shows a temporary standstill, it often hints at an impending resumption of the downward trend.
Market Example: EUR/USD Pair
- Identifying the Pattern: Notice the EUR/USD pair's price movements between January and April 2018. The repeated price rejections at resistance and support levels form the bearish rectangle.
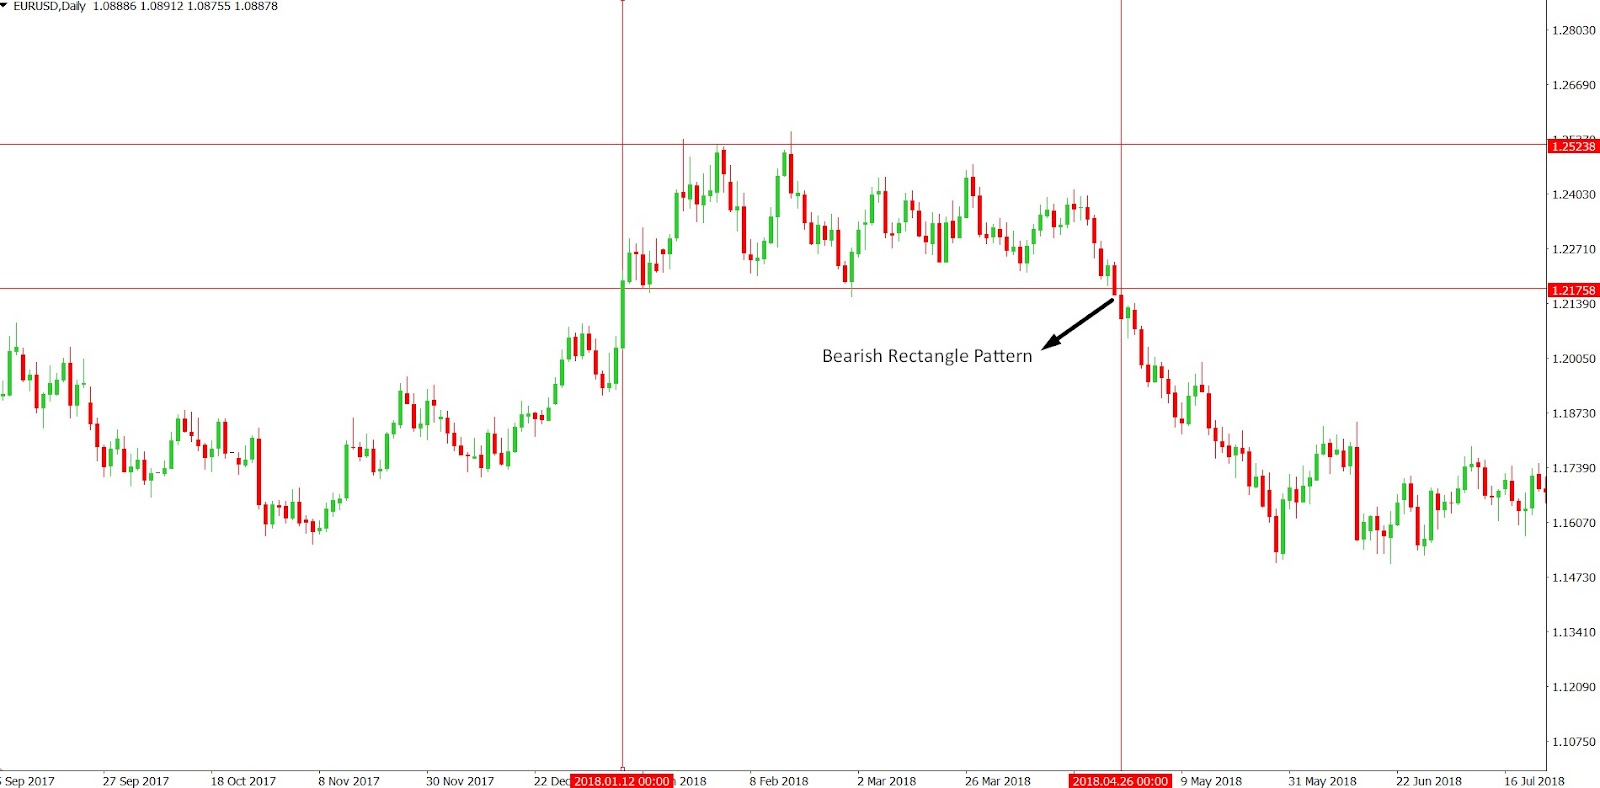
- Price Behaviour: The trading range is confined, with the price testing the resistance at approximately 1.2523 and the support at roughly 1.2175.
- Bearish Breakout: The breakout occurs when a price candle closes below the support level. For example, on April 26, 2018, the market closed below the rectangle's support, signalling a bearish breakout.
- Following the Breakout: Post-breakout, the price tends to fall, continuing the prior downtrend. Traders on the ACY Securities platform might have considered this breakout as an opportunity to enter a short position, anticipating further decline.
Additional Rectangle Patterns
These encompass a range of formations that signal either market consolidation or potential reversal. They include the 'Rectangle Top' pattern, which suggests a bearish reversal, and the 'Rectangle Bottom' pattern, indicating a bullish reversal. These patterns offer traders vital insights into impending changes in market direction.
Rectangle Bottom Chart Pattern: Signalling a Potential Uptrend
Often referred to as a "double bottom," this bullish reversal pattern emerges following a downward price trend. Characterised by two price dips occurring at a similar level, the pattern suggests an impending reversal. These dips form within a distinct consolidation area, resembling a rectangle on the price chart.
When the price breaks through the rectangle's resistance level, traders often see this as a cue to initiate long positions, anticipating a potential uptrend.

For instance: In the EUR/USD daily chart provided, the Rectangle Bottom pattern is highlighted, showing two significant lows around the 1.161238 price level, forming a support base. Following the second low, the price broke out above the resistance level near 1.19000, indicating a possible change from bearish to bullish sentiment. This breakout could prompt traders to initiate long positions, anticipating further upward movement in the price.
Rectangle Top Chart Pattern: Signalling a Potential Downturn
The Rectangle Top, or "Double Top," chart pattern is a bearish formation that often emerges at the culmination of an uptrend, suggesting a possible shift in momentum. Recognised by twin peaks forming at a similar resistance level, this pattern reflects price action hitting a ceiling, indicating selling pressure at a key level of resistance. A bearish breakout occurs when the price falls below the pattern's support level, confirming a change in sentiment and a potential reversal of the uptrend.

In the above EUR/USD daily chart, we see the Rectangle Top pattern in action. The pair exhibits two distinct high points around the 1.19071 price level, suggesting a strong resistance that the price struggles to breach. Subsequent to these highs, the price experiences a bearish breakout, descending past the support level at 1.16752. This breakout can be interpreted as a signal for traders to consider initiating short positions, forecasting a continued decline in price following the pattern's completion.
By incorporating this example into educational content, ACY Securities provides Forex newbies with a clear, real-market scenario to understand how to spot and interpret bearish rectangle patterns for potential trading strategies.
Understanding Rectangle Chart Patterns in Forex
Rectangle chart patterns are like the pause buttons in the fast-moving forex market; they highlight periods where the price moves sideways, taking a breather before its next move. Here's how to spot and interpret this pattern, especially if you're new to forex:
Spotting the Rectangle:
- Level Playing Field: Imagine a football field where the two teams are equally matched, resulting in the ball being passed back and forth in the middle of the field without any goals. That's what a rectangle pattern looks like on a chart - a price range where the currency doesn’t make significant moves up or down.
- Parallel Lines: In a rectangle pattern, think of the upper and lower price limits as the sidelines of the field. The price should touch these 'sidelines' multiple times, confirming they are significant levels that traders are watching.
- Consistency: Just like the regularity of a team's practice sessions, a rectangle pattern has consistent highs and lows within the range.
- Quiet Crowd: As the pattern forms, you might notice fewer people are talking about the currency pair - this is like the volume or noise of the market quieting down, signalling that traders are waiting to see what happens next.
- Patience Pays Off: The longer this period of inactivity lasts, the bigger the potential move could be once the price breaks out from the rectangle.
Trading the Breakout:
- Surge in Action: When the price finally 'scores a goal' by breaking out of the rectangle, it's often accompanied by a rise in volume - imagine the crowd roaring as the ball hits the net. This surge can signal a strong move to come.
- Setting Goals: Just as a team has a game plan with specific goals, traders often have a target price for their trade, calculated based on the height of the rectangle.
- Watch for Fakes: Sometimes a player might fake a move to throw off the other team. In trading, this is like a false breakout where the price moves past the boundary but then quickly reverses - hence, waiting for confirmation is key.
Applying Rectangle Patterns:
- Identify the Range: On your trading platform like MetaTrader4 or MetaTrader 5, look for a currency pair that has been trading between two flat, horizontal lines for some time.
- Watch for Breakouts: Decide if you want to enter a trade if the price breaks above (for a bullish move) or below (for a bearish move) the rectangle. Remember, this should be accompanied by an increase in trading volume for more confidence.
- Set Targets and Limits: Once in a trade, set a price target based on the rectangle's size and place a protective stop-loss order to manage your risk in case of sudden reversals.
Example in Action:
Imagine the EUR/USD pair has been fluctuating between 1.1200 and 1.1300 for several weeks. This creates a rectangle pattern on the chart. If one day, the price closes above 1.1300 with significant volume, it could signal the start of an uptrend, and traders might consider buying. If the price then reaches 1.1400, aligned with the height of the rectangle pattern, it might be a good time to place a sell order.
How to Trade Rectangle Patterns with ACY Securities?
Rectangle patterns in forex, signal periods of consolidation before a potential price breakout. If you're trading with ACY Securities, here’s a simplified way to trade these patterns:
Getting Into a Trade:
- Wait for the Break: Consider the rectangle like a holding pattern before a big announcement. You wouldn’t react until the news breaks, right? Similarly, wait for the price to break past the rectangle's boundaries before you enter a trade.
- Confirm the Move: Just like you'd double-check exciting news, look for a confirmed candlestick close outside the rectangle - above for bullish, below for bearish - to confirm the price's new direction.
When to Take Close a Position:
- Set Your Target: Think of closing a position like your destination on a trip. Measure the rectangle's 'height' - the difference between the top and bottom - and add (for bullish) or subtract (for bearish) that number from the breakout point to find your target.
Managing Risk with Stop Loss:
- Set a Safety Net: Your stop loss is like a safety net in case the market turns against you. Place it just under the rectangle for a bullish breakout, or just over for a bearish breakout, to minimise potential loss.
For new traders entering the forex world, understanding chart patterns is key. Let's dive into a real-world example using the popular EUR/USD pair on ACY Securities' MetaTrader platform.
Identifying Rectangle Patterns:
- Support and Resistance: We start by spotting the support and resistance levels that frame our rectangle. In this EUR/USD daily chart, the resistance is at approximately 1.1920, and support is around 1.1600.
- Price Movement: The prices are bouncing between these levels, suggesting a period of market indecision.
Trading Strategies with Rectangle Patterns:
- Entry Point: An effective breakout below the support level, for instance at 1.1590, could be a signal to enter a sell trade. This is where you'd hop on the trend, just like catching a train after it starts moving from the station.

- Stop Loss: To safeguard your trade from unexpected market U-turns, you’d set a stop loss. For a sell entry, a good spot could be just above the resistance level, say at 1.1930.
- Exit Strategy: The target can be set by measuring the height of the rectangle. Here, we have about 320 pips of distance between support and resistance. Subtracted from our entry point, this might put our closing position around 1.1270.
This EUR/USD chart scenario provides a perfect illustration of a bearish breakout, where the market decides it's time to move after a period of quiet. It’s like after much anticipation, the market finally shows its hand, and we're ready to act with ACY Securities' MT4/MT5 tools at our disposal.
Conclusion
In navigating the complexities of financial markets, the rectangle pattern stands out as a critical signpost for periods of price consolidation and impending breakouts. Grasping its essential features and underlying principles is pivotal for traders aiming to harness the opportunities presented by potential trend continuations or reversals through rectangle pattern analysis. ACY Securities offers the resources and tools necessary for traders to apply these principles and cultivate an effective trading journey.
At ACY Securities, we empower traders by providing:
- Customised Education: Our comprehensive educational resources are designed to meet the needs of traders at every level, enhancing your trading knowledge and skills.
- Informed Trading: We ensure you're not trading in the dark. Our expert insights and analysis support your trading decisions, helping you navigate the markets more confidently.
- Ready to Dive In? Open your account with us today and begin a journey of growth and learning. Embrace the opportunity to grow, learn, and excel in the dynamic trading landscape with ACY Securities.
Explore ACY Securities' expert-led webinars to help traders navigate the world of the forex market. Learn more about Shares, ETFs, Indices, Gold, Oil and other tradable instruments we have on offer at ACY Securities.
You can also explore our MetaTrader 4 and MetaTrader 5 trading platforms including access to our free MetaTrader scripts. Then try out your own trading strategies on your own free demo trading account.
FAQs:
1. What is a rectangle chart pattern in forex trading?
A rectangle chart pattern indicates a consolidation phase where price fluctuates between parallel support and resistance lines before a potential breakout.
2. How can I identify a rectangle pattern on a forex chart?
Look for a horizontal trading range with multiple touches on support and resistance levels, typically accompanied by decreasing volume.
3. What does a breakout from a rectangle pattern indicate?
A breakout signals that price has escaped consolidation, potentially continuing the existing trend or initiating a reversal.
4. How do I trade a rectangle pattern with ACY Securities?
Monitor for confirmed breakouts, set entry points beyond the boundaries, and calculate closing targets based on the pattern's height.
5. Are rectangle patterns reliable for trading decisions?
While no pattern is infallible, rectangles can be reliable when confirmed by volume, additional technical indicators, and overarching market trends.
Try These Next

