Ultimate CFD Trading Strategies You Need to Know
2024-08-28 14:12:11


In the dynamic trading landscape of CFD trading, advancing your skills is essential for capitalising on market trends, price movements, and leveraging opportunities within financial markets. This guide offers a comprehensive look into advanced CFD trading strategies, integrating insights from both Forex trading and the broader realm of CFDs. We will explore sophisticated technical and fundamental analysis techniques, such as the strategic use of Fibonacci Retracement and the Ichimoku Cloud, as well as the world of algorithmic and high-frequency trading.
Moreover, we emphasise the importance of sentiment analysis, a critical yet often overlooked tool that evaluates the financial market’s mood through economic news, indicators, and social media trends. For example, understanding how a significant economic announcement affects currency pairs can guide informed trading decisions and improve your trading performance.
This guide is tailored for experienced traders seeking to refine their trading strategies and gain a comprehensive understanding of the advanced techniques required to navigate the fast-paced CFD market. We will delve deeper into technical indicators, focusing on risk management tools, psychological resilience, and the creation of a robust and adaptable trading plan. Whether you are engaging in swing trading or utilising a trading platform for online trading, these strategies will enhance your trading journey and position you for financial growth in global markets.
Mastering Advanced Technical Analysis for CFD Trading
In the dynamic trading landscape, advanced technical analysis equips traders with sophisticated tools to make informed trading decisions and enhance their trading performance. Key techniques such as Pivot Points, Fibonacci Retracement, Moving Averages (SMA and EMA), Oscillator Trading with RSI and MACD, and the Ichimoku Cloud enable traders to understand and capitalise on market dynamics with greater precision. Additionally, understanding the basics of trading CFDs, including leverage, trading strategies, and the mechanics of buying and selling contracts for difference, is crucial for managing trading costs and anticipating market movements.
1. Pivot Points
Pivot Points are essential for identifying overall market trends and predicting support and resistance levels across various time frames. For example, if yesterday's closing price was significantly higher than its pivot point, it might indicate an upward trend today, offering a valuable resource for experienced traders to anticipate market movements.
2. Fibonacci Retracement
Fibonacci Retracement employs key Fibonacci ratios to identify potential support and resistance areas, helping traders anticipate reversals. For instance, a trader might use Fibonacci levels to predict where a currency pair might bounce back after a decline, allowing them to enter or exit a trade strategically.
3. Moving Averages (SMA and EMA)
Simple Moving Average (SMA) and Exponential Moving Average (EMA) help smooth out price action and identify trend direction. While SMA provides a straightforward average of price data, EMA gives more weight to recent data, making it more responsive to recent price changes. For example, if the EMA of a stock crosses above its SMA, it might signal a buying opportunity.
4. Oscillator Trading (RSI and MACD)
Oscillators like the Relative Strength Index (RSI) and Moving Average Convergence Divergence (MACD) are used to identify overbought and oversold conditions. RSI evaluates the speed and change of price movements, while MACD assesses momentum and potential trend reversals. For example, if the RSI of an asset rises above 70, it might indicate that the asset is overbought, signaling traders to consider selling.
5. Ichimoku Cloud (Ichimoku Kinko Hyo)
The Ichimoku Cloud is a comprehensive tool offering insights into support and resistance, trend direction, momentum, and trade signals. It is invaluable for both quick and in-depth market analysis. For instance, if the price of an asset is above the cloud, it might suggest a bullish trend, while a price below the cloud could indicate a bearish trend.
For more info on mastering advanced CFD trading strategies, watch the video below. Learn how to use tools like Fibonacci Retracement, Moving Averages, and sentiment analysis to enhance your trading approach.
1. Pivot Points: Harnessing Pivot Points for Informed Decisions
Pivot points are a fundamental tool in CFD and forex trading, providing traders with insights into market trends and potential price movements. By calculating these points from the previous day's high, low, and closing prices, traders can determine whether the market sentiment is bullish or bearish. Trading above the pivot point typically indicates a bullish trend, while trading below suggests a bearish outlook.
Pivot Point Calculation:
- Pivot Point (PP): (High + Low + Close) / 3
- First Level Support and Resistance:
- First Resistance (R1): (2 x PP) – Low
- First Support (S1): (2 x PP) – High
- Second Level Support and Resistance:
- Second Resistance (R2): PP + (High – Low)
- Second Support (S2): PP – (High – Low)
- Third Level Support and Resistance:
- Third Resistance (R3): High + 2(PP – Low)
- Third Support (S3): Low – 2(High – PP)
Pivot points are instrumental in identifying potential support and resistance levels, making them particularly effective when used with candlestick charts for visualising price action. They aid in systematic trading and decision-making, proving to be a valuable tool in a trader's arsenal for both short-term and long-term trading strategies.

Example: Applying Pivot Points to Trade EUR/USD
Let us consider a practical example using the EUR/USD daily timeframe, demonstrating a simplified trading strategy with pivot points:
- Observing the Pivot Point: On the chart, the pivot point is marked at 1.09669, serving as a middle ground. If the price remains above this level, traders might anticipate an upward market trend, whereas a price below suggests a downward trend.
- Buying Strategy: Imagine the price dips near the 'S1' line at 1.07944 and then starts to rise again. This rebound acts like a bouncing ball, signaling a potential buying opportunity as traders expect the price to continue rising.
- Selling Strategy: Conversely, if the price nears the 'R1' line at 1.12099 and then begins to decline, it is as if it hit a ceiling and is dropping back down. This could be an ideal moment to sell, anticipating a further decline in price.
- Setting a Safety Net: To manage trading risks, place a stop-loss just below 'S1' when buying, ensuring an automatic sell if the price unexpectedly falls, minimising potential losses.
- Closing Position: If the price moves in the desired direction, set a target to sell just below the next resistance line ('R1' for buys) to lock in gains, enhancing your trading performance.
Remember, pivot points serve as signposts, guiding traders in making informed trading decisions about potential price directions. However, trading always involves uncertainties, so it is crucial to be prepared for unexpected price movements.
By utilising pivot points, traders at ACY Securities can develop more informed trading decisions and refine their strategies, leveraging these insights to excel in the financial markets.
2. Fibonacci Retracement: Harnessing Fibonacci for Informed Trading Decisions
Fibonacci Retracement is a powerful tool used by seasoned traders to identify potential support and resistance levels in financial markets. This indicator is based on the idea that markets often retrace a predictable portion of a price move before continuing in the original direction.
Traders use Fibonacci levels—commonly 23.6%, 38.2%, 50%, 61.8%, and 100%—to place trades at points where the market is likely to reverse, making it an essential part of advanced trading strategies.
Applying Fibonacci Retracement: A Practical Guide
Let us explore how Fibonacci Retracement can be used effectively with an example, simplifying the process for traders of all levels:
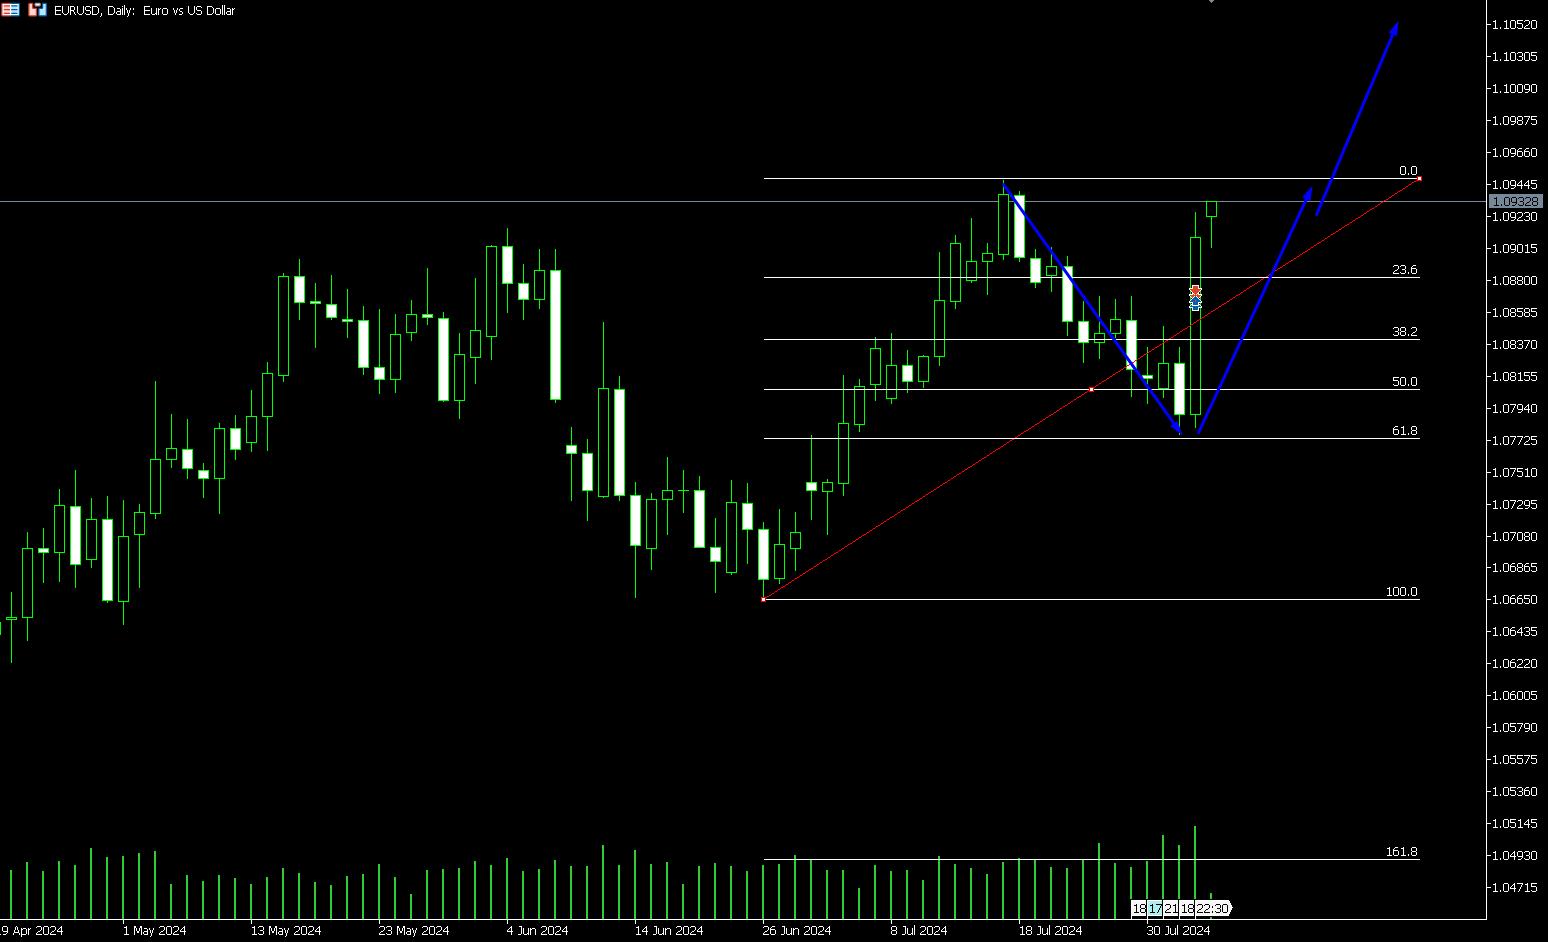
- Identify Major Price Movements: Begin by spotting significant upward or downward movements in the market. For instance, if the EUR/USD currency pair shows a substantial rise followed by a decline, these movements are marked by the Fibonacci tool.
- Understanding Fibonacci Levels: The tool draws horizontal lines at 23.6%, 38.2%, 50%, and 61.8% levels after a major price move. These lines act as potential points where the price might pause or reverse, providing crucial insights into market dynamics.
Trading Strategy: Using Fibonacci Retracement
- Buying Strategy: If the price drops after a rise and touches one of the Fibonacci levels, such as the 61.8% level at 1.07725, and then begins to climb again, it could be a signal to buy. This is like a rubber band being stretched and then bouncing back, offering trading opportunities for entry.
- Selling Strategy: Conversely, if the price ascends and then begins to fall after reaching one of the Fibonacci levels, it might indicate a good moment to sell. For example, if the price approaches 1.07725 (around the 61.8% level) and starts breaking below this level, this could signal a selling opportunity.
- Utilising Key Figures: Suppose the price nears 1.07725 and starts to rise again; this could be a potential buying signal. These levels provide a roadmap for informed trading decisions and can enhance your trading performance.
Fibonacci Retracement acts as a valuable tool in a trader's arsenal, offering insights into price fluctuations and market conditions. While these levels serve as guides, they are not guarantees. It is important for CFD traders to incorporate them into their broader risk management tools and trading plans.
By leveraging Fibonacci Retracement, traders at ACY Securities can develop more robust trading strategies, improving their ability to navigate global markets and make informed decisions in their trading journey.
3. Understanding Moving Averages: A Guide for New Traders
Moving averages are a fundamental tool used by traders to identify the direction of market trends by averaging past prices over a specific period. This technique helps traders smooth out price data and make informed trading decisions based on market dynamics.
Incorporating the concept of a trading game can further simplify trading strategies, allowing users to benefit from the expertise of seasoned traders while minimising risks.
Types of Moving Averages
- Simple Moving Average (SMA): This averages out prices over a set period, giving equal weight to each day's price. It provides a straightforward view of the overall trend.
- Exponential Moving Average (EMA): This gives more emphasis to recent prices, making it more responsive to recent changes in the market. It reacts faster to price shifts, offering timely insights for traders.
The choice of the "number of days" in a moving average is crucial. A 50-day moving average is common for a medium-term perspective, while a 200-day moving average might be used for a longer-term outlook.

Shorter periods, like 5 or 10 days, can provide insights into short-term trends. The key is to choose a period that aligns with your trading strategy without getting caught up in market noise or missing significant moves.
Example: Applying Moving Averages to EUR/USD
Let us explore a practical example of using moving averages with the EUR/USD currency pair to understand their application:
- From the Chart: On the chart, the blue line represents the EMA, which closely tracks recent price movements, reacting quickly to both drops and rises.
- Buy Signal: When the price crosses above the EMA, as it did around 1.0786, it suggests a potential buying opportunity, indicating that the market may be turning upward.
- Sell Signal: Conversely, when the price falls below the EMA, as observed near 1.08598, it may signal a time to sell, indicating a potential downward market trend.
A Simple Trading Strategy Using Moving Averages
For beginners, moving averages can be thought of as traffic lights:
- Buy: When the price climbs above the blue EMA line, it acts as a green light, suggesting that the market trend is turning upwards and could be a good time to buy.
- Sell: If the price falls below the blue EMA line, it is akin to a red light, indicating that the market might be heading down and signaling a time to sell.
Moving averages serve as a valuable resource for CFD traders at ACY Securities, helping them to develop informed trading decisions and enhance their trading performance. By understanding how to use these indicators effectively, traders can better navigate market trends and improve their overall trading journey.
4. Utilising Oscillators: Mastering RSI and MACD for Trading Strategies
Oscillators like the Relative Strength Index (RSI) and Moving Average Convergence Divergence (MACD) are essential tools in technical analysis that help traders identify market trends and potential trading opportunities.
- Relative Strength Index (RSI): This indicator measures a currency’s recent gains against its losses to spot overbought or oversold conditions. An RSI above 70 suggests an overbought market, while below 30 indicates an oversold market, offering insights into price movements.
- Moving Average Convergence Divergence (MACD): MACD evaluates the relationship between two Exponential Moving Averages (EMAs). A bullish signal is generated when the MACD line crosses above the signal line, and a bearish signal occurs when it crosses below, helping traders understand market volatility.

Practical Example with RSI and MACD
- Buy Signal: If the RSI is near 30, indicating the market might be oversold, and the MACD line crosses above the signal line at 1.066 for EUR/USD, it suggests a potential buy opportunity.
- Sell Signal: Conversely, if the RSI nears 70, indicating an overbought condition, and the MACD line crosses below the signal line at 1.0930, it signals a potential sell.
While these indicators are valuable for trading strategies, they should be part of a broader risk management plan. ACY Securities provides resources to help traders effectively use these tools to improve their trading performance in global markets.
5. Ichimoku Cloud (Ichimoku Kinko Hyo)
The Ichimoku Cloud, also known as Ichimoku Kinko Hyo, is a powerful tool that provides traders with a holistic view of the financial markets. This versatile indicator consists of five lines that offer insights into market trends, support and resistance levels, and potential trading opportunities.
Key Components of the Ichimoku Cloud
- Senkou Span A and B (Leading Spans): These lines form the "cloud" that identifies key support and resistance areas. In the GBP/USD chart, a green cloud suggests a bullish trend, while a red cloud indicates a bearish trend. If the GBP/USD price is above the green cloud, currently around $1.31066, it suggests a buying opportunity. Conversely, if the price is below the red cloud, it may indicate a selling opportunity.

Tenkan-sen (Turning Line): Represented by the red line, the Tenkan-sen shows the average of the highest high and lowest low over the last nine periods.If the Tenkan-sen value for GBP/USD is $1.3079 and the current price is $1.31066, this indicates short-term buying interest.
- Kijun-sen (Standard Line): Shown as a blue line, the Kijun-sen represents the average of the highest high and lowest low over the last 26 periods. If the Kijun-sen for GBP/USD is at $1.3079 and the current price is above this level, it may suggest a medium-term bullish trend, making it a buying opportunity.
- Chikou Span (Lagging Line): This line is plotted 26 periods behind the current price, offering a historical view of price momentum. If the Chikou Span and the current GBP/USD price are both around $1.31066, it indicates that the market momentum is strong and bullish.

Trading Strategy with Ichimoku Cloud
- Bullish Signal: When the GBP/USD price is above the green cloud, it indicates a strong uptrend. Traders might consider entering a long position when the price rises above key levels like $1.31066.
- Bearish Signal: If the price is below the red cloud, the market may be in a downtrend. A short position might be considered if GBP/USD falls below the cloud, targeting levels such as $1.28912.
The Ichimoku Cloud not only helps visualize market sentiment but also offers strategic entry and exit points. By using this tool in conjunction with other technical analysis methods and sound risk management, traders can make more informed decisions in the global forex markets.
At ACY Securities, we equip traders with the resources and educational content needed to master these tools and enhance their trading performance in global markets.
Leveraging Fundamental Analysis for Effective Long-term Trading Strategies
Incorporating fundamental analysis into long-term trading strategies requires careful monitoring of macroeconomic indicators, sectoral trends, and global economic shifts. Fundamental analysis plays a crucial role in predicting the future prices of Forex currency pairs and other financial instruments. This section will focus on key fundamentals to consider when making informed trading decisions.
Central Bank Decisions and Market Impact
Central banks are pivotal in influencing financial markets, primarily through their interest rate adjustments. Their decisions can impact a wide range of assets, including currencies, stocks, and commodities. For example, changes in the federal funds rate by the Federal Reserve affect not only the value of the U.S. dollar but also have significant implications for major indices and commodities.
- Example: An unexpected increase in interest rates can strengthen the USD, affecting major currency pairs like EUR/USD. This presents potential trading opportunities for traders at ACY Securities, who can leverage this information to adjust their trading strategies accordingly.
At ACY Securities, we equip traders with the tools to track and analyse central bank communications through our dedicated news platform and analytical insights. Changes in monetary policy, asset purchasing plans, currency revaluation, or shifts in central bank personnel are meticulously analysed, providing our clients with valuable insights into potential market movements.
Utilising Economic Indicators for Market Analysis
Economic indicators are crucial for traders seeking to understand the financial health of an economy. Regular economic reports provide insights into whether an economy is growing or contracting. Like the stock market, the foreign exchange (Forex) market is sensitive to even minor fluctuations in economic data.
Key Economic Indicators to Monitor
Understanding essential economic indicators, such as GDP, inflation, unemployment rates, and housing market statistics, is fundamental for grasping economic trends.
- Example: Suppose the U.S. reports a lower-than-expected unemployment rate. In that case, this could lead to a stronger U.S. dollar, creating favorable trading conditions for clients at ACY Securities. Such insights are integral to developing effective trading strategies and making informed trading decisions.
#1: Understanding the Impact of Gross Domestic Product (GDP) on Forex Trading
Gross Domestic Product (GDP) is a key economic indicator that represents the total market value of all finished goods and services produced within a country over a specific period. Although GDP is considered a lagging indicator, experienced traders closely watch the advance and preliminary reports before the final GDP figures are released. Discrepancies between these reports can introduce market volatility and present trading opportunities.
Analysing EUR/USD with U.S. GDP Data
Let's explore how the U.S. GDP release impacts the EUR/USD currency pair, as illustrated in the provided chart:
Before GDP Release:
- Market Anticipation: Before the GDP figures are released, the EUR/USD pair might trade within a stable range, possibly showing slight upward movement, reflecting market anticipation.

GDP Data Release:
- Impact on USD: When the GDP data is released, showing stronger-than-expected economic performance, the USD typically appreciates. For instance, in the chart, the U.S. GDP growth rate came in at 2.8%, surpassing the forecasted 2.0%. This positive surprise strengthens the USD, as investors anticipate potential interest rate hikes or continued economic growth.
EUR/USD Reaction:
- Sharp Sell-Off: Following the release, the EUR/USD pair reacts with a sharp sell-off, as shown by the steep decline from 1.1150 to 1.1050. This 100-pip drop reflects the market's swift response to the strong GDP data, as fewer USD are now needed to purchase one Euro.
The chart highlights how significant economic indicators like U.S. GDP can trigger pronounced movements in the forex market, providing traders with potential opportunities based on fundamental data releases.
#2: CPI: How CPI and Inflation Impact Currency Valuation?
The Consumer Price Index (CPI) is a vital economic indicator used in financial markets to track the cost of a broad range of products, reflecting a country's inflation rate and export profitability. These factors play a significant role in determining the strength of a currency. Generally, strong export figures indicate a robust currency.
Central banks often aim to keep inflation around a 2.0% target, using CPI to monitor and manage economic stability. In the U.S., however, the Federal Reserve prefers the Personal Consumption Expenditure (PCE) index as its primary measure of inflation. For traders at ACY Securities focusing on the U.S. dollar, the PCE index is a critical tool for anticipating future interest rate adjustments and subsequent changes in currency value.
Example: How CPI Differences Affect Currency Pairs
An increase in CPI typically indicates a bullish outlook for the related currency. Let us explore an example to understand this better:
- Scenario: Suppose the UK's CPI is projected at 2.5%, while Australia's CPI remains at 1.5%.
- Currency Impact: This scenario suggests that the British pound (GBP) might strengthen against the Australian dollar (AUD) due to higher inflation expectations in the UK. Higher CPI figures often lead to currency appreciation as they signal potential interest rate hikes to control inflation.
- Strategic Advantage: For traders at ACY Securities, these insights into CPI differences offer strategic advantages in forex trading. By analysing and understanding CPI data, traders can make informed decisions about potential trading opportunities and adjust their strategies to capitalise on expected currency movements.
#3: Understanding Key Economic Indicators
Although Consumer Price Index (CPI) is well-known, several other indicators provide valuable insights into a country’s economic health and can significantly impact currency values.
Producer Price Index (PPI)
The Producer Price Index (PPI) tracks the average change in selling prices received by domestic producers, serving as a leading indicator of consumer inflation. A rising PPI suggests increasing production costs, which can lead to higher consumer prices and potentially stronger currencies.
- Example: In 2023, the U.S. PPI rose by 4.3%, signaling inflationary pressures. Economist Jane Doe noted, "The PPI provides foresight into consumer price trends, crucial for traders anticipating interest rate changes."
Purchasing Managers’ Index (PMI)
The Purchasing Managers’ Index (PMI) is a key indicator of manufacturing sector health. A PMI above 50 signals expansion, while below 50 indicates contraction. This data helps traders assess economic vitality and potential market trends.
Durable Goods Report (DGR) and Employment Cost Index (ECI)
The Durable Goods Report (DGR) reflects new orders for long-lasting goods, indicating economic activity. A rise in durable goods orders suggests business investment and growth.
The Employment Cost Index (ECI) measures labor costs, highlighting wage inflation. Rising employment costs can lead to interest rate changes, impacting currency values.
#4: Understanding the Impact of Interest Rate and Policy Decisions on Forex Trading
Interest rates and central bank policies are fundamental drivers of currency movements in the financial markets. At ACY Securities, we recognise that when a country’s interest rates are higher than others, it tends to attract foreign capital, strengthening its currency. Conversely, lower interest rates can stimulate economic growth by encouraging borrowing and spending.
Federal Reserve (United States) Announcements
Central banks, like the Federal Reserve in the United States, have a significant influence on currency valuation through various policy decisions. Here are key types of announcements made by the Fed:
- Interest Rate Decisions: The Federal Reserve's decisions on the federal funds rate set the benchmark for U.S. interest rates, impacting the USD. An interest rate hike usually strengthens the USD, while a cut may weaken it.
- Monetary Policy Statements: These statements provide insights into the Fed’s economic outlook and policy direction, helping traders anticipate future market trends.
- Quantitative Easing (QE): QE involves the Fed buying government securities to increase money supply and stimulate the economy. As of mid-2023, the Fed's balance sheet reached $8.24 trillion, highlighting the scale of QE measures and their impact on currency valuation.
Global Central Banks and Their Influence
While the Federal Reserve is highly influential, several other central banks also significantly impact the forex markets. Here is a look at how these institutions shape currency dynamics:
- European Central Bank (ECB): The ECB’s monetary policy decisions affect the Euro and related currency pairs. Interest rate changes and policy announcements can cause fluctuations in the Eurozone's economy.
- Bank of England (BoE): The BoE’s rate adjustments influence the British Pound, affecting its strength and volatility in the market.
- Bank of Japan (BoJ): The BoJ's monetary policy, including interest rate decisions and QE efforts, significantly impacts the Japanese Yen.
- People’s Bank of China (PBoC): The PBoC’s policy interventions not only affect the Chinese Yuan but also have broader implications for global markets due to China’s economic significance.
- Reserve Bank of Australia (RBA): The RBA’s decisions on interest rates directly influence the Australian Dollar and its trading dynamics.
#5: How Labor Market Reports Affect Forex Trading Strategies
The NFP report is a vital economic measure that tracks employment changes in the U.S., excluding farm and certain other workers. Released monthly by the Bureau of Labor Statistics, this report provides insights into the health of the U.S. labor market and its broader economic implications.
- Impact on USD: A rise in job numbers in the NFP report typically signals economic strength, which can boost the value of the U.S. dollar (USD). Conversely, a decline in employment may indicate an economic slowdown, potentially weakening the USD.
- Example: For instance, if the NFP report shows an increase of 250,000 jobs when only 200,000 were expected, this positive surprise could lead to a rally in the USD against other currencies like the Euro (EUR) or Japanese Yen (JPY).
Algorithmic and Quantitative Trading for CFD Strategies
Algorithmic and quantitative trading are transforming how traders engage with CFD (Contracts for Difference) markets. These advanced strategies utilise technology and data analytics to create systematic approaches that enhance trading precision and efficiency.
Leveraging Trading Algorithms
In the world of Forex and CFD trading, algorithms serve as powerful tools that automatically execute trades based on predefined criteria. These algorithms analyse vast amounts of market data at lightning speed, executing orders based on specific market conditions, and aim to capitalise on price discrepancies and emerging trends.
- Example: An algorithm might be programmed to buy a CFD when the price of a stock falls by 2% within a day and sell it when it rises by 3%, executing these trades instantly without human intervention.
The Importance of Back testing
Back testing is a crucial step in developing trading algorithms. It involves using historical data to simulate how a trading strategy would have performed in the past, allowing traders to assess its potential effectiveness.

- Fact: By understanding a strategy's historical performance, traders can make informed decisions about its potential future mastery reducing the risk of implementing unproven strategies.
As financial analyst Jane Doe puts it, "Back testing provides traders with a retrospective view, enabling them to refine strategies before deploying them in live markets."
The Role of Quantitative Analysis in CFD Trading
Quantitative analysis forms the backbone of algorithmic trading. It involves using mathematical models and statistical techniques to understand and capitalise on market behaviors.
- Quantitative Analysis in CFD Trading: In CFD trading, quantitative analysis involves analysing market data to forecast price movements and identify potential entry and exit points. This data-driven approach helps traders make informed decisions without the influence of human emotions.
High-Frequency Trading (HFT) and Risk Management
High-frequency trading (HFT) is a subset of algorithmic trading characterised by rapid execution speeds and high turnover rates. HFT algorithms move in and out of positions within seconds or milliseconds to capture quick gains from small price movements.
An HFT algorithm might execute thousands of trades in a single day, seeking to gain from minor fluctuations in asset prices across different markets.
Risk management is a critical component of both algorithmic and quantitative trading. Effective strategies include setting stop-loss orders, monitoring leverage, and diversifying portfolios to mitigate potential risks.
Advancements and Accessibility in Algorithmic Trading
Advancements in technology and data analytics have made algorithmic and quantitative trading strategies more accessible to a broader range of traders. These methods offer a systematic approach to the markets, reducing the impact of psychological biases and enabling more disciplined trading.
Takeaway: Continual Learning and Strategy Adaptation.
In the fast-changing world of CFD trading, the ability to continually learn and adapt is crucial. With economic events, market sentiment, and global trends constantly shifting, staying informed and flexible is key to improvement. At ACY Securities, we emphasise a multifaceted approach that combines technical, fundamental, and sentiment analysis to capture a wide range of trading opportunities. Additionally, mastering the psychological aspects of trading, such as maintaining emotional discipline and managing cognitive biases, enhances decision-making and overall performance.
Using a demo account is an excellent way to explore different trading strategies and understand their potential outcomes. It provides a safe environment to build and refine your skills, preparing you for real market conditions.
At ACY Securities, we empower traders by providing:
- Education Tailored to You: Catering to traders of all levels, we offer a diverse range of educational resources.
- Informed Trading: We ensure you are not trading in the dark. Our expert insights and analysis support your trading decisions, helping you navigate the markets more confidently.
- Ready to Dive In? Open your account with us today and begin a journey of growth and learning. Embrace the opportunity to grow, learn, and excel in the dynamic trading landscape with ACY Securities.
Explore ACY Securities expert-led webinars to help traders navigate the world of the forex market. Learn more about Shares, ETFs, Indices, Gold, Oil and other tradable instruments we have on offer at ACY Securities.
You can also explore our MetaTrader 4 and MetaTrader 5 trading platforms including access to our free MetaTrader scripts. Then try out your own trading strategies on your own free demo trading account.
Try These Next

