What You Need to Know About Hockey Stick Chart Pattern in Forex Trading
2024-06-04 14:58:33


In the intricate and fast-paced world of Forex trading, the ability to interpret chart patterns is paramount. Forex trading involves the global marketplace of currency exchange, where market fluctuations present both opportunities and risks.
One pattern that has demonstrated particularly insightful is the hockey stick chart pattern. This pattern, marked by an initial phase of relative stability followed by a sudden and dramatic shift, is essential for traders aiming to anticipate significant market movements.
Understanding and mastering the hockey stick chart pattern is critical for informed trading decisions. This pattern helps traders identify potential breakout points and sharp price increases, making it a powerful tool in a trader's arsenal.
At ACY Securities, we recognise the significance of such patterns in enhancing trading strategies. By leveraging our advanced trading platforms and resources, traders can gain a comprehensive understanding of the hockey stick chart effect, enabling them to navigate the complexities of the forex market with greater precision and confidence. This article will explore the fundamentals of the hockey stick chart pattern, its identification, and practical strategies for trading it effectively.
What is the Hockey Stick Chart Pattern?
The hockey stick chart pattern is a visual representation that resembles a hockey stick, making it easy to identify once you know what to look for. This pattern is characterised by three key elements: a stable period, an inflection point, and a sudden, sharp increase.
Definition and Visual Representation
Imagine a line chart where the data points remain relatively flat over a period, representing a stable or consistent phase. This is the blade of the hockey stick. Suddenly, the line bends sharply upward, forming the handle of the stick.
This dramatic shift indicates a significant change in the trend. In Forex trading, this sharp increase can signal a potential breakout or major price movement.

Key Characteristics
- Stable Period: This is the long, flat portion of the chart where there is little to no significant change in data. For example, a currency pair might trade within a narrow range of 1.1000 to 1.1050 for several weeks, showing stability.
- Inflection Point: The point where the stable line begins to change direction is the inflection point. This is often a precursor to the upcoming significant change. For instance, if the price of a currency pair suddenly starts to move beyond its usual range, this could be the inflection point.
- Sudden, Sharp Increase: Following the inflection point, the chart shows a dramatic upward shift. This sharp increase, often a rise of 20% or more in a short period, represents the handle of the hockey stick. For example, after weeks of stability, a currency pair might suddenly jump from 1.1050 to 1.1500 within a few days, indicating a strong upward trend.
Examples of the Hockey Stick Chart Pattern
The hockey stick chart pattern is not exclusive to Forex trading; it can be observed in various fields:
- Global Temperatures: Climate change data often shows a long period of stable global temperatures, followed by a sharp increase in recent decades. For instance, from 1880 to 1980, global temperatures increased slowly, but from 1980 to 2020, there was a sudden rise of about 1°C.
- Sales Data: A company's sales might remain steady for years and then suddenly spike due to a successful product launch. For example, a tech company might see steady annual sales of $10 million, which suddenly increase to $15 million in one year due to a new gadget.
- Poverty Statistics: In economic studies, poverty rates in a region might stay stable for a long period and then sharply decrease due to effective policy interventions. For instance, a country might maintain a poverty rate of 20% for a decade, then see it drop to 10% within a few years due to improved economic policies.
Understanding the hockey stick chart pattern can greatly enhance a trader's ability to project and respond to significant market shifts.
Identifying the Hockey Stick Chart Pattern in Forex Trading
The hockey stick chart pattern is characterised by an initial period of relative stability, followed by a dramatic shift. This pattern consists of three main phases:
1. Blade Phase: The pattern begins with a stable or gradually increasing trend, which is often represented by a nearly horizontal or slightly inclined line. This phase shows a period of minimal change and can last from several days to months, depending on market conditions.

2. Inflection Point: This is the critical juncture where the trend shifts direction. Following the flat or stable period, the line begins to bend sharply, indicating a significant change in momentum. Identifying this point is crucial for traders, as it often precedes a rapid increase in price or volume.
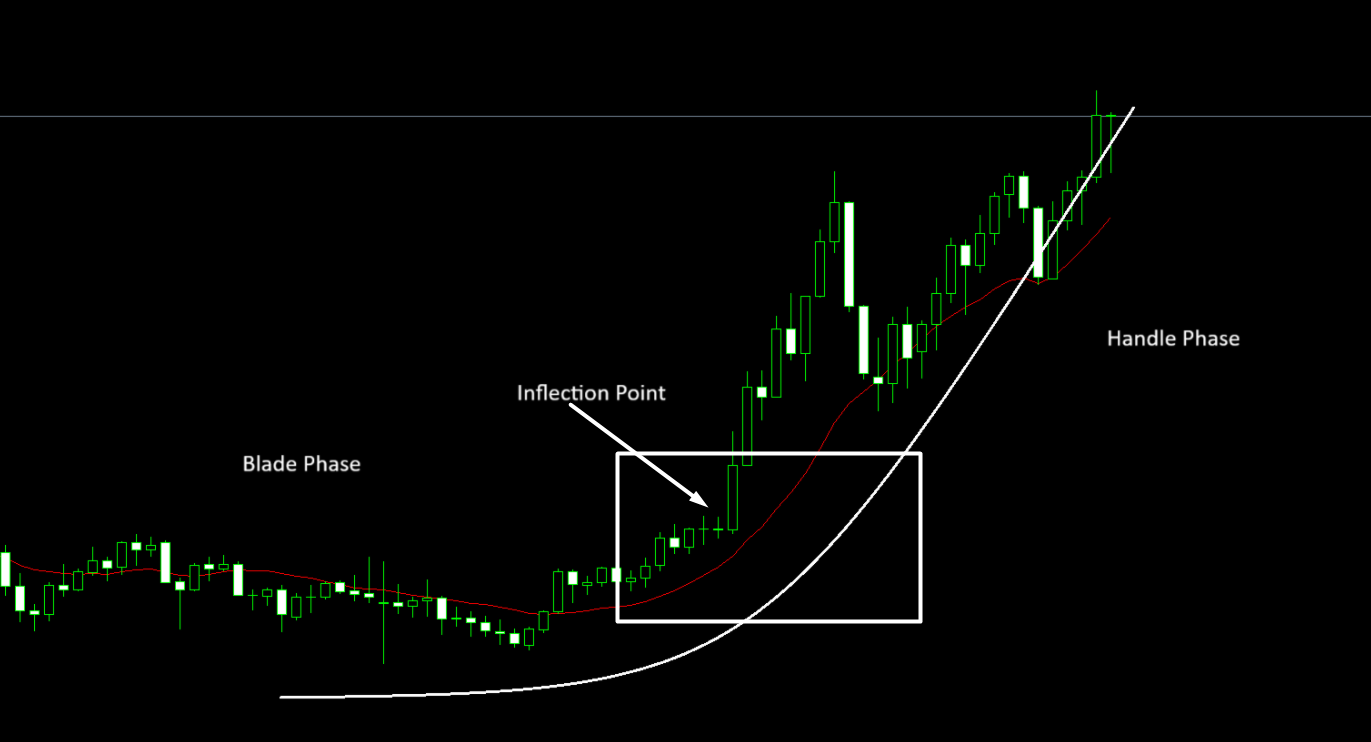
3. Handle Phase: The final phase is marked by a sharp, continuous upward trajectory, resembling the handle of a hockey stick.

This phase signals rapid growth and often coincides with a surge in trading volume, confirming the strength of the upward trend.
Key Indicators
To effectively identify the hockey stick chart pattern, traders should look for the following key indicators:
- Data Points: Analyse historical data to detect periods of stability and subsequent rapid changes.
- Flat Period: Look for a prolonged phase where prices remain relatively stable or show minimal movement.
- Sharp Increase: Identify the point where the price begins to rise steeply, signalling the start of the handle phase.
How to Spot the Inflection Point and Understand Causative Factors
Spotting the inflection point involves recognising the shift from stability to rapid growth. This critical juncture often correlates with changes in market sentiment, economic news, or significant events impacting the asset's value. Traders should monitor news feeds, economic indicators, and market analysis to understand the factors driving this shift.

In the provided chart example (USD/JPY Monthly), the blade phase shows a period of relative stability from October 2017 to April 2021, where the price fluctuated between approximately 104 and 114.
The inflection point occurs around April 2021, where the trend shifts direction, leading to the handle phase, characterised by a sharp upward movement, reaching around 157 by April 2024.
Role of the X-axis (Time) and Y-axis (Price or Volume) in Identifying the Pattern
The X-axis on the chart represents time, while the Y-axis represents price or volume. By analysing these axes, traders can visualise the pattern effectively.
- X-axis (Time): Observe the duration of the flat period (blade phase) and the timing of the inflection point. In the example, the flat period spans from October 2017 to April 2021. The inflection point starts in April 2021, indicating the beginning of the handle phase.
- Y-axis (Price or Volume): Look for a consistent price level during the blade phase, followed by a sharp increase in price or volume during the handle phase. In the example, the price remains relatively stable between 104 and 114 during the blade phase. Post-inflection, there's a sharp increase, with the price rising to approximately 157, indicating a strong upward trend.
Real-time Example
In the USD/JPY example, price stability around 104-114 represents the blade phase. The inflection point occurs when the price starts to increase around April 2021, leading to a sharp upward trend that reaches 157 by April 2024. Higher trading volumes often validate this increase, indicating strong market interest and a sustained trend.
By understanding and identifying these key elements, traders can effectively leverage the hockey stick chart pattern to make informed trading decisions and capitalise on significant market movements. Monitoring economic indicators, market news, and trading volumes can provide additional insights into the causative factors driving these patterns.
Strategies for Trading the Hockey Stick Chart Pattern
Entry Points
- Identifying the Right Moment to Enter the Market: To capitalise on the hockey stick chart pattern, it’s crucial to enter the market at the right moment. In the provided USD/JPY example, the ideal entry point is around the inflexion point when the price begins to break out from the stable range. This occurs around April 2021, when the price starts rising from the stable range of 104-114.
- Using Line Charts to Recognise Sudden Bends Indicative of a Breakout: Line charts can help traders spot the sudden bends that signal the start of the handle phase. As the price breaks above the upper limit of the stable range (around 114), it indicates a potential breakout. Entering the trade around this level can position traders to benefit from the subsequent sharp increase.

- Entry Point: Enter the market at the inflection point, around April 2021, when the price breaks above 114.
Stop-Loss Orders
- Importance of Setting Stop-Loss Orders to Manage Risk: Setting stop-loss orders is crucial to manage risk and protect against unexpected market reversals. In the context of the hockey stick chart pattern, stop-loss orders help limit losses if the anticipated sharp increase does not materialise.
- Placement of Stop-Loss Orders Relative to the Stable Period and the Inflection Point: In the USD/JPY example, a reasonable stop-loss order could be placed just below the lower end of the stable range, around 103-104. This placement ensures that if the price falls back into the stable range, the trade will automatically close, minimising potential losses.

- Stop-Loss Order: Set a stop-loss order just below the stable range, around 103-104.
Exit Targets
- Setting Realistic Targets Based on Historical Data: Setting targets involves analysing historical data and projecting realistic price levels the asset could reach. Given the sharp increase observed in the handle phase, traders can set initial targets based on past performance and key resistance levels.
- Adjusting Targets as the Sharp Increase Occurs: As the price rises, traders should adjust their targets to maximise gains. In the USD/JPY example, an initial target could be set around 125, a psychological level. As the price continues to rise, traders can adjust their targets incrementally to levels such as 135, 145, and ultimately 157, where the pattern suggests the price could reach.

- Exit Targets: Initial target at 125. Adjust targets to 135, 145, and finally 157 as the price continues to rise.
By following these strategies, traders can effectively leverage the hockey stick chart pattern to make informed trading decisions. Monitoring price levels, using line charts to identify breakouts, and setting appropriate stop-loss orders and targets are key to capitalising on significant market movements.
Conclusion
Mastering the hockey stick chart pattern involves understanding its structure, identifying key phases, and implementing effective trading strategies. This pattern is characterised by a stable period, followed by an inflection point that leads to a sharp increase. By recognising these elements, traders can pinpoint optimal entry points, set appropriate stop-loss orders to manage risk and establish realistic targets.
Identifying the right moment to enter the market is crucial, with the inflection point serving as a key indicator of a potential breakout. Using line charts helps in spotting sudden bends, signalling the start of the handle phase.
Stop-loss orders placed relative to the stable period and inflection point ensure risk management, while targets should be set based on historical data and adjusted as the price rises.
At ACY Securities, we empower traders by providing:
- Education Tailored to You: Catering to traders of all levels, we offer a diverse range of educational resources.
- Informed Trading: We ensure you're not trading in the dark. Our expert insights and analysis support your trading decisions, helping you navigate the markets more confidently.
- Ready to Dive In? Open your account with us today and begin a journey of growth and learning. Embrace the opportunity to grow, learn, and excel in the dynamic trading landscape with ACY Securities.
Explore ACY Securities' expert-led webinars to help traders navigate the world of the forex market. Learn more about Shares, ETFs, Indices, Gold, Oil and other tradable instruments we have on offer at ACY Securities.
You can also explore our MetaTrader 4 and MetaTrader 5 trading platforms including access to our free MetaTrader scripts. Then try out your own trading strategies on your own free demo trading account.
FAQs: Mastering the Hockey Stick Chart Pattern in Forex Trading for Beginners
1. What is the hockey stick chart pattern in Forex trading?
The hockey stick chart pattern is a visual representation that resembles a hockey stick. It consists of three key phases: a stable period (blade), an inflection point where the trend changes direction, and a sudden, sharp increase (handle). This pattern is essential for traders as it helps identify potential breakout points and significant price movements.
2. How do I identify the inflection point in a hockey stick chart pattern?
Spotting the inflection point involves recognising the shift from stability to rapid growth. This point often correlates with changes in market sentiment, economic news, or significant events impacting the asset's value. In the USD/JPY example, the inflection point occurred around April 2021, when the price began to rise from the stable range of 104-114, signalling the start of the handle phase.
3. What are the key indicators to look for when identifying a hockey stick chart pattern?
Key indicators include:
- Data Points: Analyse historical data to detect periods of stability and subsequent rapid changes.
- Flat Period: Look for a prolonged phase where prices remain relatively stable.
- Sharp Increase: Identify the point where the price begins to rise steeply, signalling the start of the handle phase. Higher trading volumes during this phase often validate the pattern's strength.
4. How should I set stop-loss orders when trading the hockey stick chart pattern?
Setting stop-loss orders is crucial to manage risk. Place stop-loss orders relative to the stable period and the inflection point. For example, in the USD/JPY chart, a reasonable stop-loss order could be placed just below the lower end of the stable range, around 103-104. This ensures that if the price falls back into the stable range, the trade will automatically close, minimising potential losses.
5. What are some effective exit target strategies for trading the hockey stick chart pattern?
Setting realistic targets involves analysing historical data and projecting price levels the asset could reach. Initially, set targets at key resistance levels, such as 125 in the USD/JPY example. As the price continues to rise, adjust targets incrementally to levels such as 135, 145, and ultimately 157, where the pattern suggests the price could reach. This approach helps maximise gains while managing risk effectively.
Try These Next
4 Powerful Tactics to Overcome the Most Costly Forex Mistakes
How to Master MT4 & MT5 - Tips and Tricks for Traders
The Importance of Fundamental Analysis in Forex Trading
Forex Leverage Explained: Mastering Forex Leverage in Trading & Controlling Margin
The Importance of Liquidity in Forex: A Beginner's Guide
Close All Metatrader Script: Maximise Your Trading Efficiency and Reduce Stress
Best Currency Pairs To Trade in 2025
Forex Trading Hours: Finding the Best Times to Trade FX
MetaTrader Expert Advisor - The Benefits of Algorithmic Trading and Forex EAs
Top 5 Candlestick Trading Formations Every Trader Must Know


0.0 Pips
spreads from
1:500
Leverage
Under 30ms*
Ultra-Fast Order Processing
2,200+
Tradeable Instruments
Regulated
Client Focus Approach