UKBRENT Oil Price Forecast: Why Brent Crude Oil Is Set for a Mean-Reversion Crash
2026-03-17 13:57:37


Tuesday, March 17, 2026
The financial world is fixated on the $100 mark, but while retail traders are frantically hitting the "buy" button on the latest dip, a far more calculated move is unfolding behind the scenes.
Right now, UKBRENT is the epicenter of a classic "Priced-In Trap." The narrative fueled by the escalating conflict in Iran, skyrocketing fuel oil premiums in Singapore (reaching $140/bbl), and a fractured Federal Reserve suggests $120 is a certainty. However, the price action on our charts tells a different story: one of a vertical blow-off top and imminent institutional distribution.
If you’ve been waiting for the "perfect" time to enter the oil market, you need to look past the headlines. The $100 level isn't a floor; it’s a ceiling that’s about to give way to a violent mean-reversion crash.
Oil Price Technical Deep Dive: The Anatomy of a Blow-Off Top
Read more about the 'Crowd Psychology' in our Forex News Mastery eBook
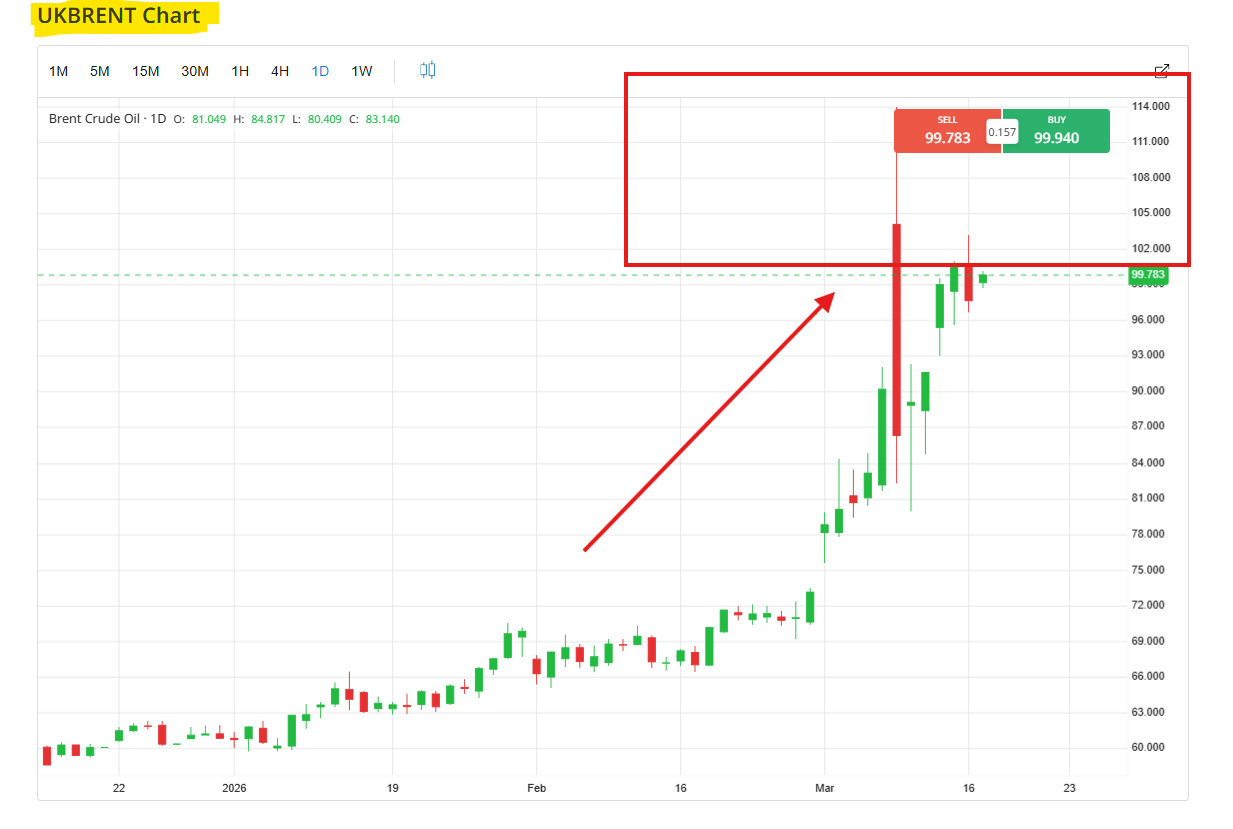
Looking at the UKBRENT 1D chart, the technical picture is one of extreme overextension. Since early February, we have seen a parabolic rise that accelerated sharply in March.
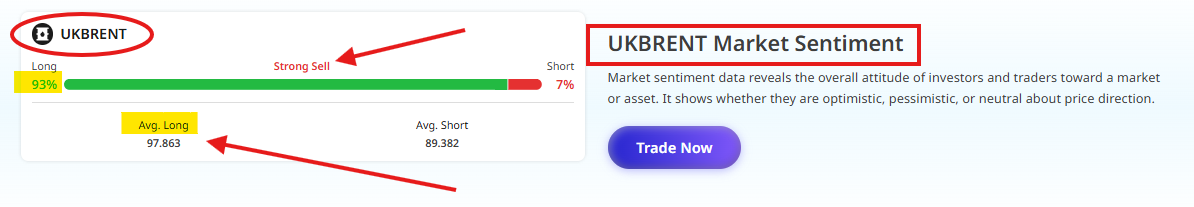
- The $100 Psychological Magnet: Price is currently oscillating between $99.85 and $100.00. This is the ultimate "retail trap" zone. While the breakout above $96 looked strong, the momentum is stalling exactly where the "smart money" typically begins unloading long positions into the hands of FOMO-driven retail buyers.
- Candlestick Exhaustion: Notice the long upper wicks on the most recent daily candles. Despite the bullish fundamental noise, sellers are stepping in aggressively every time Brent attempts to sustain a move above $103. This is institutional distribution in its purest form.
- Mean Reversion Distance: Price is currently trading significantly above its 20-day and 50-day moving averages. In the world of commodity trading, "the rubber band only stretches so far." A reversion to the $87.00 or even $84.00 level would be a standard technical correction, representing a 13-15% drop from current levels.
Oil Price Fundamental Context: The Iran War Risk and the Fed's Dilemma
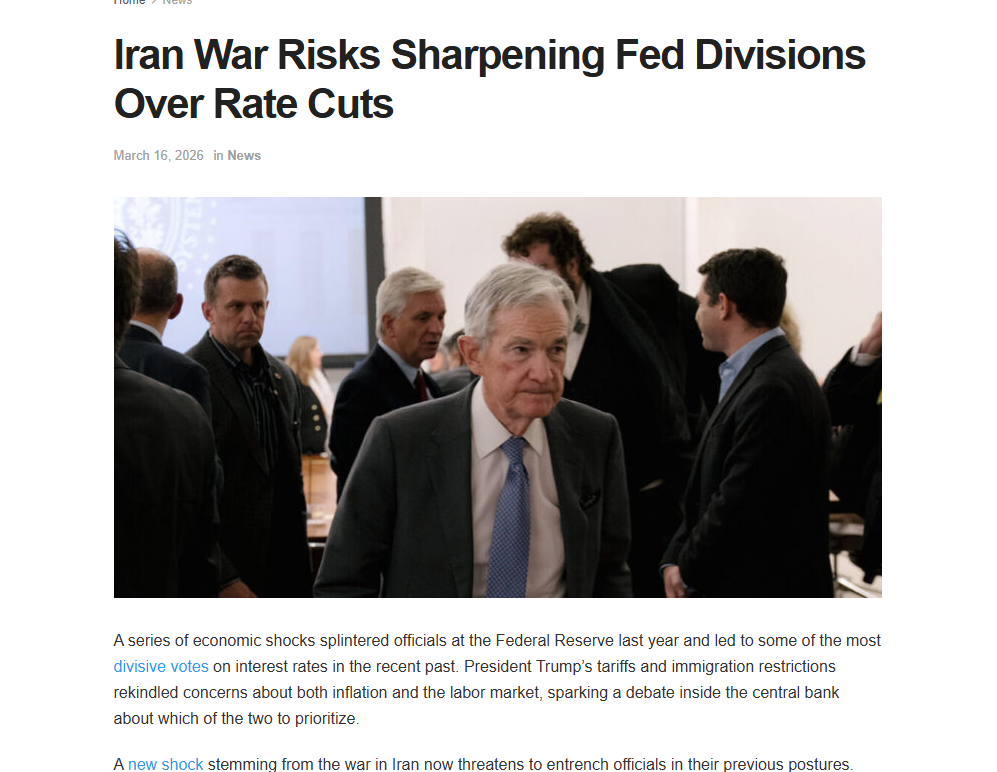
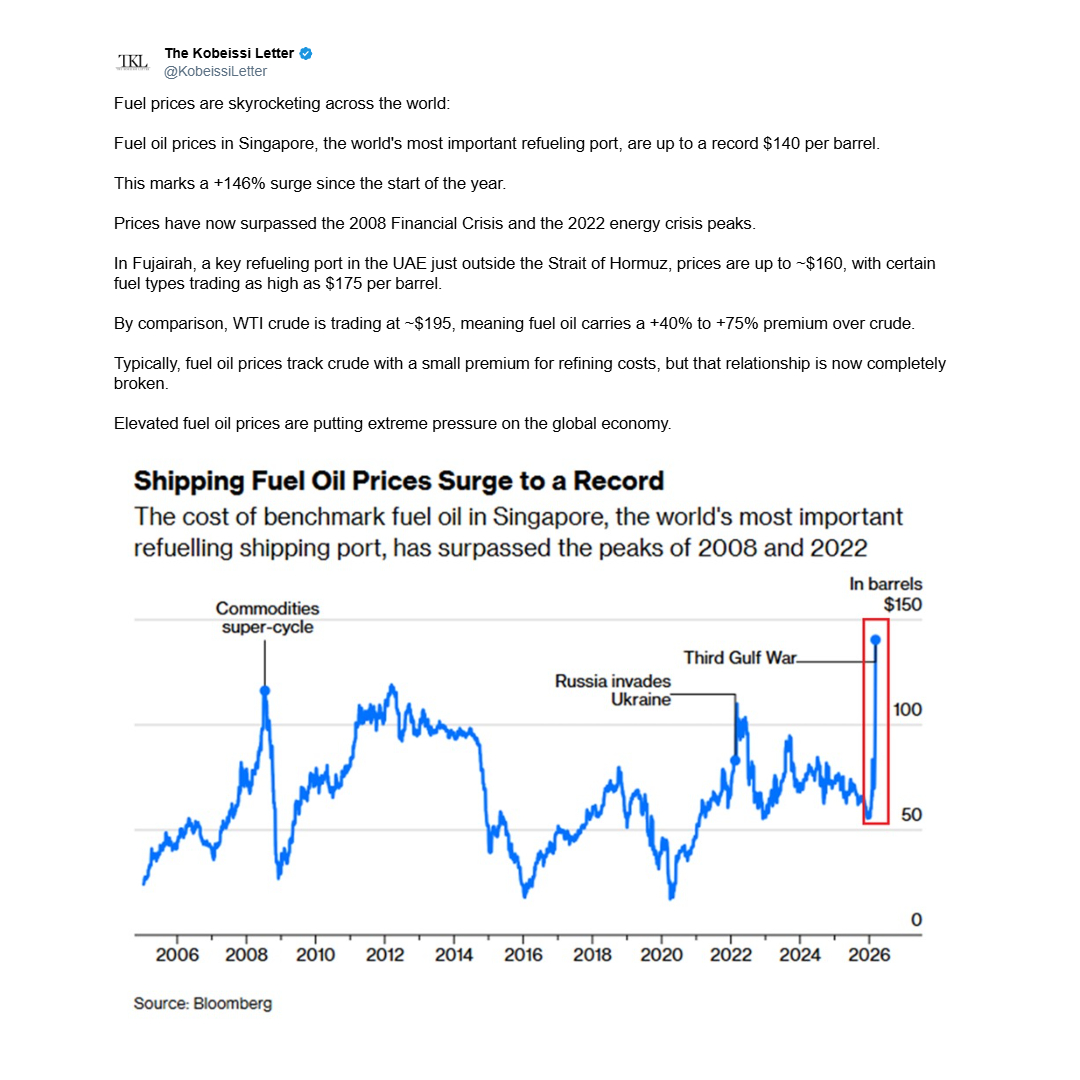
The fundamental narrative for Tuesday, March 17, 2026, is dominated by the shockwaves of the U.S.-Israeli strikes on Iran. This has sent fuel oil prices in Fujairah to $160/bbl, creating a broken relationship where fuel oil carries a 40-75% premium over crude.
However, the "Priced-In Trap" (referenced on Page 13 of the Forex News Mastery eBook) is in full effect here. The market has already factored in the supply shortfall. What it hasn't factored in is the "Demand Destruction" caused by these very prices. As Americans face $3.70/gallon at the pump, the labor market already showing signs of softening in February is reaching a breaking point.
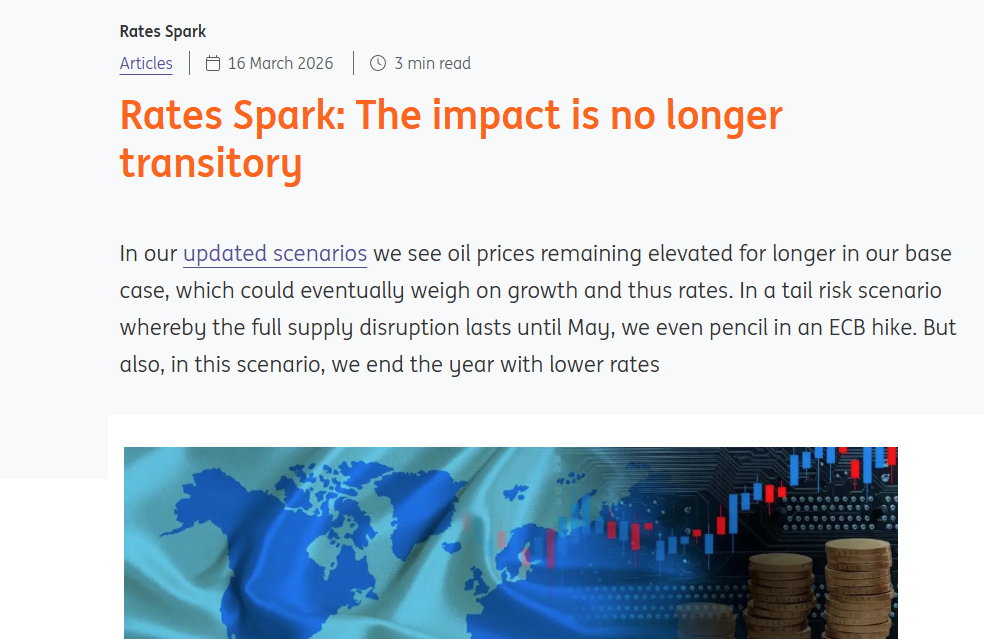
Furthermore, the Federal Reserve is internally "splintered." With Jerome Powell nearing the end of his term and Kevin Warsh set to succeed him, the market is bracing for a period of policy paralysis. If the Fed holds rates steady tomorrow (Wednesday), as expected, the "higher for longer" narrative will collide with a weakening global economy, stripping the floor out from under oil demand.
Oil Price Global Session Watch: Navigating the Volatility of Brent Crude Oil
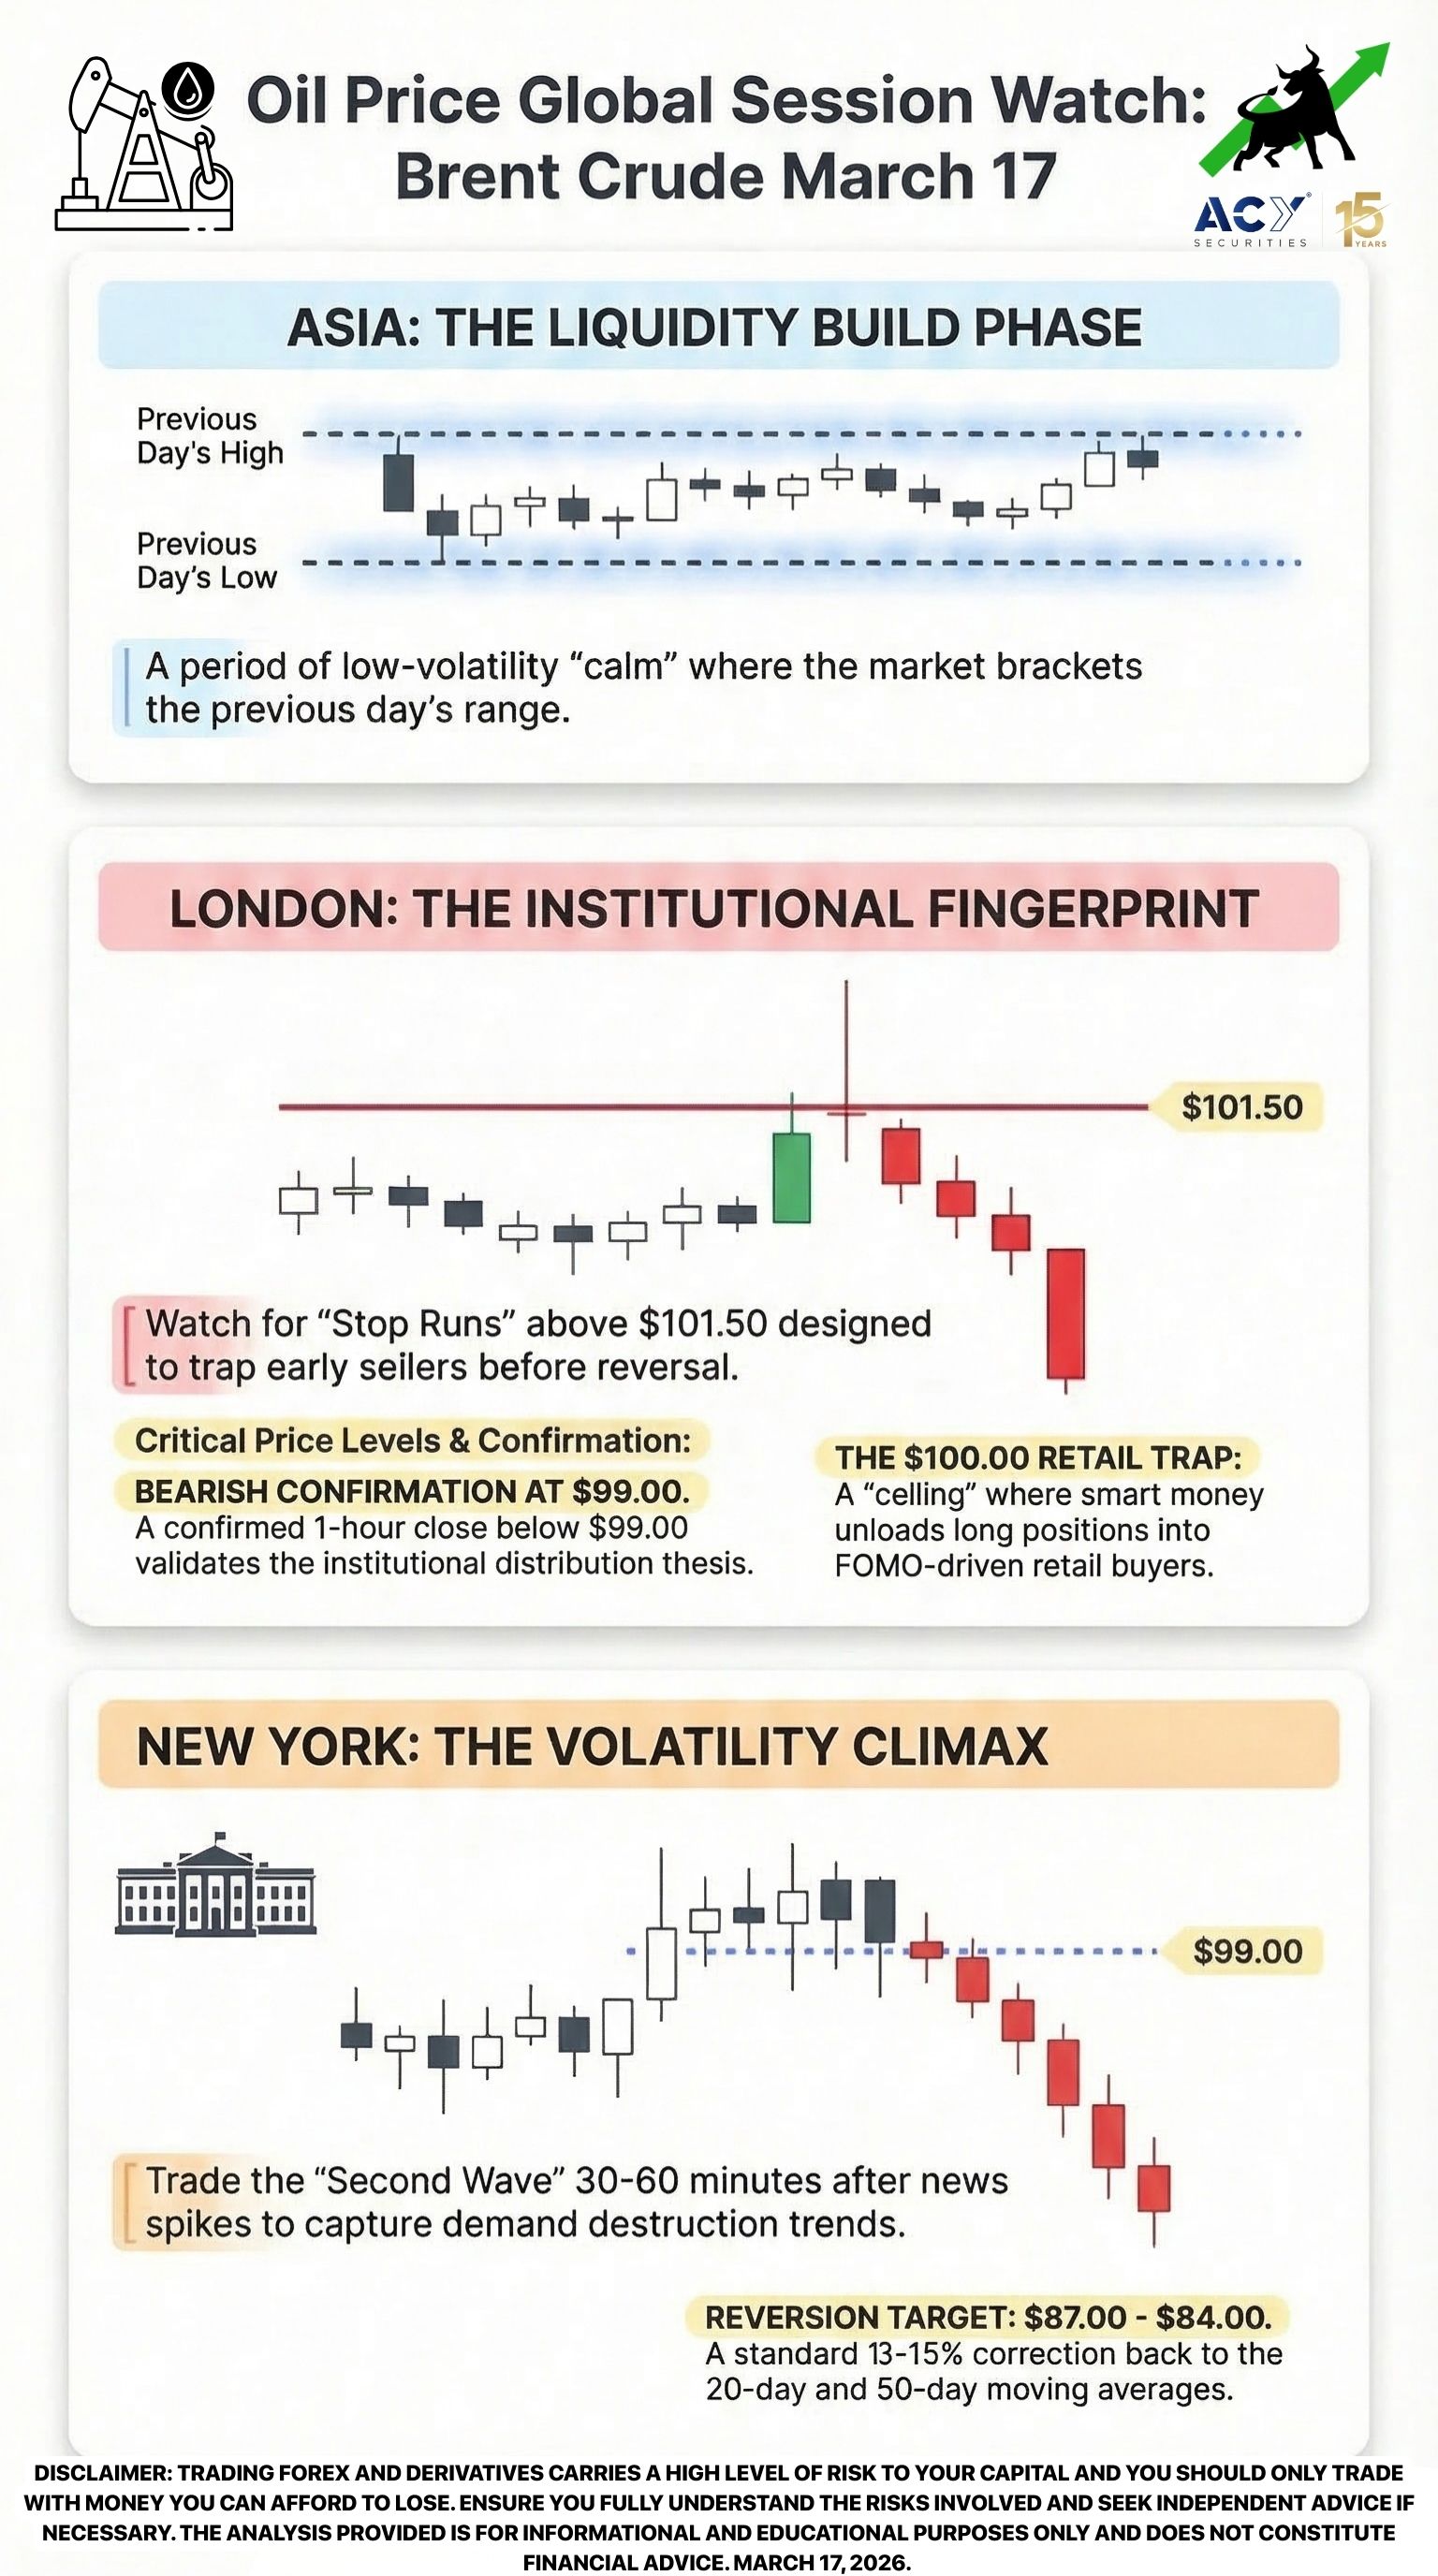
Oil Price Asian Session: The Calm Before the Storm
Forget the 1-minute noise during the Tokyo open; that's where accounts go to die. Since you have the discipline to wait for institutional setups, you’ll find that the Asian session is currently serving as a "liquidity build" phase. The market is essentially "waiting" for London to define the day's bias. Instead of guessing the direction, use this time to map out the previous day's high and low.
This approach naturally aligns with your patience to wait for the highest probability moves, removing the stress of mid-session "chops." To master this period, I recommend reviewing the Dual-Sided Breakout strategy on Page 25 of the Forex News Mastery eBook, which explains how to bracket the Asian range to catch the London expansion.
Will you set your alerts for the range breakout, or wait for the 4 AM GMT close?
Oil Price London Session: The Institutional Fingerprint
Ignore the "breakout" in the first 15 minutes of London. This is often a "stop run" designed to trap early sellers before a reversal. Because you understand market structure, you see that the London session is where the "Smart Money" reveals its true hand. If London fails to hold Brent above $101.50, the mean-reversion thesis is confirmed.
Your ability to ignore the hype allows you to see this for what it is: a distribution phase. On Page 15, the eBook covers the Sentiment Fade, a tool perfectly suited for this environment where the news is "max bullish" but the price is stagnant.
Do you prefer the aggressive entry at the $101.50 rejection, or will you wait for a confirmed 1-hour close below $99.00?
Oil Price New York Session: The Volatility Climax
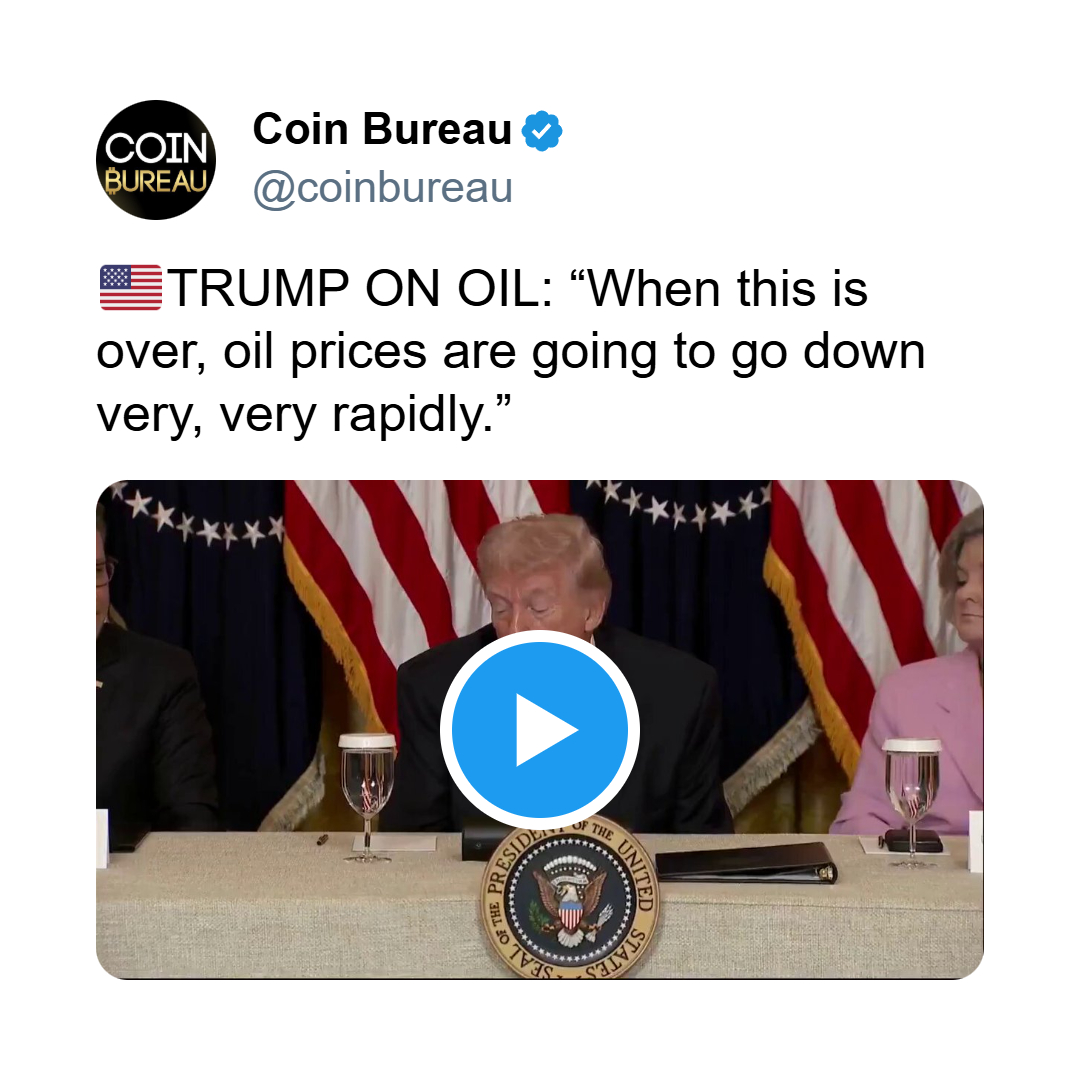
Don't get distracted by the headlines coming out of the White House or the Fed during the NY session. While others are reacting to the "latest" tweet or news flash, your focus should remain on the $98.50 level. NY is when the "Demand Destruction" narrative usually hits the tapes.
This setup naturally aligns with your ability to remain calm during high-volatility events. As discussed on Page 27 (Post-Announcement Strategy), the real move often happens 30 to 60 minutes after the initial news spike. This "second-wave" entry is where the most consistent profits are found.
Are you planning to trade the initial volatility spike, or are you waiting for the 10:30 AM EST "reversal window"?
5 Oil Trading Strategies for UKBRENT March 17, 2026
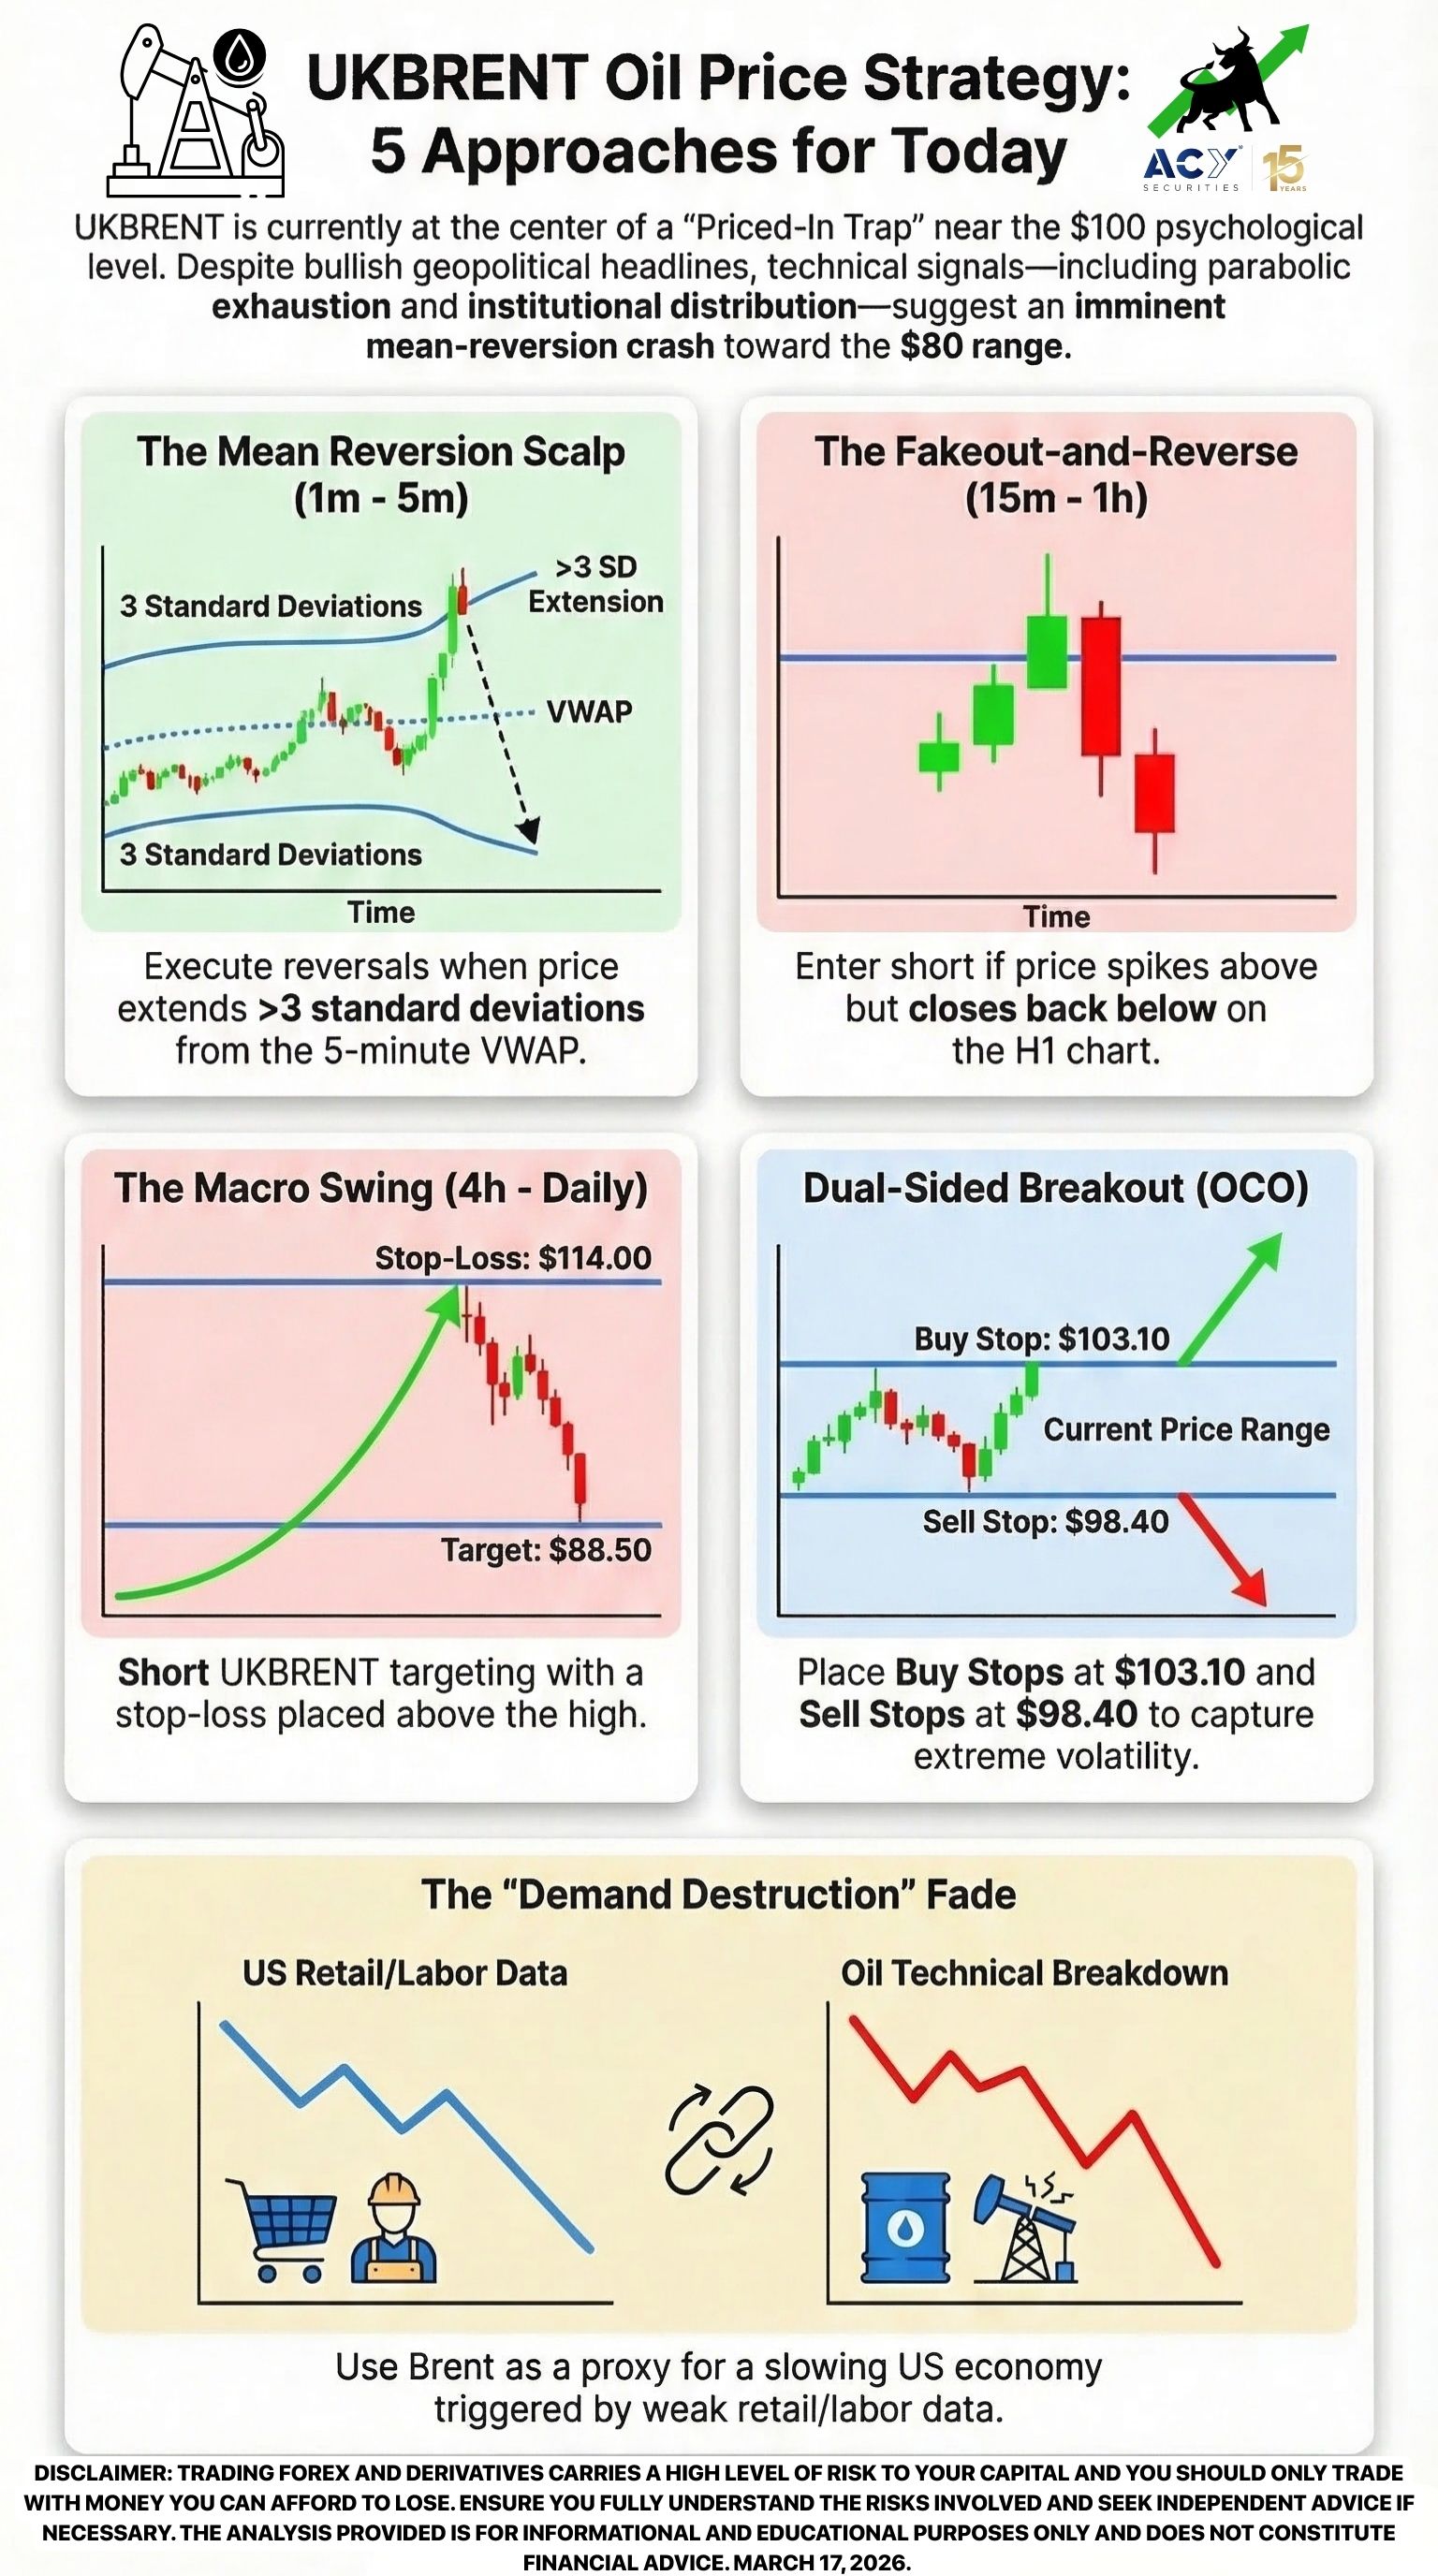
1. Oil Scalping Strategy (1m - 5m Timeframe)
- The Setup: Focus on the "Mean Reversion" back to the 5-minute VWAP. When price extends more than 3 standard deviations from the mean during the London open, look for a reversal candle.
- Pros: High frequency, low overnight risk. Cons: Requires lightning-fast execution.
- The ACY Edge: Forget trying to catch a $10 move; focus on the 20-cent fluctuations. Your reaction speed is your greatest asset here. This setup removes the stress of guessing the daily trend by focusing on immediate liquidity gaps. Refer to the Sentiment Fade on Page 15 to identify when retail buyers are "exhausted." Will you use a fixed take-profit or trail your stop?
2. Oil Day Trading Strategy (15m - 1h Timeframe)
- The Setup: Look for a "Fakeout-and-Reverse" at the $103.00 level. If price spikes above $103 but closes back below on the hourly chart, enter short.
- Pros: Clear risk-to-reward ratios. Cons: Susceptible to "headline" spikes.
- The ACY Edge: Stop chasing the breakout. Since you have the foresight to see that $100 is a "Priced-In Trap," you can wait for the failed breakout that liquidates the FOMO buyers. This is a classic Page 13 "Priced-In Trap" scenario. Do you prefer the limit order at $102.80 or a market execution on the hourly close?
3. Oil Swing Trading Strategy Mean Reversion (4h - Daily Timeframe)
- The Setup: Shorting UKBRENT with a target of $88.50. Stop-loss placed above the 2026 high of $114.00.
- Pros: Captures the "Big Move." Cons: Requires significant margin and patience.
- The ACY Edge: Ignore the daily "up" days. Your ability to see the "Big Picture" allows you to hold through the noise. This strategy aligns with the Dual-Sided Breakout concepts on Page 25, specifically focusing on the breakdown of the parabolic curve. Will you enter your full position now, or scale in as $96.00 breaks?
4. Oil Dual-Sided Breakout Strategy
- The Setup: Place a Sell Stop at $98.40 and a Buy Stop at $103.10.
- Pros: You profit regardless of which way the "Iran War" news breaks. Cons: Risk of a "whipsaw" if the market remains range-bound.
- The ACY Edge: Forget trying to predict the outcome of the Fed meeting. This method removes the ego from trading. Your intelligence lies in acknowledging that the market is at a tipping point. As prescribed on Page 25, this is the safest way to trade extreme volatility. Will you set the OCO (One-Cancels-Other) order now or monitor the London open?
5. The "Demand Destruction" Fade (Oil Fundamental Trading Strategy)
- The Setup: Shorting Brent as a proxy for a slowing US economy, specifically looking for weak Retail Sales data or further "Soft Labor" reports.
- Pros: High fundamental conviction. Cons: Fundamentals can take weeks to manifest in price.
- The ACY Edge: Stop looking at oil as just "supply." Your focus on the "Demand" side of the equation puts you ahead of 90% of the market. This approach naturally aligns with the Post-Announcement Strategy on Page 27. Do you prefer to wait for the next EIA report or trade the current technical breakdown?
Conclusion & The ACY Edge
The "Brent to $120" narrative is a seductive one, but the data suggests we are at the climax of the move. Between the extreme fuel oil premiums and the splintered Federal Reserve, the "rubber band" is ready to snap. By applying the Dual-Sided Breakout and understanding the "Priced-In Trap," you position yourself to profit while others are caught in the liquidation.
At ACY Securities, we don't just provide liquidity; we provide the roadmap. To truly master these high-stakes environments, you need to move beyond basic charts.
Your Next Steps:
- Download the Forex News Mastery eBook: Deep dive into the Priced-In Trap (Page 13) and the Dual-Sided Breakout (Page 25) to refine your entry timing.
- Open a Demo Account: Test the UKBRENT mean-reversion thesis in a risk-free environment before the NY session volatility hits.
Will you continue to follow the retail herd into the $100 trap, or will you execute with institutional precision?
Disclaimer: Trading Forex and Derivatives carries a high level of risk to your capital and you should only trade with money you can afford to lose. Ensure you fully understand the risks involved and seek independent advice if necessary. The analysis provided is for informational and educational purposes only and does not constitute financial advice. March 17, 2026.
延伸阅读

