BTCUSD Price Analysis: Why the $74k Resistance Zone Could Halt the Bitcoin V-Shaped Recovery
2026-03-16 13:07:56


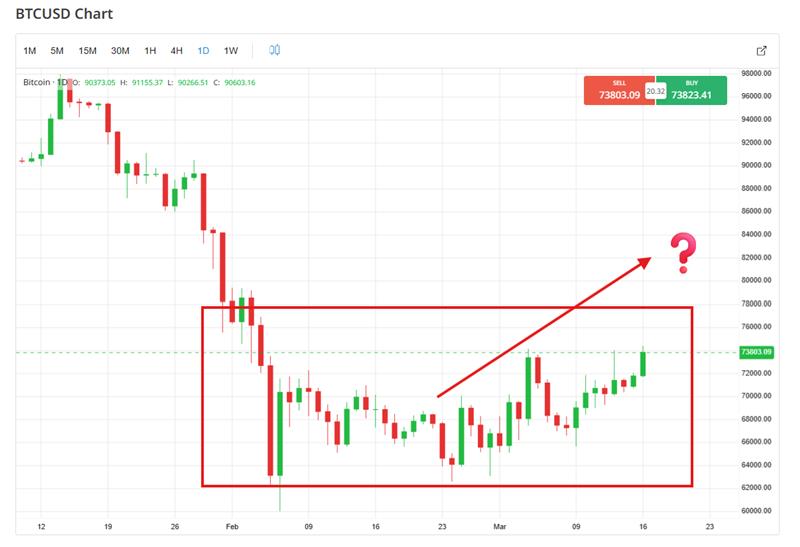
Bitcoin is at a crossroads that separates the "moon boys" from the professional operators. As of today, Monday, March 16, 2026, BTCUSD is trading at $73,786.72, up 3.43% in a move that looks, on the surface, like a textbook V-shaped recovery. However, beneath the hood of this rally lies a "Priced-In Trap" that could catch retail traders off guard.
While the "Fear & Greed Index" remains suppressed in the "Extreme Fear" zone (currently reading 16), price action has decoupled from sentiment. This "disbelief rally" is being driven by a perfect storm: escalating Middle East tensions pushing oil toward $120, a looming FOMC meeting (March 17-18), and a systemic liquidity shock as exchange balances hit 2017 lows.
But there is a massive technical ceiling looming. The $74,000 zone isn't just a round number; it is a graveyard of previous support that has flipped into a formidable supply wall.
BTC Price Technical Deep Dive: The $74k Supply Wall
Read more about the 'Crowd Psychology' in our Forex News Mastery eBook
Looking at the daily BTCUSD chart, the price action from late January and February tells the real story. During the massive February breakdown, the $74,000 level served as a critical floor. When that floor collapsed, it didn't just drop it cratered, leaving behind a "supply vacuum" where institutional sell orders are now lying in wait for a retest.
Key Levels to Watch:
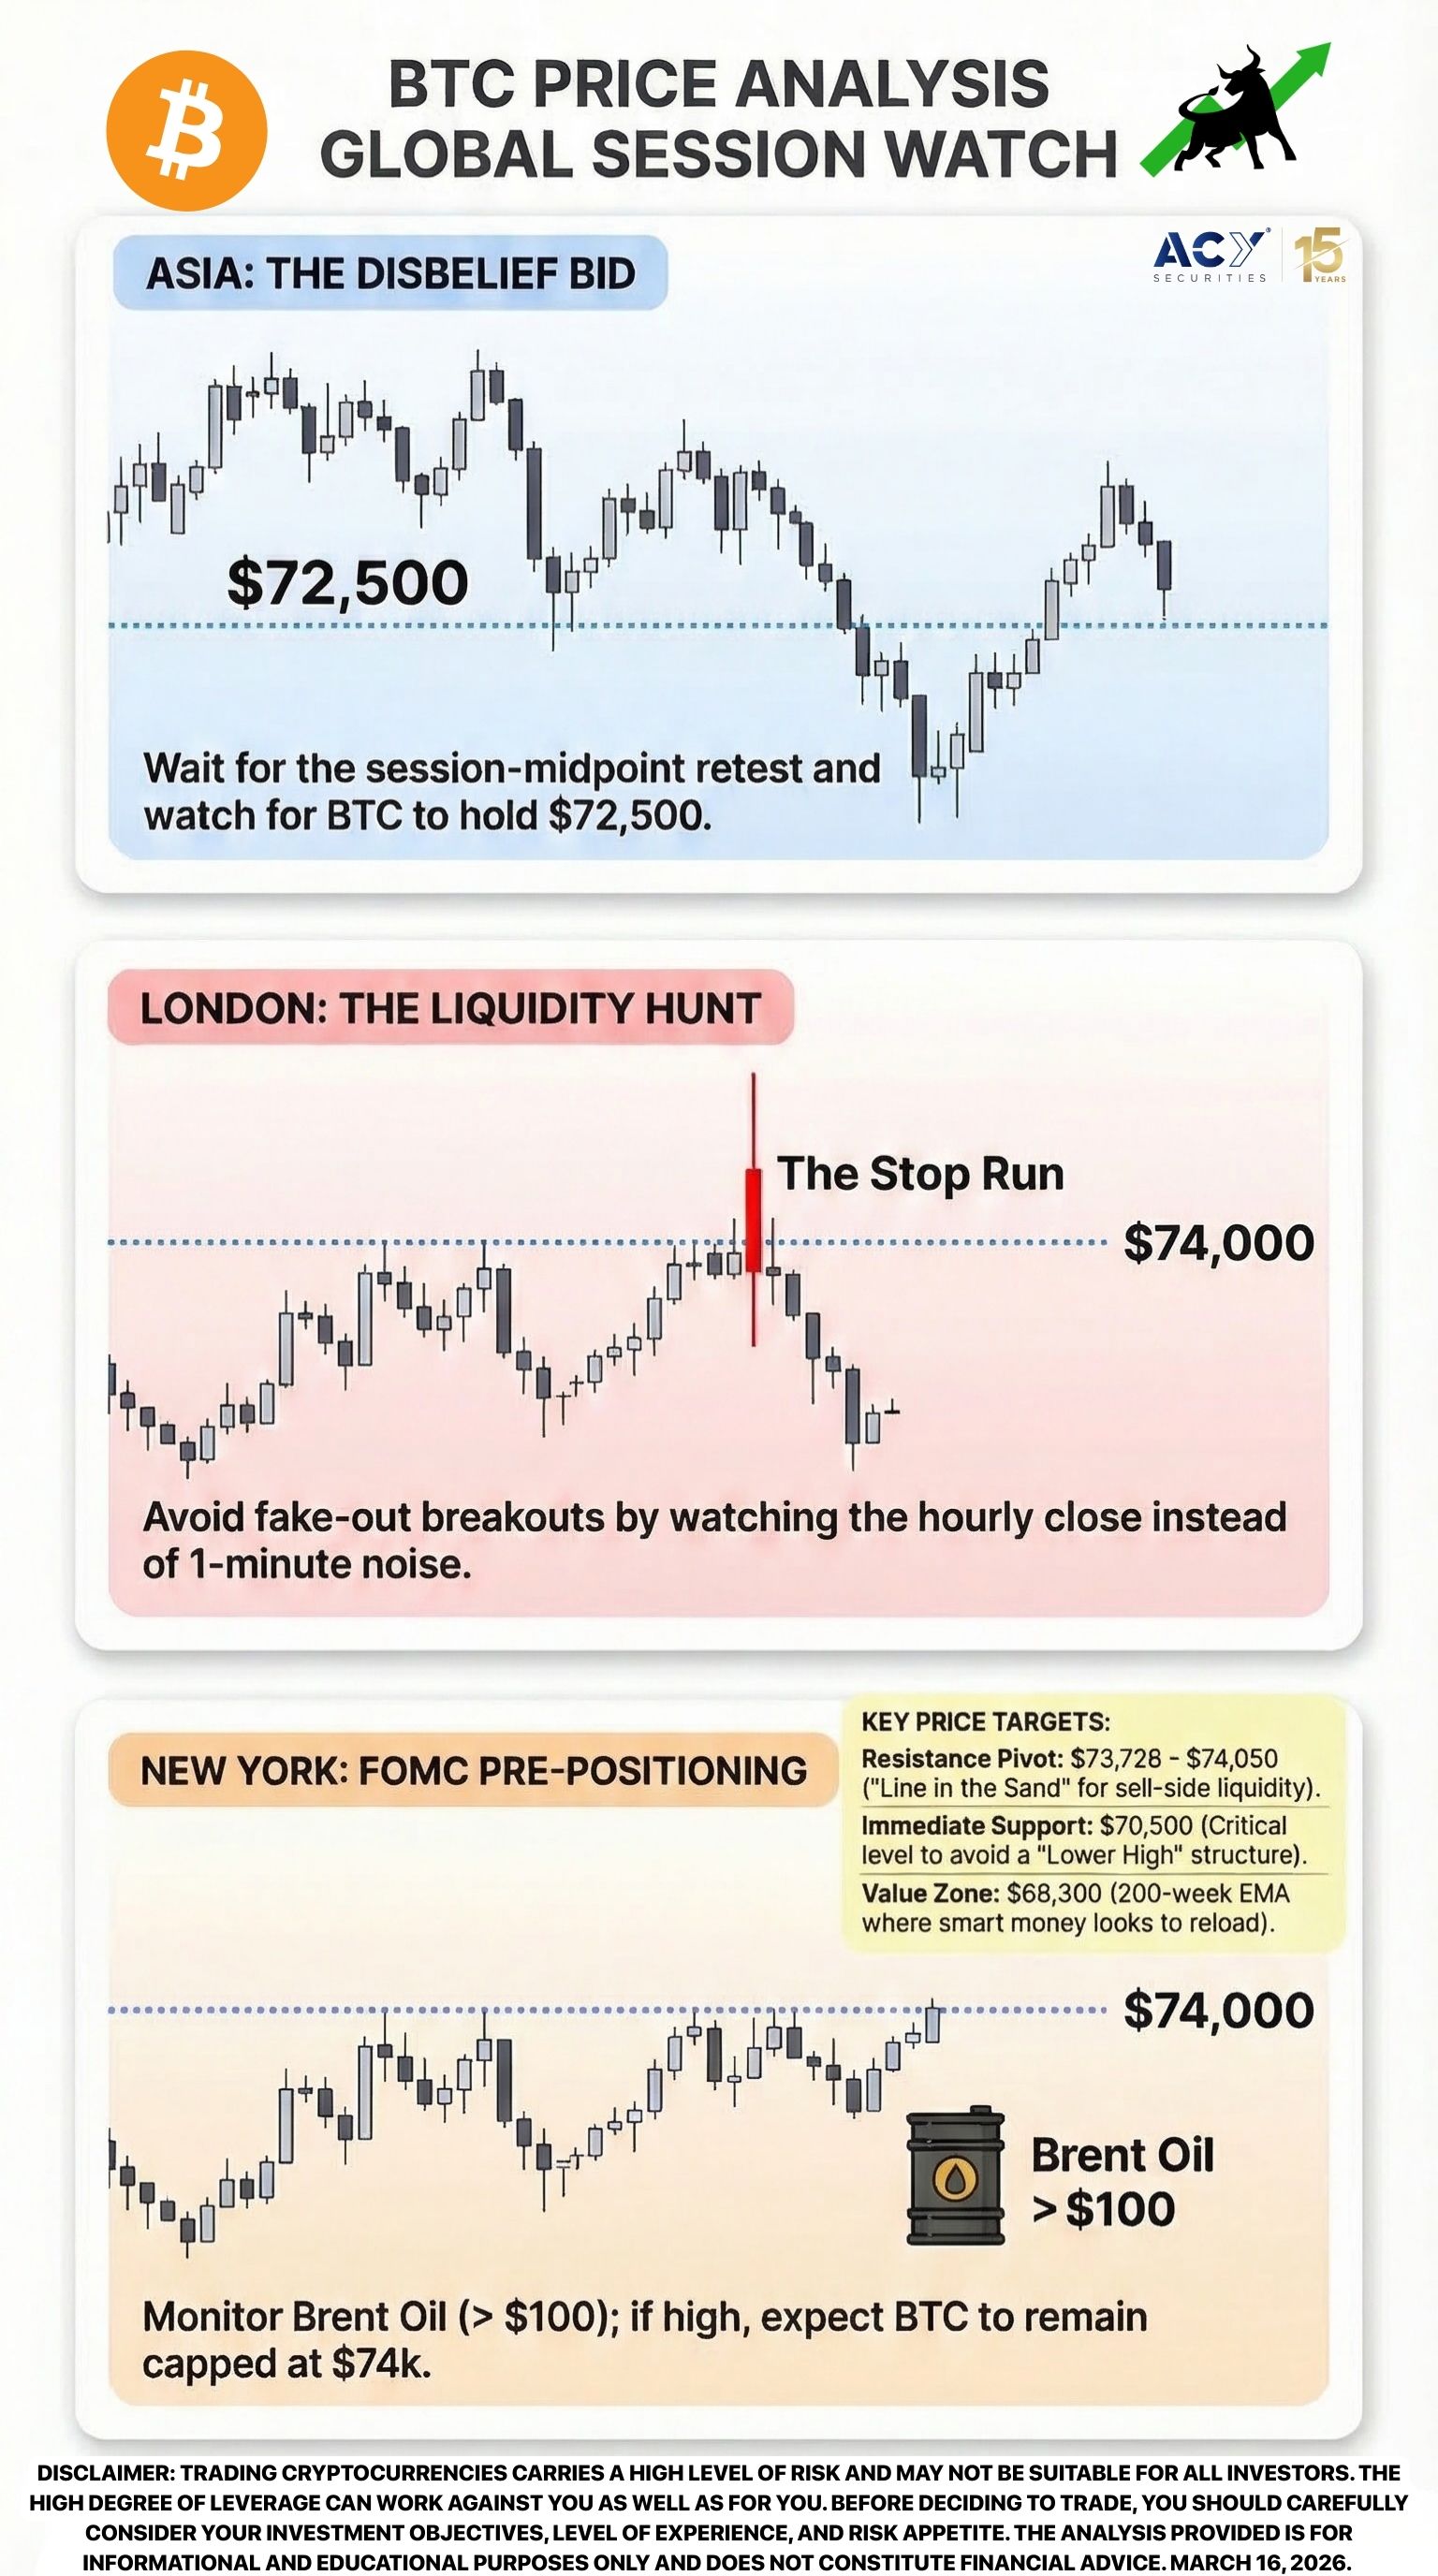
- The Resistance Pivot ($73,726 - $74,050): This is the "Line in the Sand." We are currently seeing a cluster of "wicking" on the 4H and Daily timeframes, suggesting that sell-side liquidity is absorbing the FOMO-buying.
- The Bullish Floor ($70,500): This is the immediate support. A break below this level would invalidate the V-shape recovery and confirm a "Lower High" structure.
- The Value Zone ($68,300): Representing the 200-week EMA and previous 2021 highs, this is where "Smart Money" is likely looking to reload.
The current V-shaped move has been sharp, but it lacks the volume profile of a sustainable trend reversal. Without a decisive daily close above $74,050, the current move risks becoming a "Bull Trap" designed to provide liquidity for larger players to exit before the FOMC decision.
BTC Price Analysis Fundamental Context: Geopolitics vs. Federal Reserve


The fundamental narrative for March 16, 2026, is a tug-of-war between two massive forces:
1. BTC Analysis: The "Energy Hedge" Bid
With Brent Crude futures surging 5% today toward $119 per barrel following strikes on key infrastructure in the Strait of Hormuz, Bitcoin is being bid as a non-sovereign hedge. Unlike 2022, the 2026 market views Bitcoin as "Digital Gold" during energy-driven inflationary shocks. This is evidenced by the $767 million in ETF inflows last week, led by BlackRock’s IBIT.
2. BTC Analysis: The FOMC "Dot Plot" Shadow
The Federal Reserve meets tomorrow, March 17. While a rate hold at 3.50%–3.75% is 94% priced in, the "Dot Plot" (the Fed’s internal rate projections) is the real danger. If the Fed signals "zero cuts" for the remainder of 2026 due to oil-driven inflation, the $74k resistance will likely hold, and we could see a swift 10% correction toward $65,000.
3. BTC Analysis: Sector Stress: The BlockFills Factor
While Bitcoin rallies, the underlying infrastructure is showing cracks. The Chapter 11 filing of BlockFills today reminds us that the "January-February" downturn has left scars. While exchange balances are at 2017 lows (historically bullish), the bankruptcy of a major lender suggests that the "liquidity shock" could cut both ways if a forced liquidation of their 71 BTC (and related holdings) occurs during a period of low order-book depth.
BTC Price Analysis Global Session Watch: The Positive Authority Framework
To navigate this volatility, you must move away from reactive trading and toward proactive positioning. Here is how we are viewing the sessions today:
BTC Analysis Asian Session: The Disbelief Bid
Forget the temptation to short the early morning momentum just because it "feels too high." Since you understand that the Asian session often sets the "value area" for the day, you’ll see how waiting for a session-midpoint retest removes the stress of chasing candles. This setup naturally aligns with your patience to wait for the highest probability moves. The Prescription: Utilize the Sentiment Fade concept from Page 15 of the Forex News Mastery eBook. If the Nikkei continues to rally, look for BTC to hold the $72,500 level.
Will you wait for the 5-minute consolidation at the open, or set your limit orders now?
BTC Analysis London Session: The Liquidity Hunt
Don't be fooled by "fake-out" breakouts at the London open. This session is famous for hunting stops above $74,000 before reversing. Since you have the discipline to watch the hourly close rather than the 1-minute noise, you are already ahead of 90% of the retail crowd. The Prescription: This is a classic Dual-Sided Breakout environment as described on Page 25 of the eBook. Look for a "Stop Run" above the February highs followed by a swift move back into the range.
Do you prefer the aggressive entry on the wick, or the conservative entry on the candle close?
BTC Analysis New York Session: The FOMC Pre-Positioning
Stop trying to "predict" the Fed's next move. Instead, focus on the "Priced-In Trap" mentioned on Page 13 of our Forex News Mastery eBook. Since you value risk management over "gambling" on news, you’ll find that waiting for the NY afternoon "theta decay" provides the clearest entries. The Prescription: Watch the correlation with Oil. If Brent stays above $100, expect BTC to remain resilient but capped at $74k.
Will you de-risk before the 2:00 PM ET bell tomorrow, or hold through the volatility?
5 BTC Trading Strategies for the Current $73k Bitcoin Price Analysis
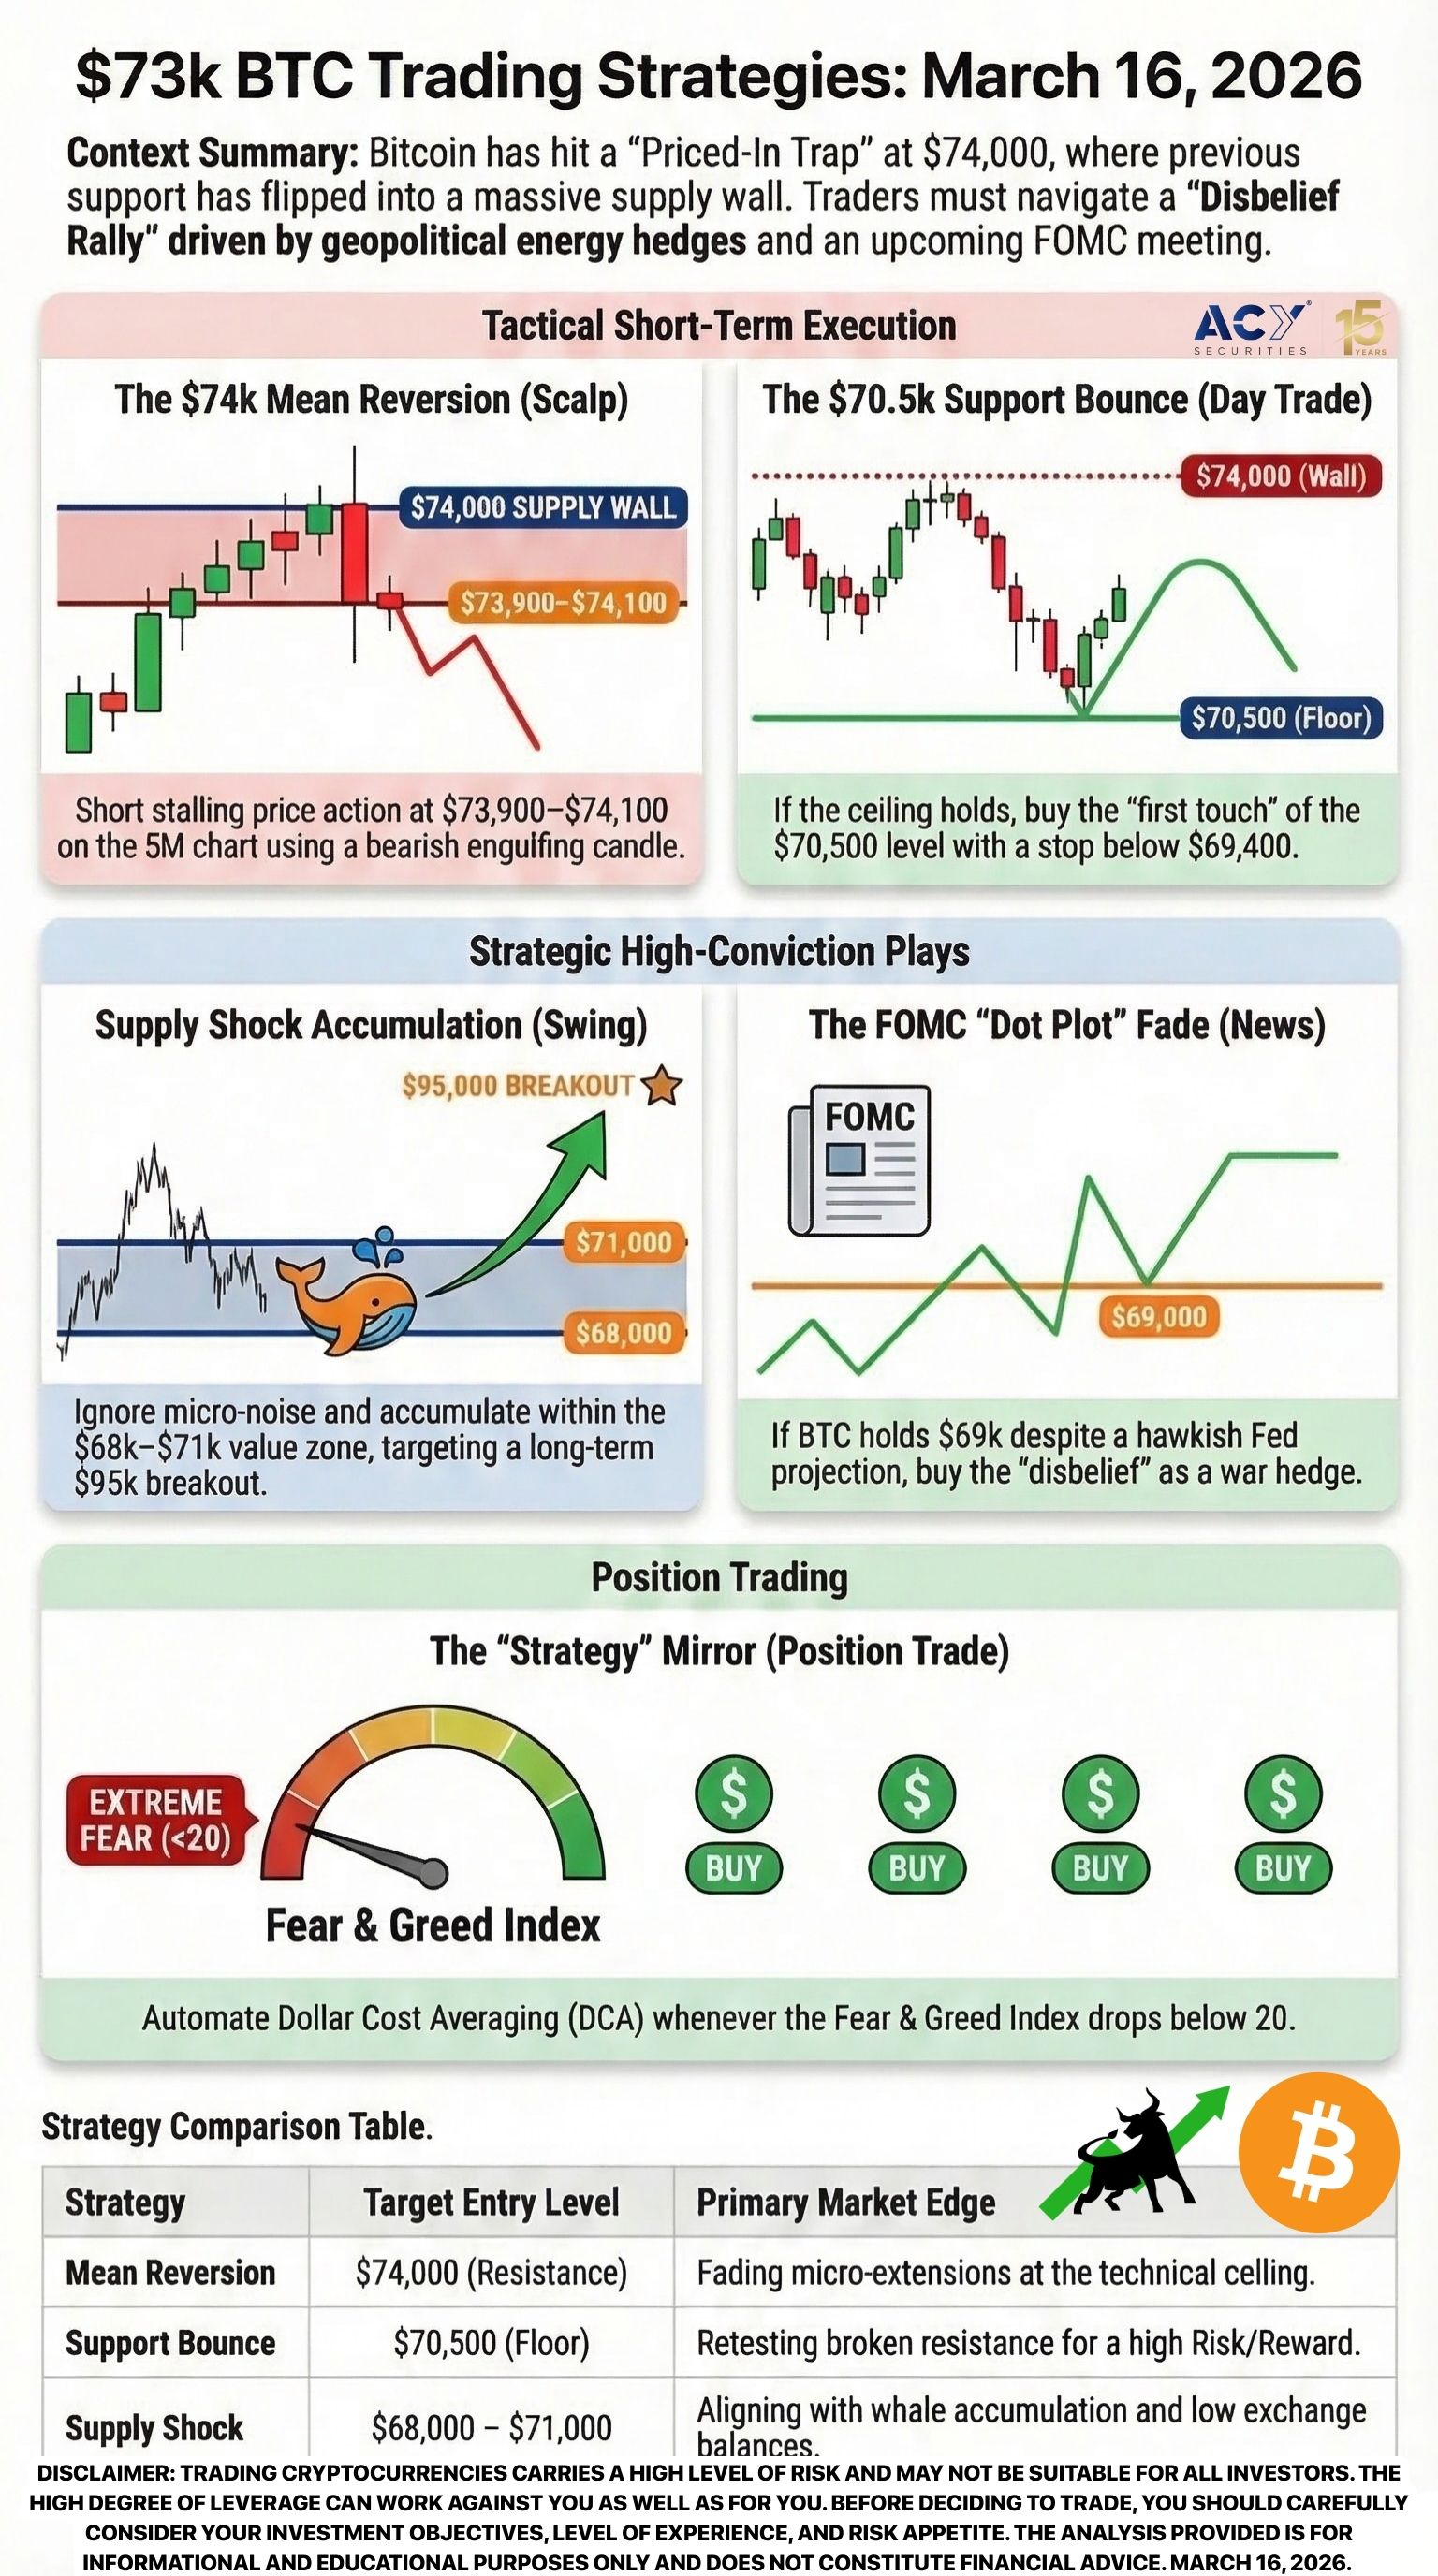
1. The BTC Scalping Edge: The $74k Mean Reversion
- The Setup: Look for "stalling" price action on the 5M chart between $73,900 and $74,100. Enter short on a bearish engulfing candle with a tight 150-tick stop.
- Pros: High frequency, clear exit. Cons: Risk of a "God Candle" breakout.
- The ACY Edge: Forget trying to catch the absolute top. Since you’re a precision trader, you’ll recognize that the Dual-Sided Breakout logic on Page 25 of the eBook actually applies to fading these micro-extensions. Will you take partial profits at the VWAP, or hold for the session low?
2. Day Trading BTC: The 70.5k Support Bounce
- The Setup: If the $74k wall holds, wait for a retracement to the $70,500 daily support. Buy the "first touch" with a stop below $69,400 (the 2021 ATH).
- Pros: Excellent Risk/Reward. Cons: Requires significant patience.
- The ACY Edge: Stop listening to the "V-shape" hype. Since you focus on market structure, you see this as a simple retest of broken resistance. Use the Post-Announcement strategy on Page 27 of the eBook to time your entry. Are you setting a limit order at $70,550, or waiting for a bullish RSI divergence?
3. Swing Trading BTC: The Supply Shock Accumulation
- The Setup: Ignore the $74k noise and focus on the "Exchange Balance" data. Accumulate in the $68k-$71k range, targeting a long-term breakout to $95k.
- Pros: Low stress, aligns with whale accumulation. Cons: Exposure to high volatility during FOMC.
- The ACY Edge: Forget the daily candles. Since you have the vision to see the long-term supply squeeze, you'll see why this "Great Boring" phase is actually a gift. Refer to the Priced-In Trap on Page 13 of the eBook to avoid buying the top of the range. Will you use a staggered entry or a lump sum at the 200-week EMA?
4. News Trading BTC: The FOMC "Dot Plot" Fade
- The Setup: Wait for the Fed release at 2:00 PM ET tomorrow. If the Dot Plot is hawkish but BTC holds $69k, buy the "disbelief" as the market realizes the war hedge is stronger than the rate threat.
- Pros: Massive volatility equals massive opportunity. Cons: High risk of slippage.
- The ACY Edge: Stop reacting to the headline. Since you are a disciplined news trader, you know the Post-Announcement framework on Page 27 is your bible for tomorrow. Will you trade the initial spike or wait 15 minutes for the "true move"?
5. Position Trading BTC: The "Strategy" Mirror
- The Setup: Public companies are targeting 1M BTC. Copy their "DCA" (Dollar Cost Averaging) approach every time the Fear & Greed index is below 20.
- Pros: Removes emotional bias. Cons: High opportunity cost if the market stays sideways until 2027.
- The ACY Edge: Forget the "perfect" entry. Since you understand the institutional mandate, you’ll find that mirroring the Sentiment Fade on Page 15 of our eBook is the most sustainable path to wealth. Will you set your auto-buy for weekly or monthly intervals?
Conclusion & The ACY Edge
Bitcoin is currently a "Disbelief Rally" testing a "Supply Graveyard." The $74,000 zone will not break easily. It requires a fundamental catalyst likely a dovish shift in the Fed's dot plot or a further escalation in the "Energy War" that solidifies BTC as a mandatory hedge.
At ACY Securities, we don't just give you the levels; we give you the framework to trade them. The Dual-Sided Breakout strategy is your most powerful tool this week. If we reclaim $74,000 on a weekly close, the path to $95,000 is open. If we fail, $65,000 is the next stop.
Ready to master the macro?
- Download the Forex News Mastery eBook and turn to Page 25 to master the breakout setup we discussed today.
- Open a Demo Account with ACY Securities to test these $74k resistance strategies with institutional-grade execution.
Disclaimer: Trading cryptocurrencies carries a high level of risk and may not be suitable for all investors. The high degree of leverage can work against you as well as for you. Before deciding to trade, you should carefully consider your investment objectives, level of experience, and risk appetite. The analysis provided is for informational and educational purposes only and does not constitute financial advice. March 16, 2026.
延伸阅读

