Understanding Market Trends and Price Action
2025-04-17 10:13:02


Start Trading with Confidence, Not Confusion
Have you ever stared at a trading chart and thought, "I have no idea what any of this means"?
You’re not alone. Everyone starts there.
The world of trading can feel like it speaks a different language line going up and down, candles, weird patterns, strange words like “engulfing” or “support zones.” It’s a lot. But here’s the good news:
You don’t need to be an expert.
You just need to understand what the market is telling you.
And that starts with two simple ideas: market trends and price action.
Let’s slow things down and walk through this together step by step, in plain language so you can start seeing what the market is doing, before it even shows up on the chart.
Why Trends Matter (and What They Actually Are)
A trend is the market’s overall direction.
It’s like the mood of the crowd are people feeling hopeful, scared, greedy, or cautious?
Think of it like this:
- When prices keep going up, it usually means confidence. People are buying. That’s called an uptrend.
- When prices keep falling, there’s fear. People are selling. That’s a downtrend.
- Sometimes the market is just stuck, unsure of what’s next. That’s a sideways trend like indecision we often call it a consolidation.
These trends aren’t just pretty lines. They’re the story of what’s happening in the world reflected in price
How to Identify Market Trends (Even Before They Show on the Chart)
Most new traders are told to stare at charts to find trends. That works, eventually. But if you want to understand what really moves the markets, you must start before the chart even reacts. You need to understand what shapes those trends in the first place.
The truth is trends don’t begin on the screen. They begin in the real world. With economies. With politics. With emotion. Then they show up on the chart.
Let’s take it step by step.
Step 1: Start With the Fundamentals
Every currency is tied to a country. And that country has an economy, a central bank, political policies, trade partners, natural resources, and national challenges. All these things influence how strong or weak a currency becomes.
Understanding fundamentals means reading the room before you enter the market. It means knowing the story behind the moves.
Here’s how you do that.
Learn the Personalities of Major Currencies
Currencies react differently depending on what’s going on in the world. Some are considered safe places during uncertainty. Others thrive when the global economy is strong. This is often referred to as "risk-on" and "risk-off" behaviour.
Risk-On Currencies
AUD (Australian Dollar): This currency often gains strength when global growth is picking up. Australia exports a lot of commodities, especially to China. So, when commodity prices rise or China’s economy looks healthy, AUD tends to benefit.
NZD (New Zealand Dollar): Like the AUD, but on a smaller scale. Also tied to commodities and exports. It often moves with global risk appetite.
CAD (Canadian Dollar): Closely connected to oil prices. When oil is strong, the Canadian economy tends to improve, which can lift the CAD.
Risk-Off Currencies
USD (US Dollar): Considered the world’s primary safe-haven currency. When global fear rises—due to war, crisis, or economic slowdown—the dollar often gains strength. Investors trust the size and stability of the US economy.
JPY (Japanese Yen): Japan’s economy may not be fast-growing, but the yen often strengthens in times of global fear. It has a long history of acting as a financial refuge during uncertainty.
CHF (Swiss Franc): Switzerland’s political neutrality and stable banking system make the franc another classic safe-haven currency.
These currencies help shape the entire Forex market. Understanding their behaviour helps you get in tune with global sentiment, long before you see a pattern on a chart.
Step 2: Use the Chart to Confirm What the World Is Saying
Once you’ve gathered the bigger picture from economic news, global sentiment, and currency behaviour, now you turn to the chart. This is where technical analysis helps you time your trades and manage risk.
What you’re looking for is confirmation. You want to see the chart showing the same story you’re reading from the fundamentals.
If the news suggests a currency should be gaining strength, look to see if it is forming:
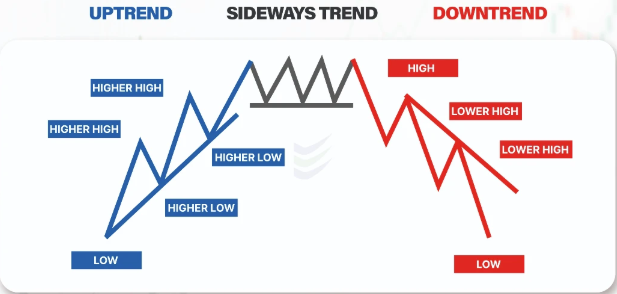
Higher highs and higher lows: This is a visual sign of an uptrend. Buyers are in control, and each dip gets bought quickly.
Lower highs and lower lows: This signals a downtrend. Sellers are dominant, and the price can’t seem to recover for long.
If the chart is moving sideways, the market may be uncertain or waiting for the next major piece of information.
You can also use tools like moving averages. If price is above a rising 50-day or 200-day moving average, that often supports a bullish outlook. If it’s below a falling average, that leans bearish.
Real-World Example: AUD/USD
Imagine you hear that China just posted strong manufacturing data. That’s good news for Australia, because China is a major buyer of Australian exports.
At the same time, you notice that iron ore prices (a major Australian export) are rising, and the Reserve Bank of Australia has hinted it might raise interest rates next quarter.
From a fundamental perspective, this is a strong case for the Australian Dollar to gain strength.
Now, you check the AUD/USD chart. You see it forming a series of higher lows and breaking above a key resistance level. That’s your confirmation.
By the time other traders see the chart breaking out, you already understand why it’s happening—and you’re ready for it.
Putting It All Together
Identifying a trend before it appears clearly on the chart is not magic. It’s awareness.
You look at the world. You understand how different currencies respond to different kinds of news. You start noticing patterns in behaviour. Then you check the chart to see if the market agrees.
That’s when you’re no longer just reacting. You’re reading the market like a story and you’re following the plot, not just the pictures.
The market isn’t just numbers. It’s people. Emotion. Behaviour.
Every chart reflects how people feel about the world.
When you learn to understand trends and price action, you’re not just trading. You’re reading emotion, momentum, and energy and deciding how you want to respond.
That’s powerful. That’s timeless. And that’s something no robot or signal can replace.
So go ahead open that chart. Start seeing the story behind the candles.
You’ve got this.
延伸阅读

