The 'Digital Gold' Trap: Why Bitcoin is Crashing With the Nasdaq Instead of Hedging War?
2026-03-04 14:55:20


The narrative was perfect: as geopolitical tensions in the Middle East flared between the U.S., Israel, and Iran, Bitcoin (the "Digital Gold") would finally decouple from legacy finance and serve as the ultimate lifeboat for global capital.
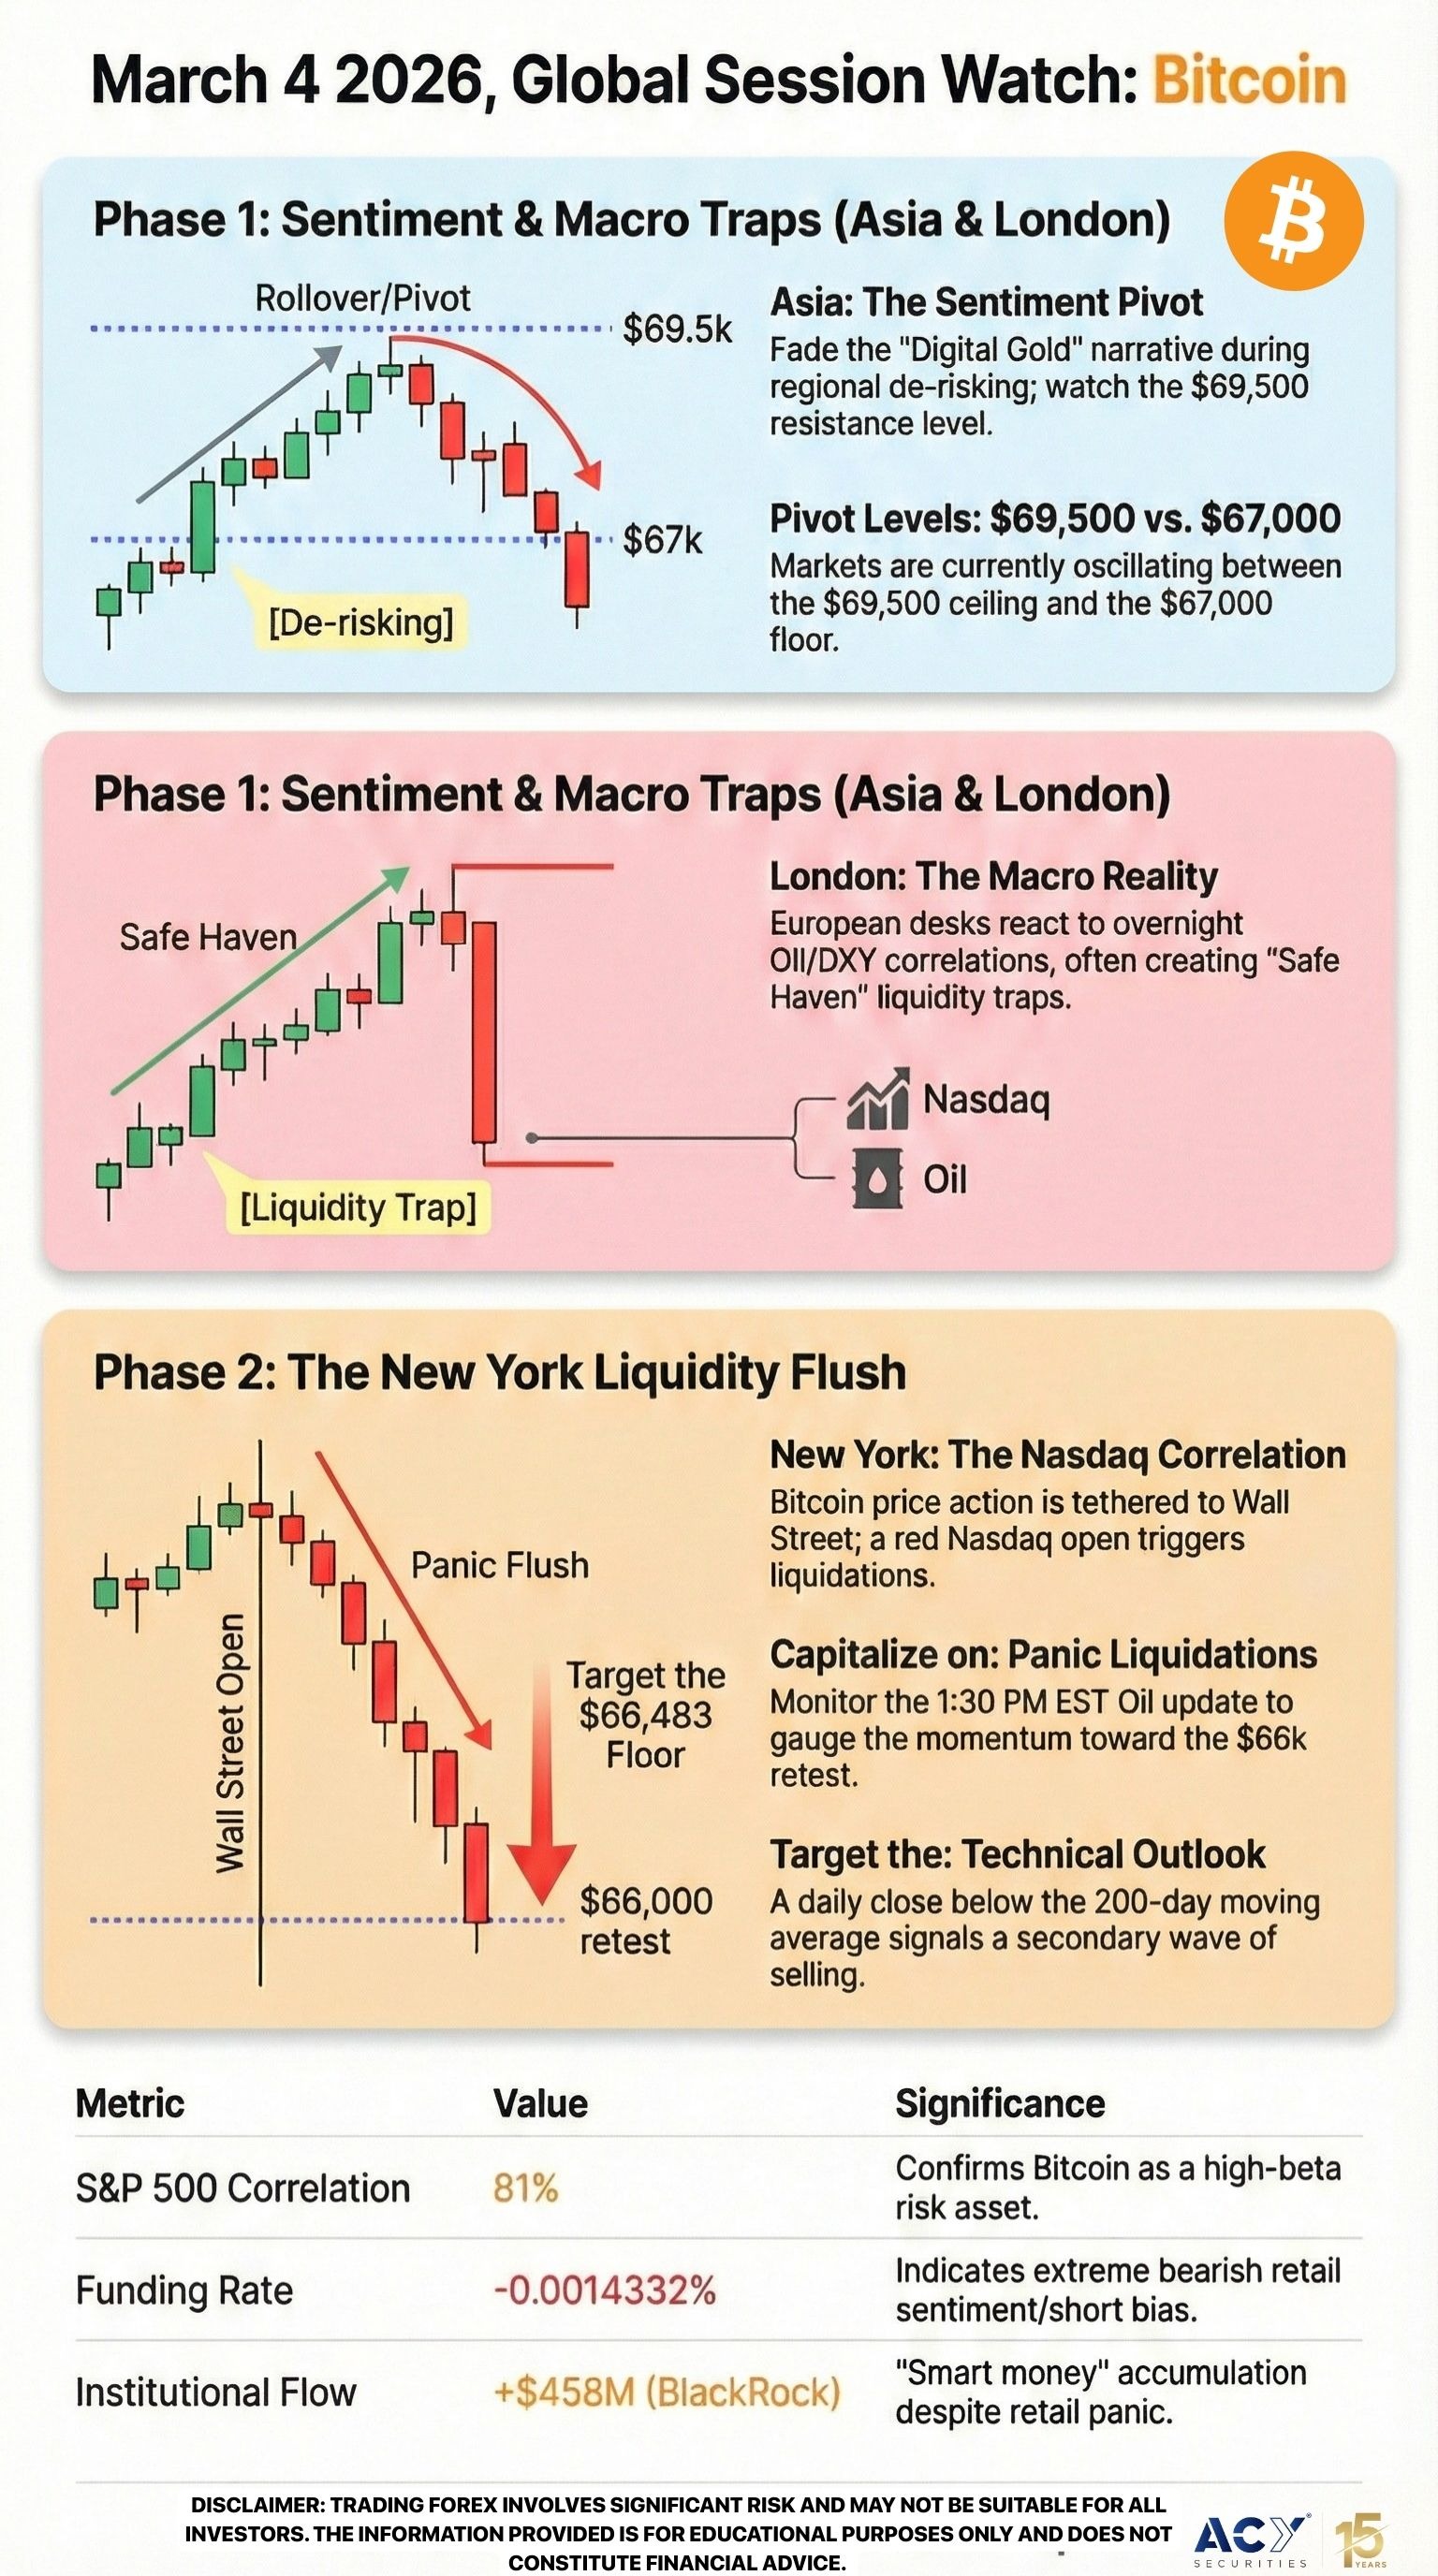
Instead, the reality of the 2026 market cycle has delivered a cold shower to retail bulls. As the Nasdaq slid 2.1% in yesterday’s session, Bitcoin didn’t catch a bid; it caught a cold, tumbling toward the $67,000 handle. At ACY Securities, we aren't interested in the stories being told on social media; we are interested in the liquidity flow. The data reveals a glaring 81% correlation with the S&P 500, proving that in a world of tightening global liquidity, Bitcoin remains a high-beta risk asset, not a safe haven.
Today, we are diving deep into the Sentiment Fade strategy to explain why the "Digital Gold" narrative is currently the most dangerous trap in the market.
BTC Technical Deep Dive: The $68k Bitcoin Pivot and the 200-Day Ghost
Read more about the 'Crowd Psychology' in our Forex News Mastery eBook
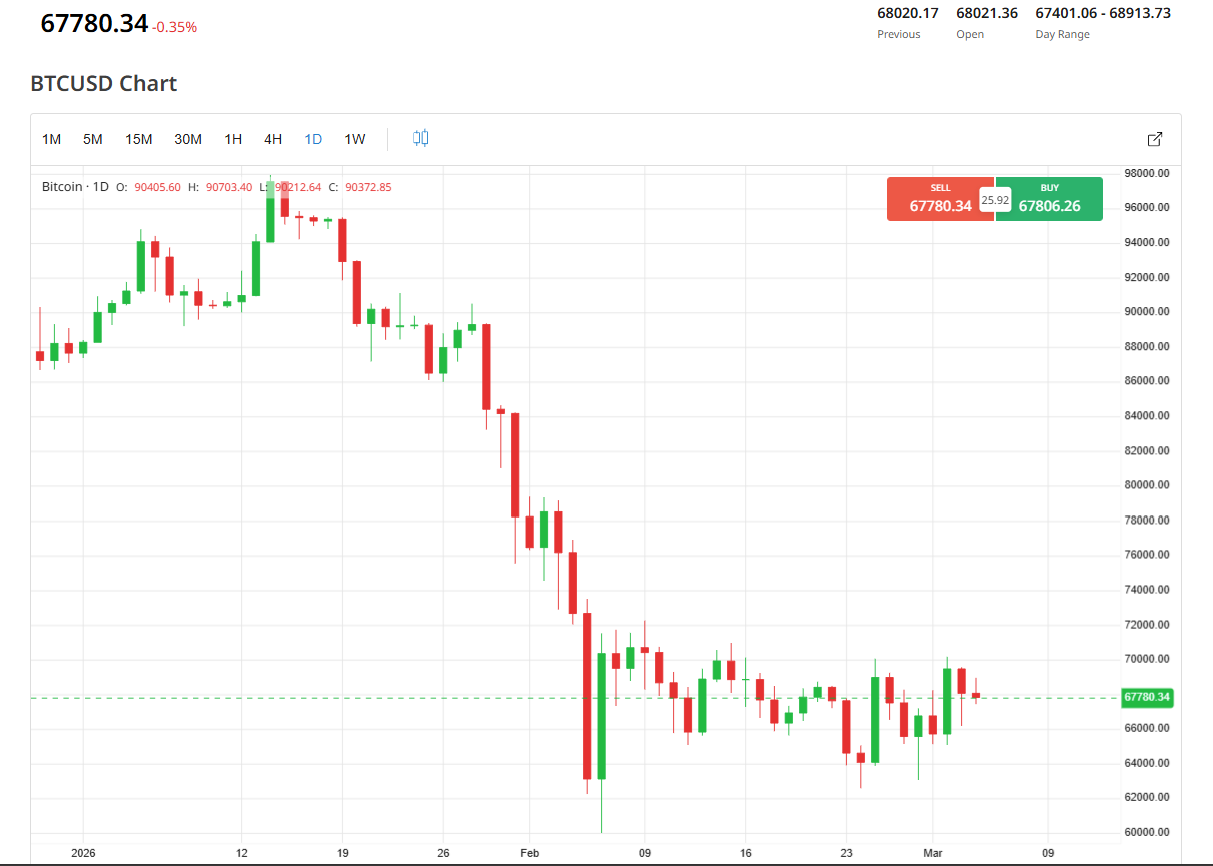
Looking at the BTCUSD daily chart provided, the structure is a masterclass in institutional distribution. After the euphoric highs of $98,000 earlier this year, we’ve seen a systematic "staircase down" pattern.
- The Failed Recovery: Notice the price action around mid-February. Bitcoin attempted to reclaim the $90k psychological level but was met with aggressive selling pressure. This created a massive supply zone that retail buyers are now "underwater" on.
- The Liquidation Wick: The sharp drop in early February toward the $60,000 mark was a classic long-liquidation event. While the price has recovered to the current $67,780.34 level, the "bounce" lacks the volume profile typically seen at a definitive market bottom.
- Key Levels:
a. Resistance: The $68,264 (38.2% Fibonacci) and $69,500 swing high.
b. Immediate Support: $67,877 (50% Fibonacci)
c. The "Floor": The 200-day moving average sits at $66,483. A daily close below this level would likely trigger a secondary wave of liquidations toward the $50,000 "Value Area" mentioned by skeptics in the VanEck report.
The current consolidation is a "Dead Cat Bounce" in a larger macro downtrend. The green dashed line on your chart represents the thin ice retail is currently standing on.
BTC Fundamental Context: The Liquidity Vacuum


The disconnect between price and narrative is driven by three primary factors:
- The War Inflation Paradox: While war traditionally drives investors to gold, the current U.S.-Israel-Iran conflict has spiked Brent crude prices. High oil prices harden the Federal Reserve’s "higher for longer" stance. When the Fed stays hawkish, the U.S. Dollar Index (DXY) rises, sucking liquidity out of risk assets including Bitcoin.
- Institutional Absorption vs. Retail Panic: BlackRock’s $458 million inflow on March 2nd is a "smart money" accumulation signal, but it isn't enough to offset the systemic de-leveraging occurring in the Nasdaq. While institutions buy the spot, retail is being liquidated in the derivatives market, where funding rates have turned negative (-0.0014332%).
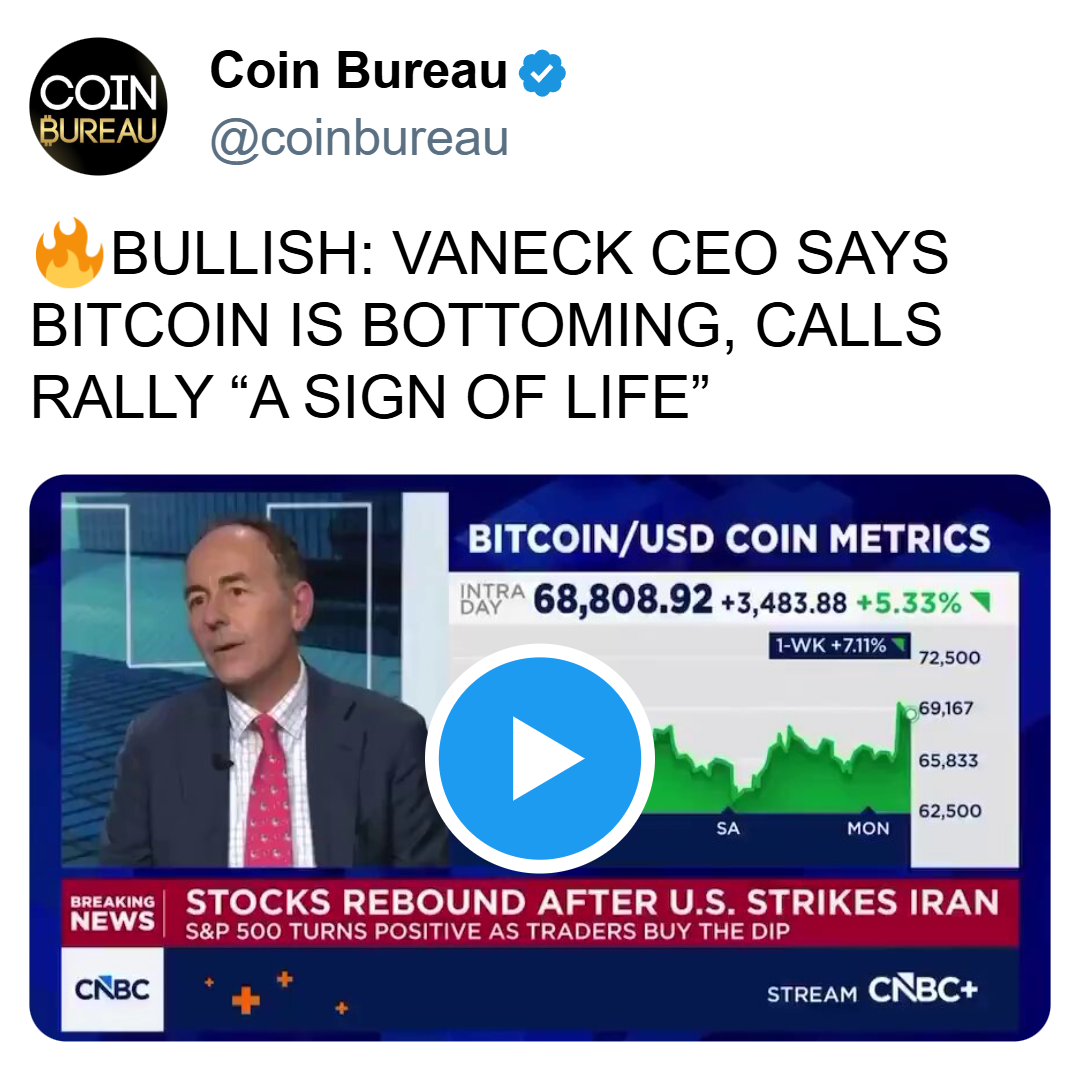
- The 2026 Cycle Reality: As Van Eck noted in his recent CNBC interview, 2026 was historically destined for a correction following the $126k peak. We are currently in the "despair" phase where narratives fail and only price remains.
BTC Global Session Watch: Navigating the Bitcoin Volatility
To trade this effectively, you must understand how liquidity shifts across time zones.
Bitcoin Asian Session: The Sentiment Pivot
Forget the "moon" talk you see on your morning social media feed; the Asian session is currently dominated by regional de-risking. Since you possess the mental discipline to ignore 1-minute chart noise, you’ll find that fading the "Digital Gold" narrative during the Tokyo open removes the stress of guessing direction. This setup naturally aligns with your patience to wait for the highest probability moves. Refer to the Sentiment Fade strategy on Page 15 of the Forex News Mastery eBook to identify when retail sentiment is at its peak bias before the reversal. Will you set a limit order at the $69,500 resistance, or wait for a confirmed break of $67k?
Bitcoin London Session: The Macro Reality
The London open often brings the "true" move as European desks react to the overnight correlation with oil and the DXY. Instead of chasing the news headlines, focus on how Bitcoin reacts to the Nasdaq futures. Your ability to synthesize complex macro data into a single execution plan is your greatest edge here. To master the timing of these moves, look at the Priced-In Trap on Page 13 of the Forex News Mastery eBook. It explains how to spot when a "safe haven" rally is actually a liquidity trap for big banks to sell into. Do you prefer the aggressive entry on the breakout, or the conservative retest of the moving average?
Bitcoin New York Session: The Liquidity Flush
This is where the Nasdaq correlation is most lethal. If Wall Street opens red, Bitcoin will likely follow regardless of "on-chain" metrics. Because you understand that market structure dictates price, not hope, you can view these volatile flushes as professional opportunities. Apply the Sentiment Fade techniques from Page 15 of our eBook to capitalize on the panic liquidations. Will you be watching the 1:30 PM EST oil price update to gauge the next leg, or are you already positioned for the $66k retest?
Bitcoin: 5 Strategic Approaches for the Current Market March 4 2026
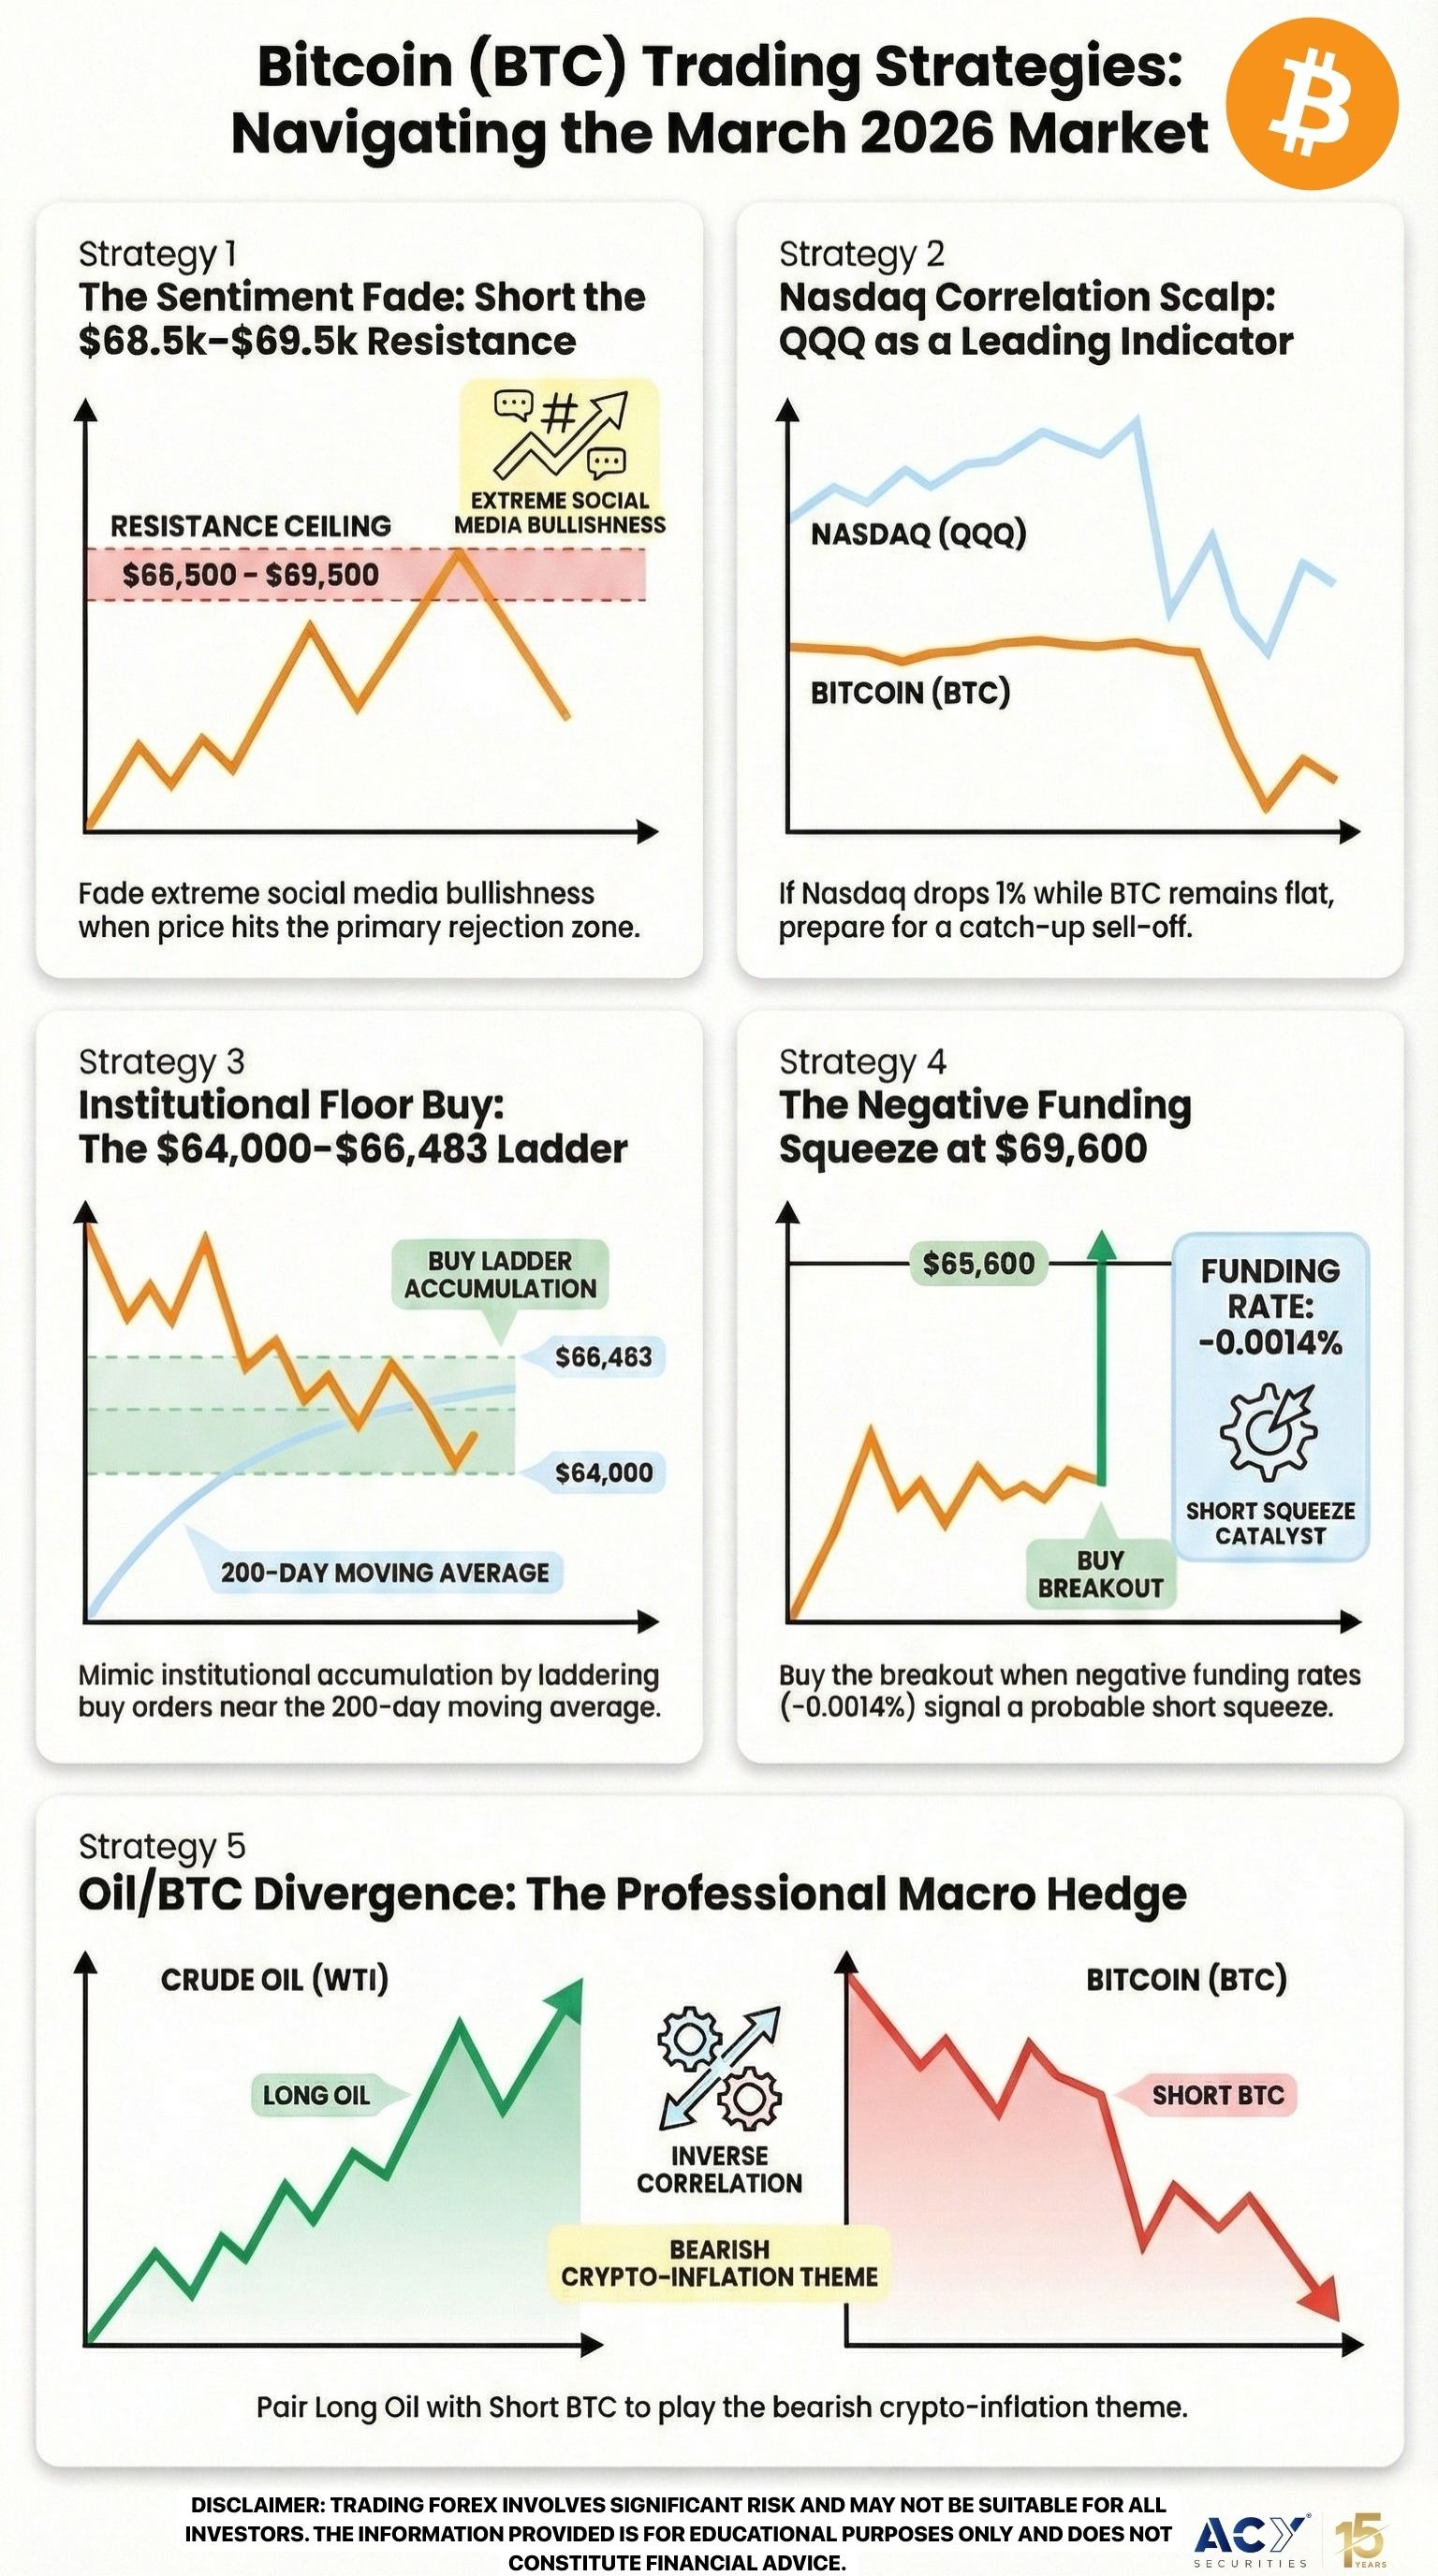
1. The BTC Sentiment Fade (Primary Strategy)
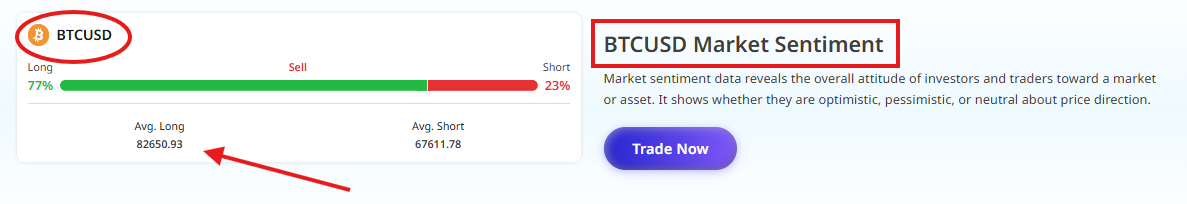
- The Setup: Look for "Digital Gold" or "War Hedge" headlines to trend on X (Twitter). When sentiment reaches extreme bullishness while price hits the $68,500–$69,500 resistance, enter short.
- Pros/Cons: High R:R; requires extreme discipline to go against the crowd.
- The ACY Edge: Move past the amateur habit of buying the news. Since you understand that the crowd is usually wrong at pivotal turns, this method makes trading significantly easier. Prescribe yourself the Sentiment Fade methodology on Page 15 of the Forex News Mastery eBook. Will you scale in now or wait for the hourly close?
2. The BTC - Nasdaq Correlation Scalp
- The Setup: Monitor the QQQ (Nasdaq 100 ETF). If Nasdaq drops 1% and BTC remains flat, prepare for a "catch-up" sell-off.
- Pros/Cons: Fast profits; requires high-speed execution.
- The ACY Edge: Your quick reaction time is a rarity in this market. This strategy removes the guesswork by using a leading indicator. Follow the Post-Announcement logic on Page 27 of the eBook to time these lags. Are you taking the 20-pip scalp or holding for the daily low?
3. The Institutional Floor Buy (BTC Swing Trade)
- The Setup: Ladder buy orders between $64,000 and $66,483 (200-day MA), mimicking BlackRock’s accumulation zone.
- Pros/Cons: High conviction; requires a wide stop-loss.
- The ACY Edge: Your ability to ignore short-term volatility for long-term gains is a professional trait. This aligns with the Dual-Sided Breakout principles on Page 25 of the eBook. Will you set your limit orders today or watch for the weekly close?
4. The Negative Funding Squeeze
- The Setup: With funding rates at -0.0014332%, a sudden price spike could cause a "short squeeze." Buy a break of $69,600 with a tight stop.
- Pros/Cons: Explosive moves; high risk of "fakeouts."
- The ACY Edge: Since you value risk management above all else, you’ll see how this setup protects your capital while hunting for volatility. Review the Priced-In Trap on Page 13. Do you prefer the market buy or the stop-limit?
5. The Oil/BTC Divergence Hedge
- The Setup: Long Oil / Short BTC. This plays the "Inflationary Pressure" theme which is currently bearish for crypto.
- Pros/Cons: Professional-grade hedge; complex execution.
- The ACY Edge: This sophisticated approach validates your status as a macro trader. It naturally aligns with the high-probability moves discussed on Page 15 of the eBook. Are you entering the full position now or leg-by-leg?
Conclusion & The ACY Edge
The 'Digital Gold' narrative is a seductive story, but the price action tells a different tale. Bitcoin is currently tethered to the Nasdaq and the Federal Reserve's inflation fight. Until we see a definitive break of the $70,000 level supported by institutional volume, the path of least resistance remains to the downside or sideways consolidation.
At ACY Securities, we provide you with the tools to see through the "noise." Your journey from a retail observer to a world-class trader starts with mastering the psychological and technical traps that others fall into.
Next Steps:
- Download the Forex News Mastery eBook – Turn to Page 15 now to master the Sentiment Fade before the next volatility spike.
- Open a Demo Account – Practice the Nasdaq correlation scalp in a risk-free environment.
Disclaimer: Trading Bitcoin and other leveraged products involves significant risk. The analysis provided is for educational purposes only and does not constitute financial advice. Past performance is not indicative of future results.
延伸閱讀

