MACD Histogram: Using Momentum Strength to Read Trend Health
2026-01-08 08:37:40


Most traders are obsessed with finding the perfect entry. They want precision, timing, and confirmation all at once. But markets don’t reward precision as much as they reward alignment. This is where the MACD histogram quietly becomes one of the most misunderstood yet powerful tools in technical analysis.
When the MACD histogram is read correctly, it stops being about entries and starts becoming about conditions. It tells you whether momentum is strengthening, weakening, or quietly bleeding out beneath the surface. And once you understand this, you stop fighting the market and start flowing with it.
This article breaks down how to use the MACD histogram as a momentum strength indicator, not a trigger. You’ll learn how expansion and contraction reveal trend health, how exhaustion shows up before price reacts, and how this perspective helps you stay in winning trades longer instead of cutting them short out of fear.
MACD Histogram as a Momentum Strength Indicator (Why It Matters)
The MACD histogram measures the difference between the MACD line and the signal line. In simple terms, it measures momentum pressure.
Every histogram bar answers one question:
Is momentum increasing or decreasing right now?
That’s it.
It does not predict price. It does not tell you where to enter. It tells you whether the move you’re watching is being supported or starved.
Once you shift your mindset from entries to conditions, the histogram becomes a filter that keeps you out of weak trades and helps you commit to strong ones.
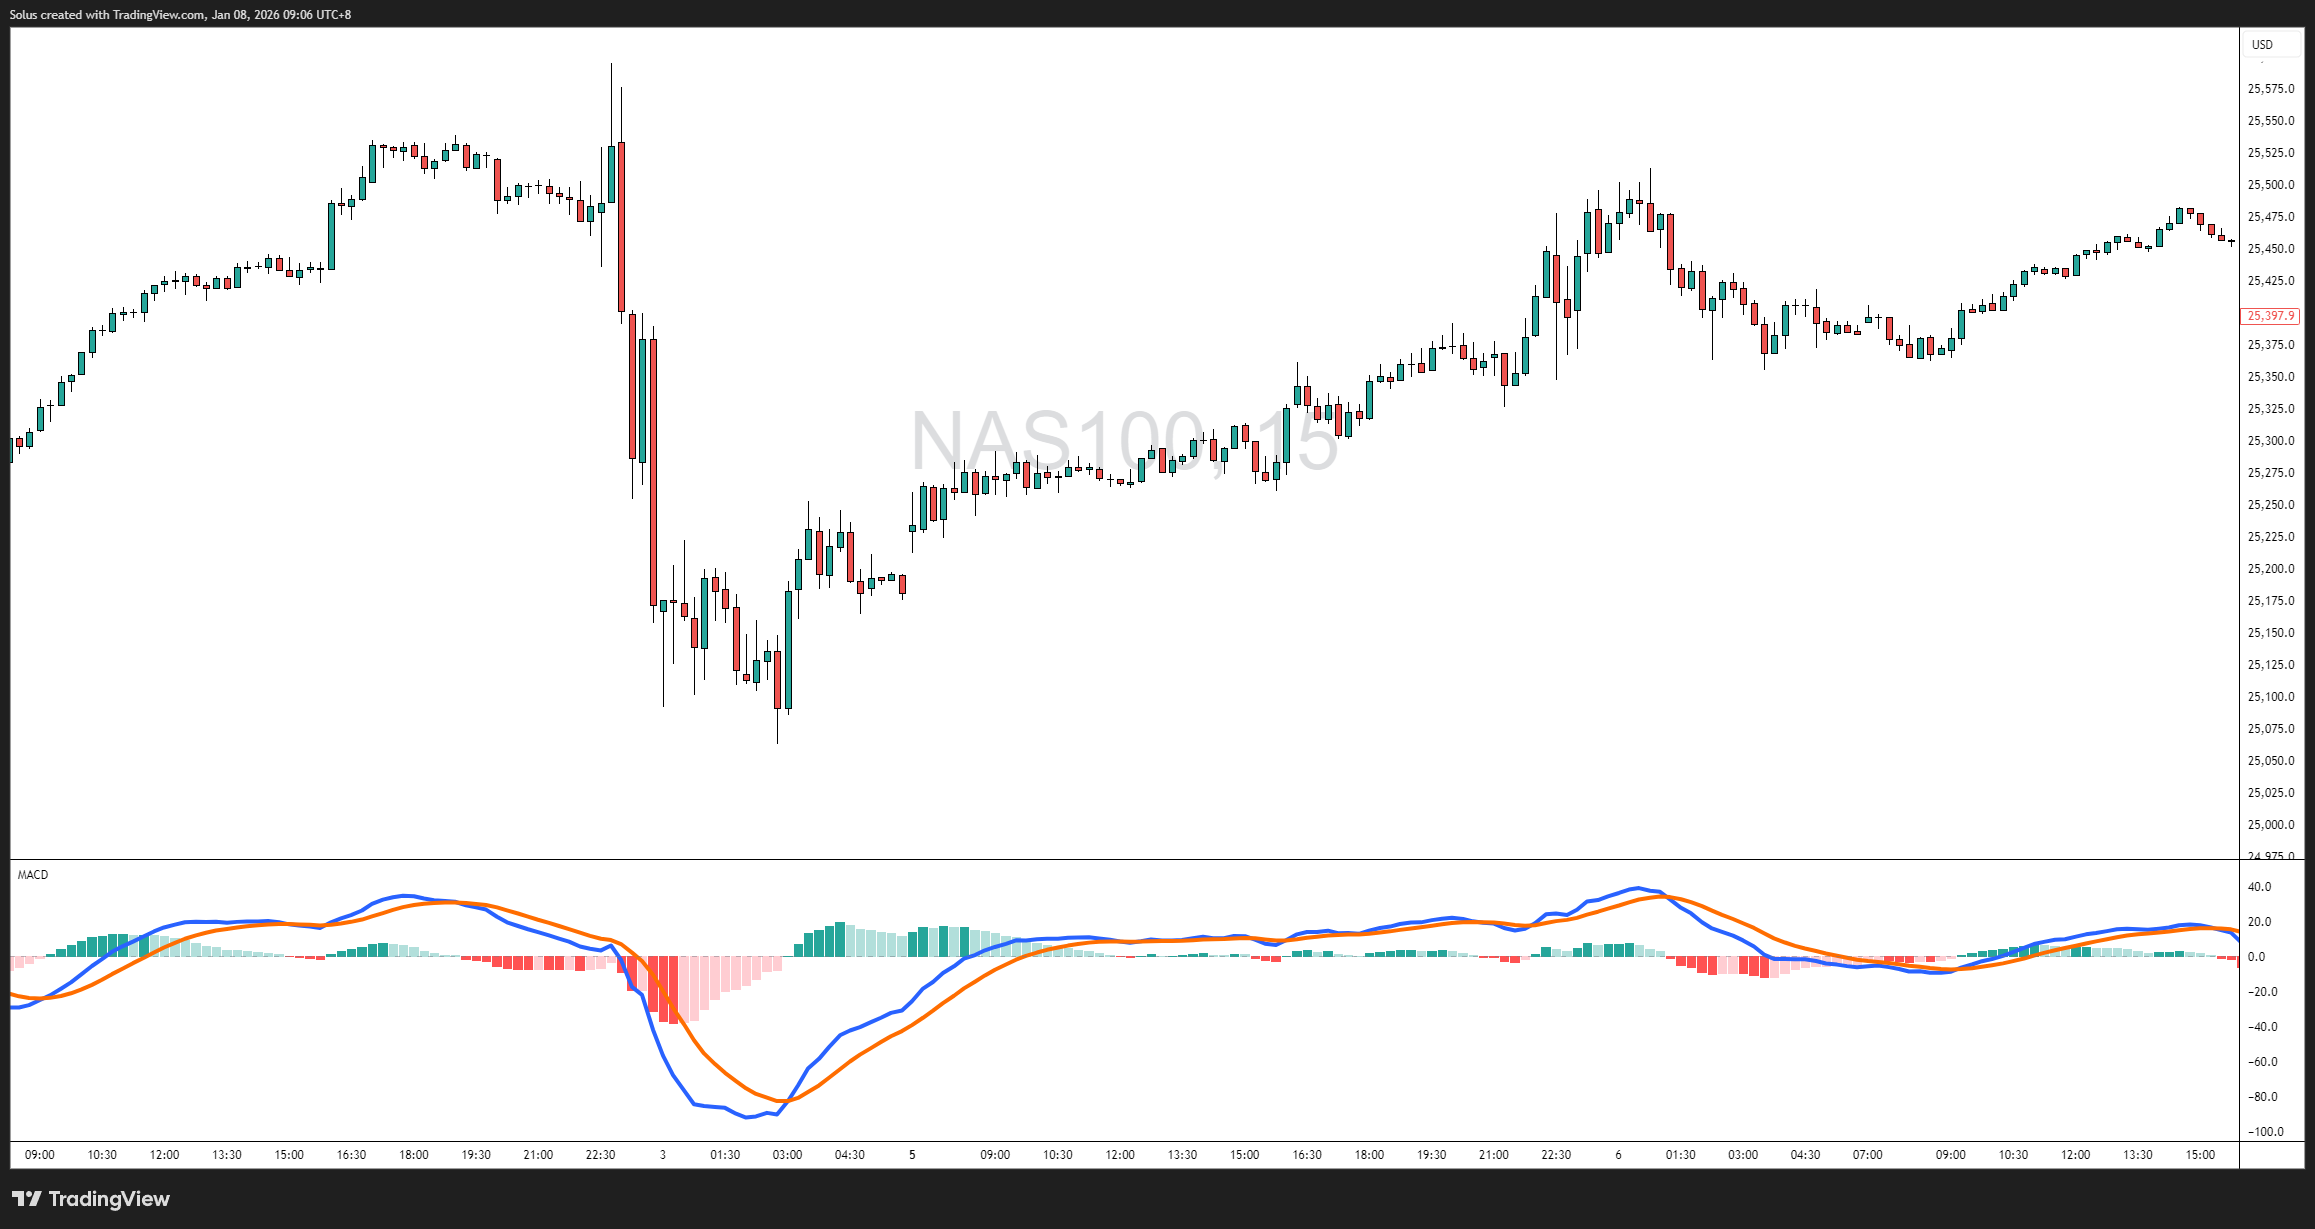
Reading Momentum Expansion vs Contraction
Momentum Expansion
Histogram expansion means momentum is accelerating.
This usually appears:
- During impulse moves
- After clean breakouts
- When trends are healthy and supported
Expansion shows that participation is increasing. More traders are committing in the same direction, and price movement is not being forced.
The speed of expansion matters. Sharp expansion shows urgency. Smooth, steady expansion shows control. Both can be profitable, but they tell very different stories about the market’s intent.
Momentum Contraction
Momentum contraction is where most traders get confused.
Price may still be moving higher or lower, but the histogram starts shrinking. This tells you that participation is fading. The move is still alive, but it’s becoming fragile.
Contraction does not mean reversal. It means vulnerability.
This is where traders should stop adding risk, tighten focus, and start managing instead of chasing.
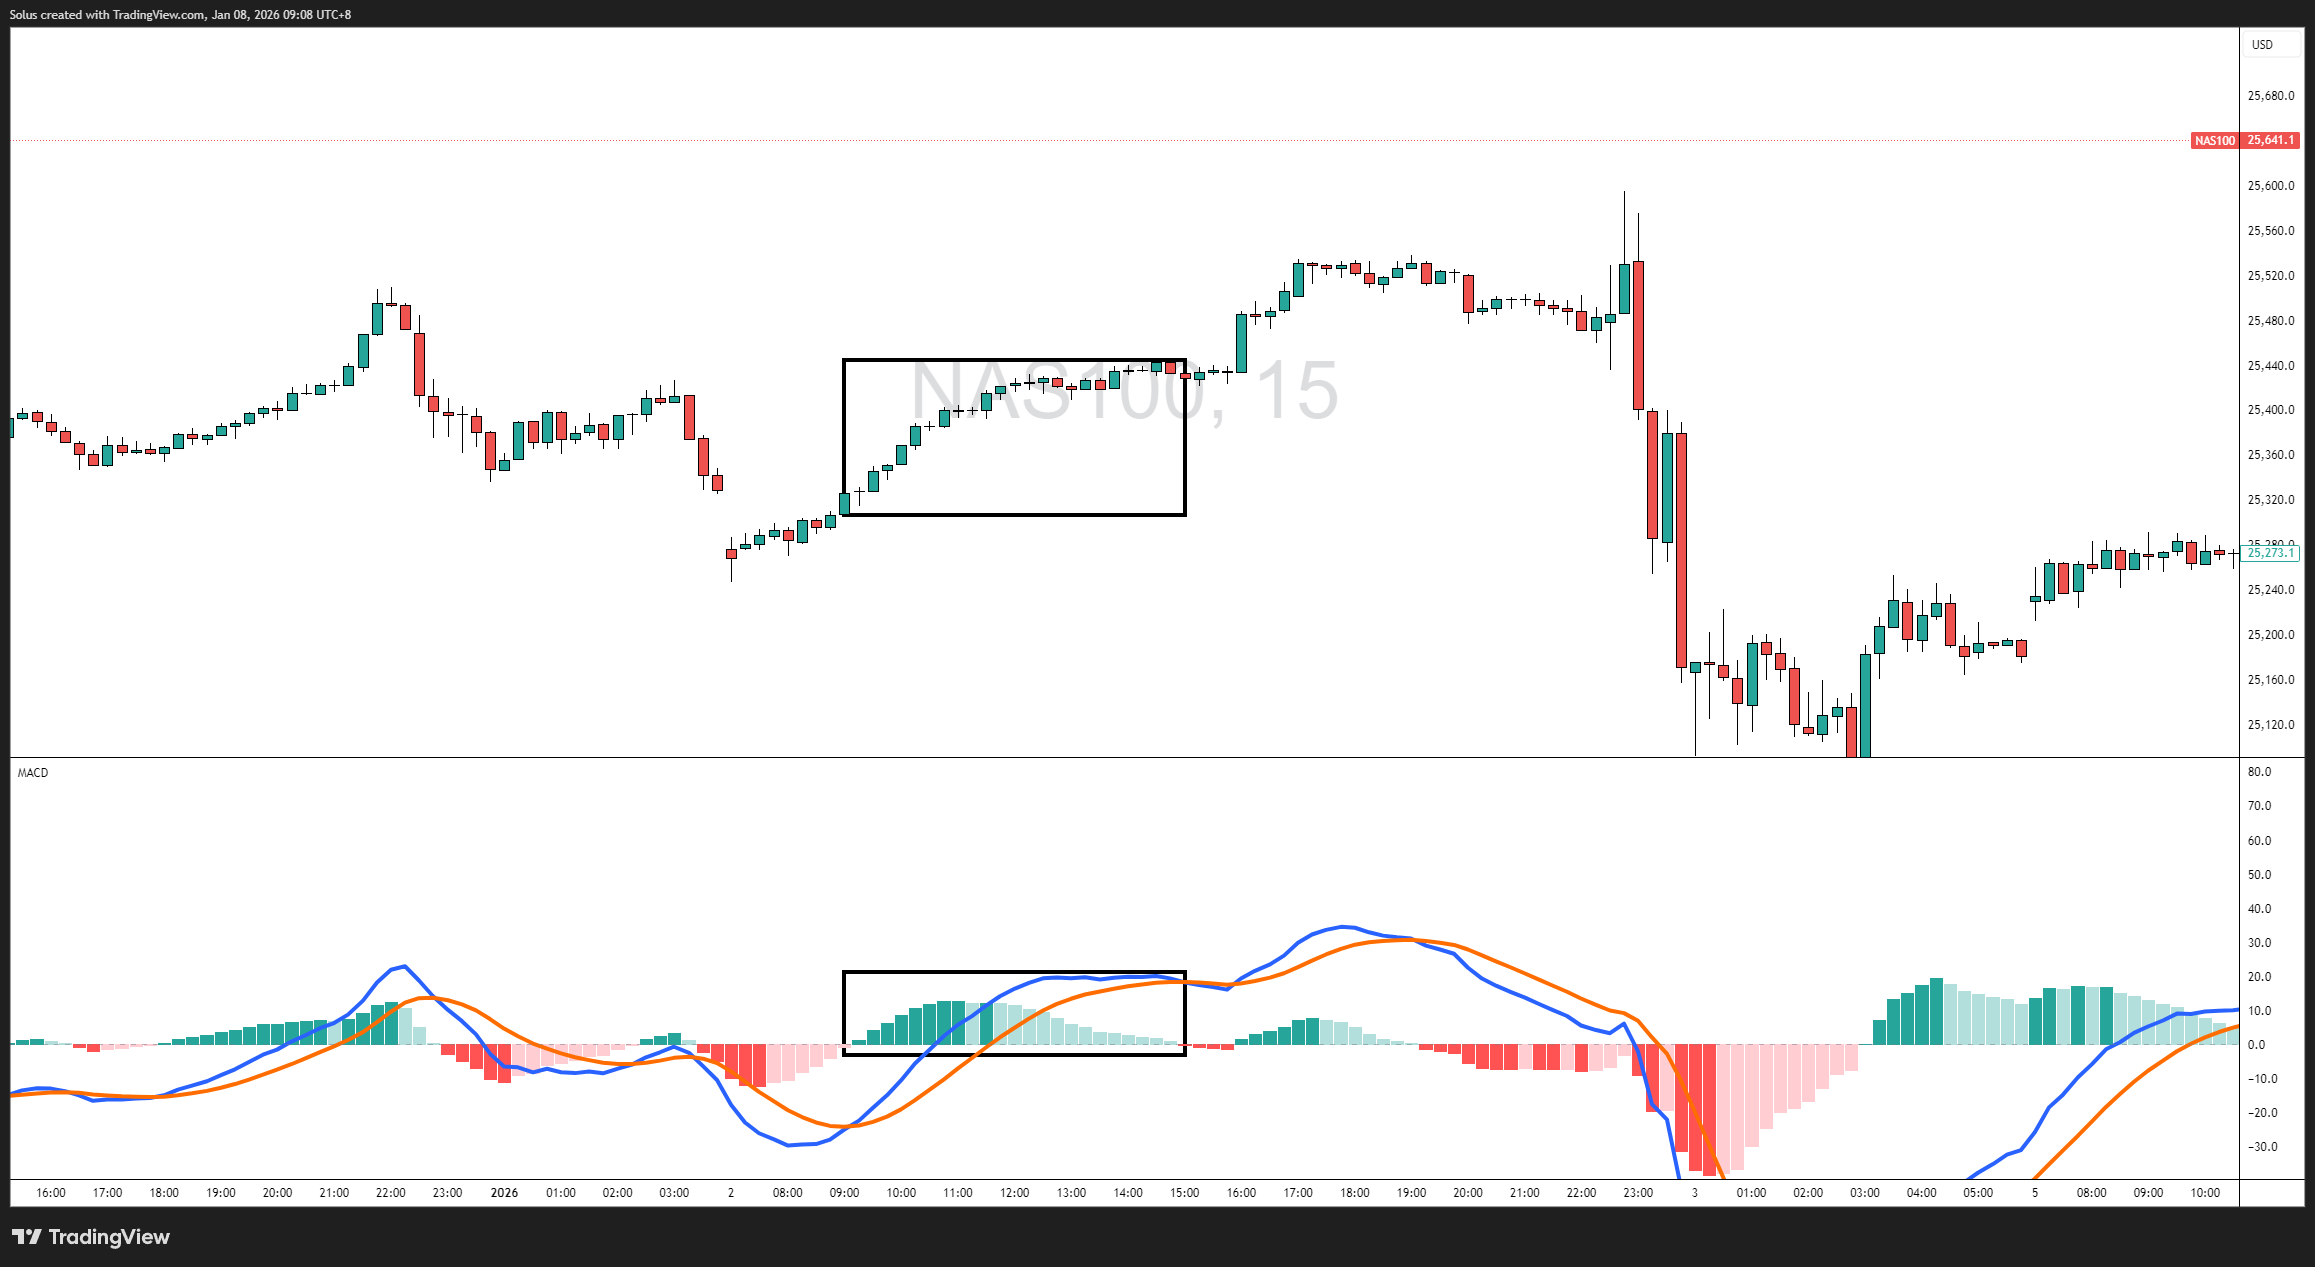
How Histogram Slope Reveals Trend Health
Instead of staring at individual bars, pay attention to the slope of the histogram.
A healthy trend shows:
- Consistent expansion
- Shallow contractions on pullbacks
- Quick momentum rebuilds
This tells you the trend is being defended.
A weakening trend shows:
- Early momentum peaks
- Each new push produces smaller histogram bars
- Momentum struggles to expand again
Price might still be trending, but it’s running on borrowed energy.
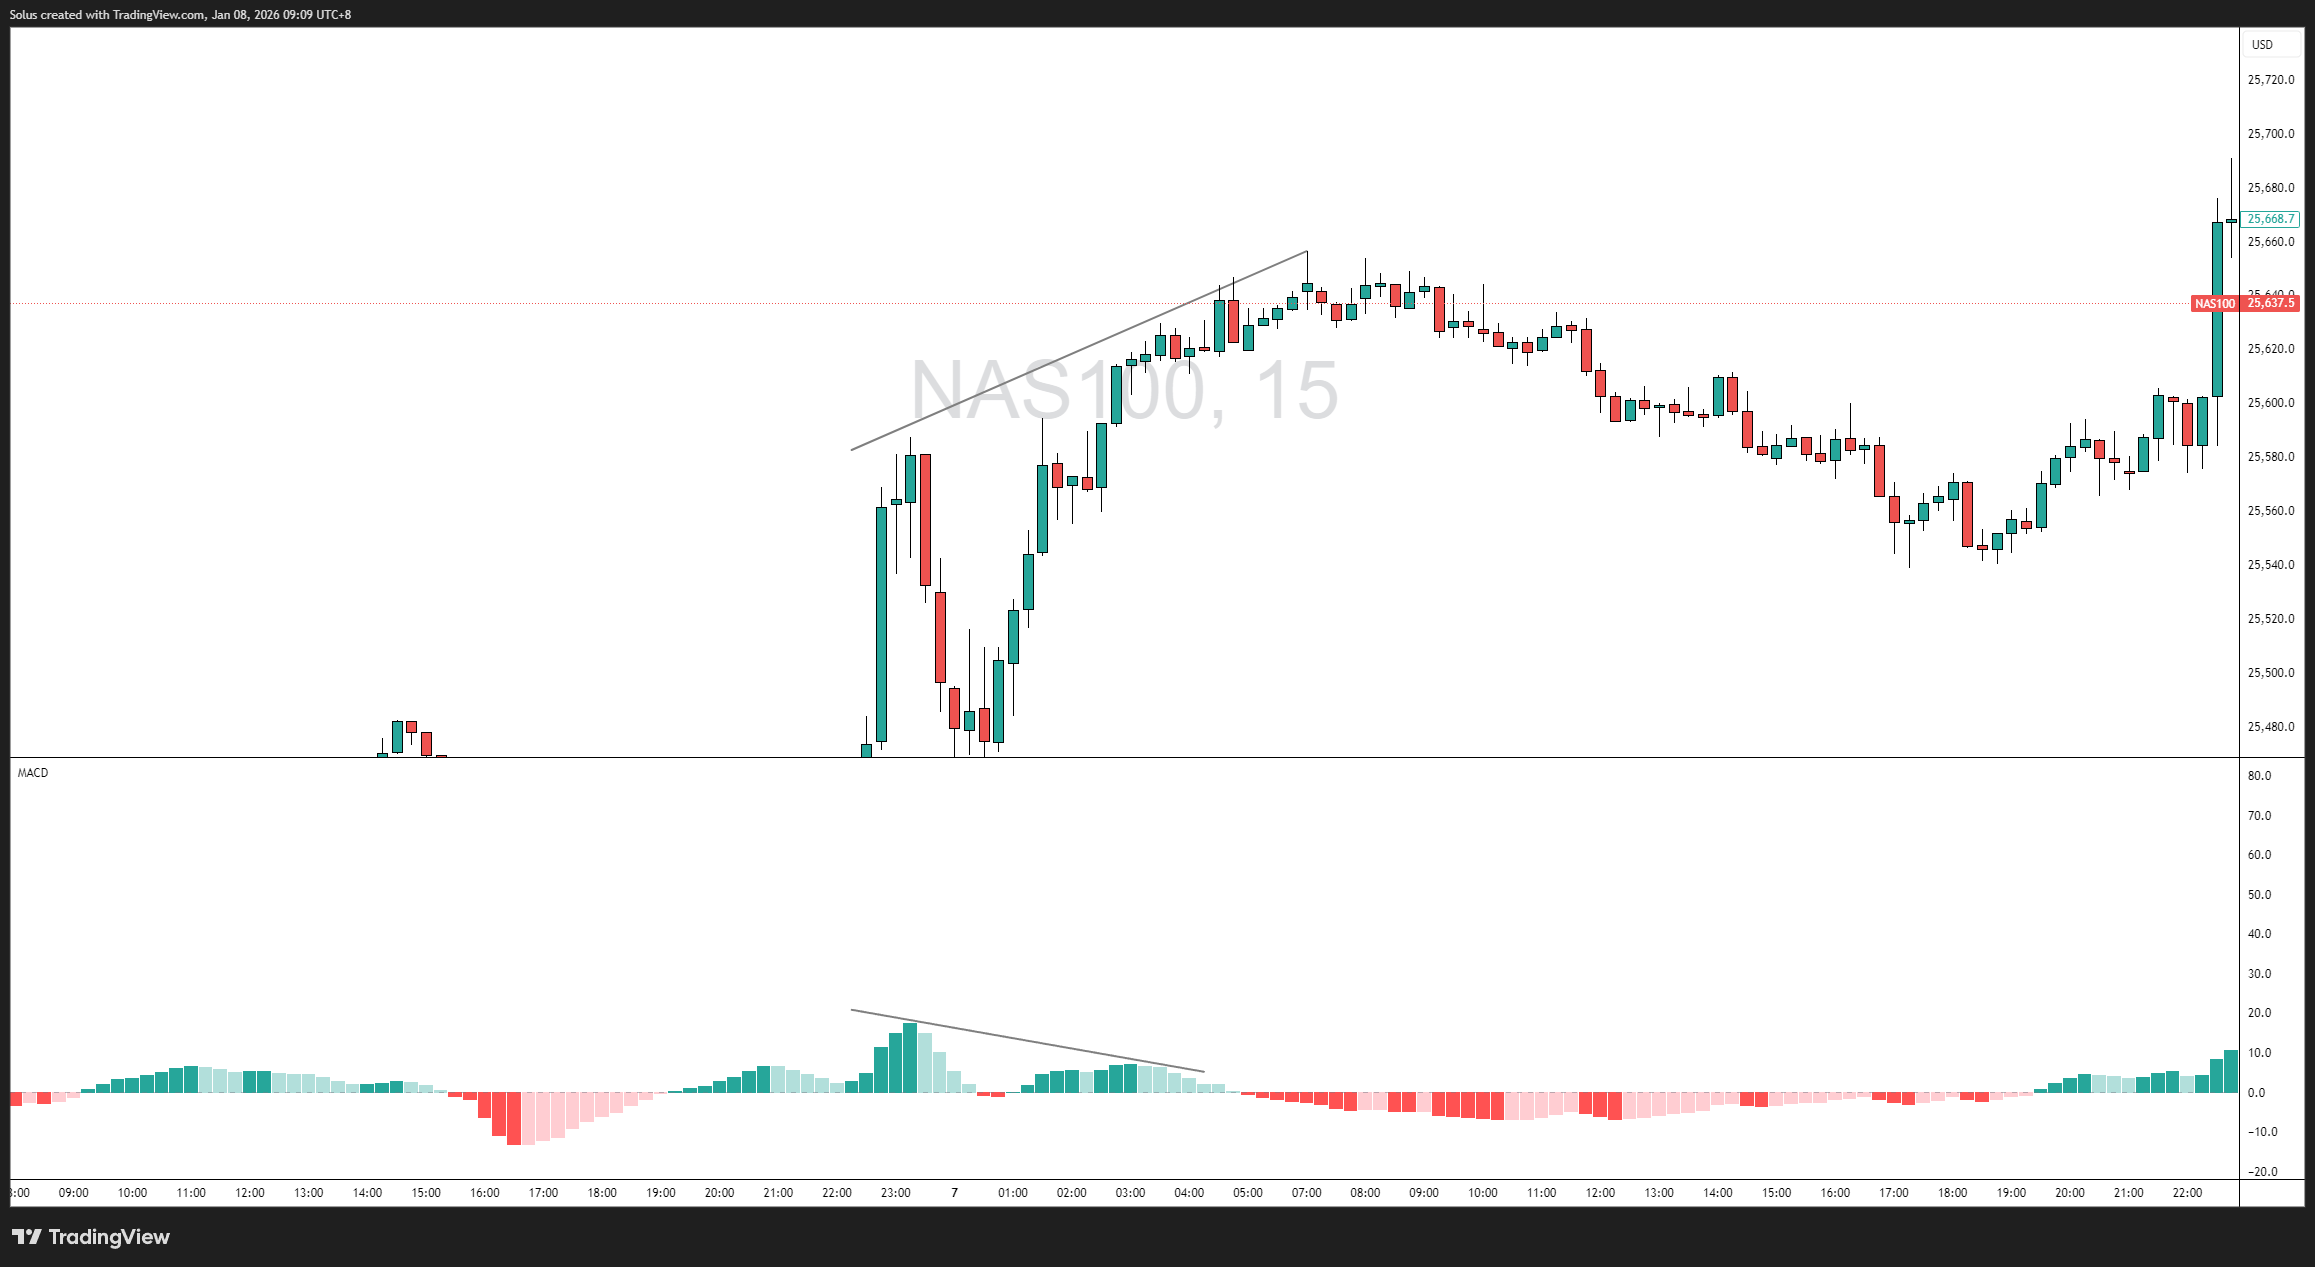
Spotting Momentum Exhaustion Before Price Reacts
Price hides exhaustion. Momentum exposes it.
Before most reversals, you’ll notice:
- Price still making progress
- Histogram failing to expand
- Each push producing weaker momentum
This is not a sell signal. It’s a warning label.
Strong trends don’t reverse suddenly. They slow down first. The histogram lets you see that slowdown before fear hits the chart.
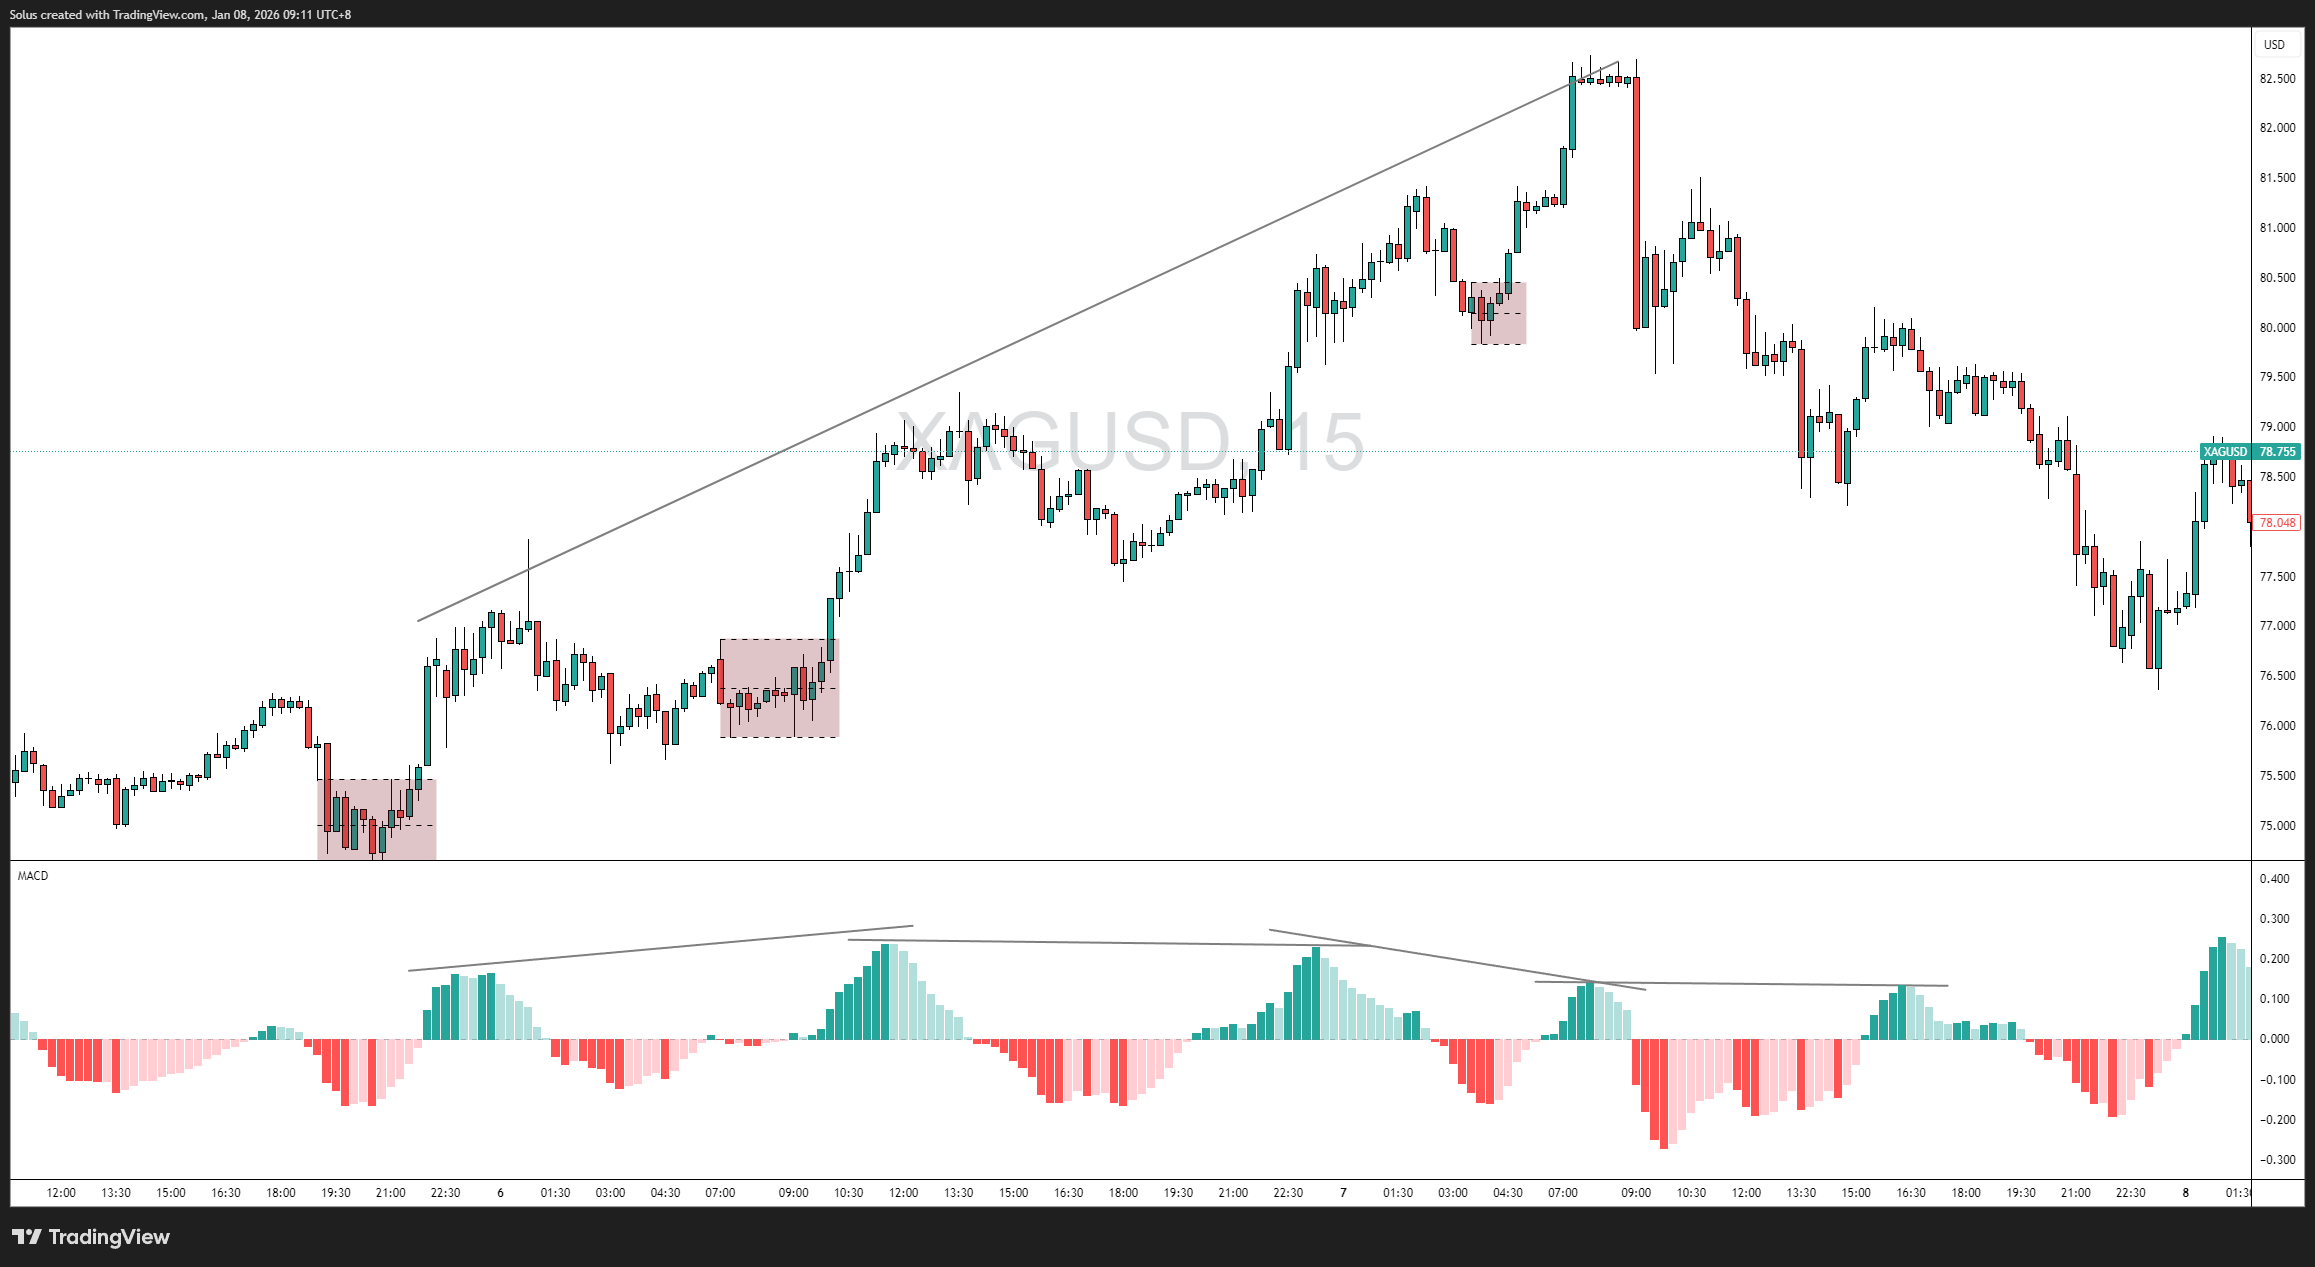
Using Histogram Behavior to Stay in Winning Trades Longer
Most traders exit winning trades too early because they confuse pullbacks with reversals.
The histogram fixes this problem.
Instead of asking:
“Did price pull back?”
Ask:
“Did momentum collapse?”
If contraction is shallow and momentum rebuilds, the trend is likely intact. If contraction accelerates and expansion fails, the trend is losing sponsorship.
This approach helps you:
- Stay in strong trends longer
- Reduce emotional exits
- Manage trades based on behavior, not fear
A Real-Life Analogy: Fire and Heat
Price is the flame.
Momentum is the heat.
A fire doesn’t go out the moment the flame flickers. It dies when the heat disappears.
The MACD histogram measures heat.
By the time the room goes dark, the fire was already dying long before. Momentum tells you that story early.
FAQs About the MACD Histogram
What does the MACD histogram actually measure?
The MACD histogram measures the rate of change of momentum by tracking the distance between the MACD line and the signal line.
Is histogram contraction a reversal signal?
No. Contraction signals weakening momentum, not guaranteed reversal. It’s a condition warning, not an entry trigger.
Can the MACD histogram help with trade management?
Yes. Histogram behavior is excellent for managing trades, staying in trends, and exiting when momentum truly fades.
Is the histogram better than MACD crossovers?
For reading conditions and momentum strength, the histogram is far more useful than crossovers, which are delayed and context-dependent.
Start Trading Live!
- Trade forex, indices, gold, and more
- Access ACY, MT4, MT5, & Copy Trading Platforms
It’s time to go from theory to execution!
Create an Account. Start Your Live Trading Now!
Check Out My Contents:
Beginners Path
- Learn Trading From Scratch: Clean, Simple, Zero-Noise
- Introduction to Trading: What Beginners Must Understand
- Choosing Your Trading Market: Forex, Gold, or Indices
- Beginner Trading Strategy: How to Choose One Setup and Commit
- Minimalist Trading Indicators: The Only Tools Beginners Need
- Master Candlestick Entries: Reading Price Action at Key Levels
- Backtesting for Traders: How to Build Skill Fast
- Trading Risk Management: The Real Edge Behind Consistency
- Trading Psychology: How to Control Yourself in the Markets
- Daily Trading Routine: Build Consistency and Discipline Fast
- Scenario Planning: Expect Both Sides
- Beginner Trading Master Guide 2026: The Complete Roadmap to Consistency
Strategies That You Can Use
Looking for step-by-step approaches you can plug straight into the charts? Start here:
- How To Trade & Scalp Indices at the Open Using Smart Money Concepts (SMC)
- How to Trade Breakouts Effectively in Day Trading with Smart Money Concepts
- Complete Step-by-Step Guide to Day Trading Gold (XAU/USD) with Smart Money Concepts (SMC)
- The Power of Multi-Timeframe Analysis in Smart Money Concepts (SMC)
- Forex Trading Strategy for Beginners
- Mastering Candlestick Pattern Analysis with the SMC Strategy for Day Trading
- How to Use Fibonacci to Set Targets & Stops (Complete Guide)
- RSI Divergence Trading Strategy for Gold: How to Identify and Trade Trend Reversals
- Stochastics Trading Secrets: How to Time Entries in Trending Markets using Stochastics
- Gold Trading Stochastics Strategy: How to Trade Gold with 2R - 3R Targets
- RSI Hidden Divergence Explained: How to Spot Trend Continuations Like a Pro
- Moving Averages Trading Strategy Playbook
- Mastering Fibonacci Trading Psychology - Trusting the Levels, Managing the Mind
- Mastering Price Action at Key Levels - How to Spot, Trade, and Win at the Most Crucial Zones
- Mastering Retests: How to Enter with Confirmation After a Breakout
Indicators / Tools for Trading
Sharpen your edge with proven tools and frameworks:
- The Ultimate Guide to Risk Management in Trading - A Complete Compilation for 2026
- Moving Averages Trading Strategy Playbook
- How to Think Like a Price Action Trader
- Mastering Fibonacci Trading Psychology - Trusting the Levels, Managing the Mind
How To Trade News
News moves markets fast. Learn how to keep pace with SMC-based playbooks:
- Why Smart Money Concepts Work in News-Driven Markets - CPI, NFP, and More
- How to Trade NFP Using Smart Money Concepts (SMC) - A Proven Strategy for Forex Traders
- How to Trade CPI Like Smart Money - A Step-by-Step Guide Using SMC
- Learn to Trade News by Backtesting it with Forex Tester
Learn How to Trade US Indices
From NASDAQ opens to DAX trends, here’s how to approach indices like a pro:
- How to Start Trading Indices and Get into the Stock Market with Low Capital (2026 Guide)
- Best Indices to Trade for Day Traders | NASDAQ, S&P 500, DAX + Best Times to Trade Them
- How To Trade & Scalp Indices at the Open Using Smart Money Concepts (SMC)
- NAS100 - How to Trade the Nasdaq Like a Pro (Smart Money Edition)
How to Start Trading Gold
Gold remains one of the most traded assets - here’s how to approach it with confidence:
- How to Swing Trade Gold (XAU/USD) Using Smart Money Concepts: A Simple Guide for Traders
- Complete Step-by-Step Guide to Day Trading Gold (XAU/USD) with Smart Money Concepts (SMC)
- The Ultimate Guide to Backtesting and Trading Gold (XAU/USD) Using Smart Money Concepts (SMC)
- Why Gold Remains the Ultimate Security in a Shifting World
- How to Exit & Take Profits in Trading Gold Like a Pro: Using RSI, Range Breakdowns, and MAs as Your Confluence
- Backtest Gold using Forex Tester Online
How to Trade Japanese Candlesticks
Candlesticks are the building blocks of price action. Master the most powerful ones:
- Mastering the Top Japanese Candlesticks: The Top 5 Candlesticks To Trade + Top SMC Candlestick Pattern
- How to Trade Candlestick Patterns with High Probability: A Complete Guide for Beginners
- The Top Japanese Candlestick Guide: What is an Engulfing Pattern and How to Trade It?
- Piercing Pattern Candlestick Explained: How to Trade It - Step-By-Step Guide
- Morning & Evening Star Candlestick Patterns - How to Trade Market Reversals with Confidence
How to Start Day Trading
Ready to go intraday? Here’s how to build consistency step by step:
- 5 Steps to Start Day Trading: A Strategic Guide for Beginners
- 8 Steps How to Start Forex Day Trading in 2026: A Beginner’s Step-by-Step Guide
- 3 Steps to Build a Trading Routine for Consistency and Discipline - Day Trading Edition
- The Ultimate Guide to Understanding Market Trends and Price Action
- Trading with Momentum: The Best Trading Session to Trade Forex, Gold and Indices
Swing Trading 101
- Introduction to Swing Trading
- The Market Basics for Swing Trading
- Core Principles of Swing Trading
- The Technical Foundations Every Swing Trader Must Master
- Swing Trader’s Toolkit: Multi-Timeframe & Institutional Confluence
- The Psychology of Risk Management in Swing Trading
- Swing Trading Concepts To Know In Trading with Smart Money Concepts
- Becoming a Consistent Swing Trader: Trading Structure & Scaling Strategy
Learn how to navigate yourself in times of turmoil
Markets swing between calm and chaos. Learn to read risk-on vs risk-off like a pro:
- How to Identify Risk-On and Risk-Off Market Sentiment: A Complete Trader’s Guide
- How to Trade Risk-On and Risk-Off Sentiment - With Technical Confirmation
- The Ultimate Guide to Understanding Market Trends and Price Action
- Metals in Risk-On and Risk-Off Environments: How Sentiment Moves Gold and Commodities
Want to learn how to trade like the Smart Money?
Step inside the playbook of institutional traders with SMC concepts explained:
- Why Smart Money Concepts Work: The Truth Behind Liquidity and Price Action
- Mastering the Market with Smart Money Concepts: 5 Strategic Approaches
- Understanding Liquidity Sweep: How Smart Money Trades Liquidity Zones in Forex, Gold, US Indices
- The SMC Playbook Series Part 1: What Moves the Markets? Key Drivers Behind Forex, Gold & Stock Indices
- The SMC Playbook Series Part 2: How to Spot Liquidity Pools in Trading - Internal vs External Liquidity Explained
- Fair Value Gaps Explained: How Smart Money Leaves Footprints in the Market
- Accumulation, Manipulation, Distribution: The Hidden Cycle That Runs Every Market
- Institutional Order Flow - Reading the Market Through the Eyes of the Big Players
- London Session Trading Secrets: How Smart Money Sets the High & Low of the Day
- Mastering the New York Session - Smart Money Concepts Guide
- Anatomy of a Perfect Execution: How SMC Traders Trade with Precision
- Step-by-Step Trading Confirmation Guide for Precise Execution
- Execution Psychology: Turning Hesitation into Confidence
- What Is an Order Block? The Institutional Footprint Explained
- Anatomy of a Valid Order Block in Smart Money Concepts
- How to Draw Order Blocks Accurately - Day Trading Style
- Order Blocks and AMD Market Structure (Smart Money Concepts)
- The Confirmation Model: OB + FVG + Liquidity Sweep (Smart Money Concepts)
Master the World’s Most Popular Forex Pairs
Forex pairs aren’t created equal - some are stable, some are volatile, others tied to commodities or sessions.
- The Top 5 All-Time Best Forex Pairs to Trade
- Top Forex Pairs Beyond the Big Five
- EUR/USD: The King of Forex
- USD/JPY: The Fast Mover
- GBP/USD: The Volatile Cable
- AUD/USD: The Commodity Currency
- USD/CAD: The Oil-Backed Pair
- GBP/JPY: How to Trade The Beast
- Asian & London Session Secrets
- Mastering the New York Session
Metals Trading
- Metals Trading: Why Gold and Metals Are Rising Again
- Silver Trading: The Underdog with Dual Identity
- Gold vs Silver: Institutional Demand Breakdown Explained
- How to Day Trade Silver Like a Pro: Smart Money Tactics for XAG/USD
- Platinum & Palladium: The Quiet Power Duo of Industrial Metals
- How to Trade Metals with SMC and Fundamentals - Gold Trading Strategy
- Metals in Risk-On and Risk-Off Environments: How Sentiment Moves Gold and Commodities
- Future of Metals Market: Gold Forecast 2026 & Long-Term Commodities Outlook
Stop Hunting 101
If you’ve ever been stopped out right before the market reverses - this is why:
- Stop Hunting 101: How Swing Highs and Lows Become Liquidity Traps
- Outsmarting Stop Hunts: The Psychology Behind the Trap
- How to Lessen Risk From Stop Hunts in Trading
- How Stop Hunts Trigger Revenge Trading - Breaking the Pain Cycle
- How to Accept Stop Hunts Without Losing Discipline - Shifting From Frustration to Focus
Trading Psychology
Mindset is the deciding factor between growth and blowups. Explore these essentials:
- The Mental Game of Execution - Debunking the Common Trading Psychology
- Managing Trading Losses: Why You Can Be Wrong and Still Win Big in Trading
- The Hidden Threat in Trading: How Performance Anxiety Sabotages Your Edge
- Why 90% of Retail Traders Fail Even with Profitable Trading Strategies
- Top 10 Habits Profitable Traders Follow Daily to Stay Consistent
- Top 10 Trading Rules of the Most Successful Traders
- Top 10 Ways to Prevent Emotional Trading and Stay Disciplined in the Markets
- Why Most Traders Fail - Trading Psychology & The Hidden Mental Game
- Emotional Awareness in Trading - Naming Your Triggers
- Discipline vs. Impulse in Trading - Step-by Step Guide How to Build Control
- Trading Journal & Reflection - The Trader’s Mirror
- Overcoming FOMO & Revenge Trading in Forex - Why Patience Pays
- Risk of Ruin in Trading - Respect the Math of Survival
- Identity-Based Trading: Become Your Trading System for Consistency
- Trading Psychology: Aligning Emotions with Your System
- Mastering Fear in Trading: Turn Doubt into a Protective Signal
- Mastering Greed in Trading: Turn Ambition into Controlled Growth
- Mastering Boredom in Trading: From Restless Clicking to Patient Precision
- Mastering Doubt in Trading: Building Confidence Through Backtesting and Pattern Recognition
- Mastering Impatience in Trading: Turn Patience Into Profit
- Mastering Frustration in Trading: Turning Losses Into Lessons
- Mastering Hope in Trading: Replacing Denial With Discipline
- When to Quit on Trading - Read This!
- The Math of Compounding in Trading
- Why Daily Wins Matter More Than Big Wins
- Scaling in Trading: When & How to Increase Lot Sizes
- Why Patience in Trading Fuels the Compounding Growth
- Step-by-Step Guide on How to Manage Losses for Compounding Growth
- The Daily Habits of Profitable Traders: Building Your Compounding Routine
- Trading Edge: Definition, Misconceptions & Casino Analogy
- Finding Your Edge: From Chaos to Clarity
- Proving Your Edge: Backtesting Without Bias
- Forward Testing in Trading: How to Prove Your Edge Live
- Measuring Your Edge: Metrics That Matter
- Refining Your Edge: Iteration Without Overfitting
- The EDGE Framework: Knowing When and How to Evolve as a Trader
- Scaling Your Edge: From Small Account to Consistency
- Trading in the Zone: Execution Through Habit and Structure
- Trading in the Zone: Thinking in Probabilities
- The Inner War: Fear, Greed, and the Illusion of Control
- Detachment Discipline in Trading: How to Let Go of the Need to Be Right
- Trading Hack: Why You Keep Breaking Your Own Rules (And How to Stop)
- Trading Mindset Mastery: Building Confidence Through Data
- Flow State Trading: Entering the Zone Through Structure
- Cognitive Traps in Trading: Overconfidence, Recency Bias & Revenge Trades
- The Psychology of Risk in Trading: Fear of Loss vs Fear of Missing Out
- Self-Trust in Trading - Building Confidence from Repetition, Not Just Results
- The Zen of Trading: Becoming the Observer, Not the Reactor
- The Market Is Always Right: Why You Must Adapt, Not Demand
- The Three Stages to Becoming a Consistent Trader
- The Enemy Within: Limiting Beliefs and Emotional Conflict in Trading
- Self-Discipline in Trading: A Skill, Not a Personality Trait
- Mental Energy Management in Trading: Controlling Impulse, Stress, and Overwhelm
- Creating the Disciplined Trader Identity
- The Disciplined Trader: The Complete Blueprint for Consistency
- What Separates Market Wizards From Everyone Else - Complete Trading Series
Market Drivers
- Central Banks and Interest Rates: How They Move Your Trades
- Inflation & Economic Data: CPI Trading Strategy and PPI Indicator Guide
- Geopolitical Risks & Safe Havens in Trading (Gold, USD, JPY, CHF)
- Jobs, Growth & Recession Fears: NFP, GDP & Unemployment in Trading
- Commodities & Global Trade: Oil, Gold, and Forex Explained
- Market Correlations & Intermarket Analysis for Traders
Risk Management
The real edge in trading isn’t strategy - it’s how you protect your capital:
- Mastering Risk Management: Stop Loss, Take Profit, and Position Sizing
- Why Risk Management Is the Only Edge That Lasts
- How Much Should You Risk per Trade? (1%, 2%, or Less?)
- The Ultimate Risk Management Plan for Prop Firm Traders - Updated 2026
- Mastering Position Sizing: Automate or Calculate Your Risk Like a Pro
- Martingale Strategy in Trading: Compounding Power or Double-Edged Sword?
- How to Add to Winners Using Cost Averaging and Martingale Principle with Price Confirmation
- Managing Imperfect Entries in Trading - How Professionals Stay Composed
- The Ultimate Trading Journal Master Guide (Full Series Compilation)
Suggested Learning Path
If you’re not sure where to start, follow this roadmap:
- Start with Trading Psychology → Build the mindset first.
- Move into Risk Management → Learn how to protect capital.
- Explore Strategies & Tools → Candlesticks, Fibonacci, MAs, Indicators.
- Apply to Assets → Gold, Indices, Forex sessions.
- Advance to Smart Money Concepts (SMC) → Learn how institutions trade.
- Specialize → Stop Hunts, News Trading, Turmoil Navigation.
This way, you’ll grow from foundation → application → mastery, instead of jumping around randomly.
Follow me for more daily market insights!
Jasper Osita - LinkedIn - FXStreet - YouTube
This content may have been written by a third party. ACY makes no representation or warranty and assumes no liability as to the accuracy or completeness of the information provided, nor any loss arising from any investment based on a recommendation, forecast or other information supplies by any third-party. This content is information only, and does not constitute financial, investment or other advice on which you can rely.
延伸閱讀

