The Power of Multi-Timeframe Analysis in Smart Money Concepts (SMC)
2025-05-06 13:23:29


Goal of This Lesson:
To show you how to analyze the market from the top-down, align multiple timeframes for a single trade setup, and stack smart money confluences for maximum confidence and precision.
By the End of This Lesson, You Should Be Able To:
- Read price across Daily, H1, and M15/M5 like layers of the same story
- Frame high-probability trades using top-down liquidity zones
- Align structure and timing across timeframes for smart money precision
- Avoid isolated LTF trades that go against institutional flow
Why Multi-Timeframe Trading Matters

Smart money isn’t just reacting to what’s happening on M5 or M15—they’re operating from H1, H4, and Daily bias zones, while executing with surgical precision on the lower timeframes.
If you're only trading M5 setups in isolation, you're trading inside someone else's trap.
But when you align timeframes, you move in sync with the trap-setters.
Multi-Timeframe Combination

Below are the suggested timeframe combinations based on trader’s profile:
- Scalper - M15, M5, M1
- If you thrive in fast-paced environments and have the mental agility to make rapid decisions, then scalping might be your calling.
2.Day Trader - H1, M15, M5
- If you enjoy the thrill of intraday action but prefer the peace of mind of being flat by day’s end, day trading could be the ideal style for you.
3. Swing Trader - Daily, H4, H1
- This style is ideal for those who prefer a balanced approach with lower risk and higher reward potential. If you value patience and strategic discipline, swing trading might be your match.
4. Position Trader - Monthly, Weekly, Daily
- This style is perfect for those who have busy schedules, minimal time for active trading, and the patience to trust long-term strategies. If you’re looking for a low-maintenance approach with significant reward potential, position trading is worth considering.
Determine Your Trading Profile First!

The timeframe that you will trade will depend on your profile. The profile includes your availability, personality, and strengths. If you can hold a position in a longer period, you might be a swing trader or a trend follower.
If your profile tells you that you like to be in action most of the time and you have a strong emotional resilience, you might be a day trader or scalper.
If your personality doesn't match your way of trading, your equity curve will reveal it to you.
Want to understand your profile and take the quiz? Check out this blog:
- https://acy.com/en/market-news/education/discovering-your-trader-profil-124449/
- Take the quiz here: https://www.tradingcup.com/trading-style-quiz
The Top-Down Approach: Institutional Framing
We’re not looking to trade every chart. We’re looking for:
- Higher Timeframe Liquidity Zones
- Breaks in Market Structure
- Lower Timeframe Confirmation and FVG Entries
Step-by-Step Process:
1. Start on the Daily Chart (D1)

Basing on the Previous Daily Candle, we have a potential of breaking down from the Previous Day’s Low.
| Objective | Action |
|---|---|
| Find Key Liquidity | Mark PDH/PDL major swing highs/lows |
| Bias Clues | Is price approaching or reacting from HTF liquidity? |
| Anticipate Key Level Reactions | Frame where price will draw to either the previous day’s high or low |
You’re not trading D1—you’re framing the environment.
2. Drop to H1 or M15 – Identify Institutional Intent


With the premise that we might go bearish based on the Previous Daily Candle, we are looking for shorts at Asian Highs or London Highs.
Note: Though our initial bias is bearish, we still need to look for validation at LTF. We either reverse at LTF for downside move or we might continue to rebound to the upside.
| Objective | Action |
|---|---|
| Mark Key Levels | Mark Asian and London Highs & Low |
| Wait for Key Levels | Don’t do anything unless a key level has been hit |
| Look for Sweeps | Has price swept a previous high or low? |
This is your HTF bias confirmation zone. If HTF hasn’t shifted, LTF trades are high risk.
3. Zoom into M5 or M1 for Entry
| Objective | Action |
|---|---|
| Look for Key Level Reaction | Is there price strength at the level? Is price not having a follow through? |
| Look for IRL | Look for FVGs, iFVGs. Wait for candle confirmation if the IRLs are getting respected. |
| Enter Once Confirmed | Entry at Key Levels during Kill Zones ONLY (EU/NY sessions) |
| Use the SSS method for confirmation. | Wait for the Sweep. Execute at the Surge. Anticipate the Shift. |
You’re executing in sync with HTF direction, not against it.

Looking at the LTF, it appears that the Asian high is holding its ground and there’s no obvious sweep of the Asian high.
Note: The key here is patience. If there’s no obvious Sweep at the London session. We anticipate the opportunity at the New York session.
We can wait for the 930AM EST New York Open for a potential sweep of London High or Low.

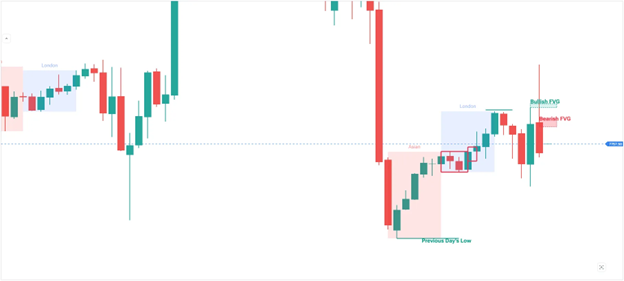
Right after the New York Open, after price flirting at the London Low, it managed to get support and went into momentum.
Looking back on our original bearish bias, we now have to shift to a bullish bias since:
- There was no sweep of Asian Low.
- London Low swept to the upside.
- Obvious Surged happened at the London Low after the Sweep.
Note: Bias must be flexible where price is reacting.
We just need now an FVG for entry.

We had an FVG for opportunity but the probability of this holding decreased since price traded through it not respecting the bullish FVG.

The Bullish FVG did not manage to hold. After dropping, price created a bearish FVG.
For context, let’s check the higher timeframe how it looks so we are still framing the trade.
Looking at the H1 Higher Timeframe, apparently, price swept the London high during the New York session. After shifting from bearish to bullish and now to bearish again after the higher timeframe confirmed the sweep, we will now adjust.
We now wait if the bearish FVG will hold for downside potential.

Looking at the bearish FVG, we had a bearish reaction. We can now enter here with stops just behind the 1st candle of the 3 candle FVG pattern.
We can set our TP either we reach 2-3R or the Asian Low together with the Previous Day’s Low.
M5 Timeframe

H1 Timeframe

Daily Timeframe

Trade Flow:
- D1: Price is near previous day’s low (external liquidity) anticipating the current day to be bearish.
- H1-M15: Framing Session High → Sweep Opportunity
- Sweep on Asian High → Failed
- Sweep on London Low → Succeed → Shifted to Bullish Bias
- After Sweeping the London Low s → Bullish FVG Failed to Hold
- Failed Bullish FVG → Price Declined Creating a Bearish FVG
- Bearish FVG Held → Shifted to Bearish Bias
- M5-M1: Price retraces into that FVG during NY Kill Zone → MSS + clean bearish FVG → Sell entry.
You just executed a 3-timeframe aligned, institutional-grade setup.
What to Look for Across All Timeframes
| Layer | ERL | Sweep | Surge | Shift | Time Bias |
|---|---|---|---|---|---|
| D1 | ✅ (PDH / PDL) | Optional | Optional | Optional | Anchor bias zone |
| H1/M15 | ✅ (PSH / PSL) | Optional | Optional | Optional | Confirm shift |
| M5/M1 | ✅ (PSH / PSL) | ✅ | ✅ (Entry) | ✅ | Entry precision |
The more boxes you check across multiple frames, the stronger the trade.
Mindset Shift: Confluence Over Confirmation
Don’t chase setups. Instead, build layers of logic:
HTF Liquidity → MSS → FVG → LTF MSS → FVG Entry
This is how institutions stack confluences before deploying size. You’ll do the same, just on a smaller scale.
This content may have been written by a third party. ACY makes no representation or warranty and assumes no liability as to the accuracy or completeness of the information provided, nor any loss arising from any investment based on a recommendation, forecast or other information supplies by any third-party. This content is information only, and does not constitute financial, investment or other advice on which you can rely.