USDJPY Forecast: Will USD/JPY Break 158 or Reverse Lower Next?
2025-12-10 13:15:39


- USD/JPY rebounds strongly from the 154.60 manipulation zone, reclaiming short-term bullish structure ahead of key macro catalysts.
- Rate-cut expectations in the U.S. and BOJ’s delayed hawkish shift continue to create a tug-of-war in the pair.
- 156.18 and 157.89 remain the critical levels that decide whether USD/JPY retests its 52-week high at 158.88 — or rotates into a deeper correction.
USD/JPY Attempts a Recovery — But Is the Trend Strong Enough to Break 158 Again?
USD/JPY has bounced impressively after tapping into the 154.66 manipulation zone, a level where liquidity was engineered before the latest rally. The recovery pushed price back above the 156.18 breakout level, signaling a short-term bullish continuation—but the bigger question remains:
Is USD/JPY gearing up for another run at 158.80, or is this just a retracement before another wave lower?
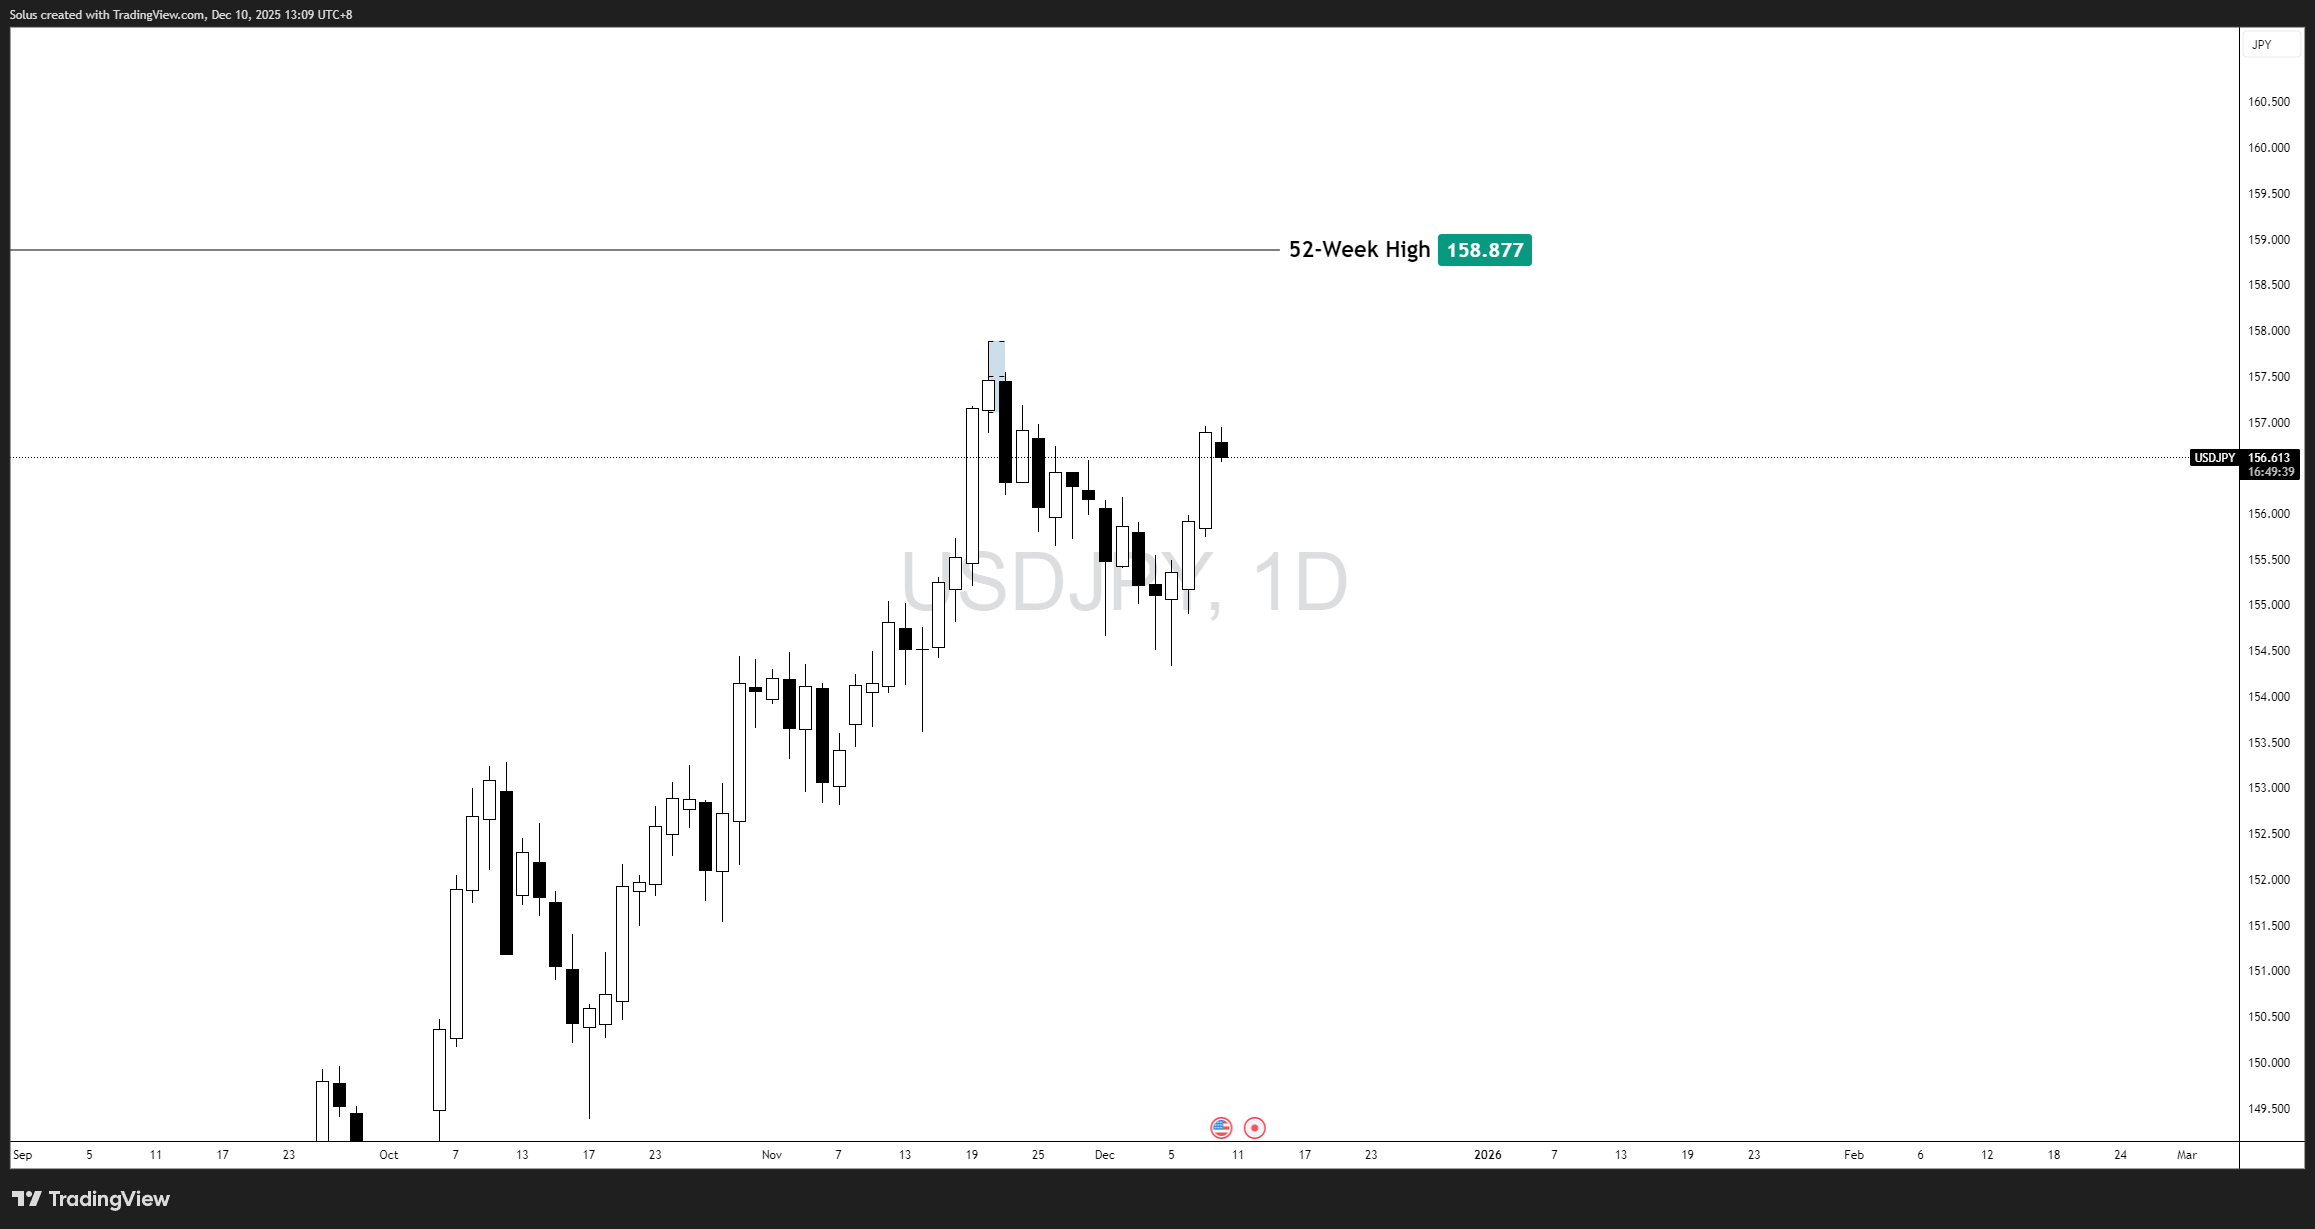
The daily chart shows a clean reaction after the November sell-off, but price remains below the major swing high at 158.877, which represents the 52-week high and a key psychological barrier where the BOJ previously intervened.
This makes the current zone extremely important:
Breakout = momentum continuation. Rejection = macro-driven pullback.
Fundamental Tailwinds and Headwinds: USD Strength vs BOJ Uncertainty
1. Fed Rate-Cut Expectations Are Pressuring USD — but Not Enough to Flip the Trend
The market is now pricing a December rate cut, which typically weakens USD.
Yet USD/JPY remains elevated because:
- The Fed cutting slowly is still USD-supportive
- Japanese yields remain near zero
- No BOJ tightening is visible yet
This creates a scenario where USD can weaken, but JPY still cannot strengthen meaningfully.
2. BOJ Hawkish Expectations Keep Volatility High
Traders continue to speculate that the Bank of Japan may normalize policy in 2026 — but officials remain silent.
This uncertainty creates the sharp swings we see on the 4H chart.
3. Risk Sentiment Also Matters
As global indices push higher, USD/JPY often rises with them.
If markets turn risk-off, USD/JPY becomes vulnerable to a sudden unwinding.
Why 156–158 Is Such a Critical Zone
Recent U.S. data (NFP, CPI components, ISM employment) has softened the USD outlook but not enough to reverse the broader trend.
At the same time:
- BOJ refuses to commit to rate hikes
- Yen intervention threats remain verbal only
- FX markets expect BOJ action only if USD/JPY spikes dramatically
This leaves USD/JPY in a delicate balance where one strong U.S. data release could lift price back to 158+, but one weak print could trigger a fast drop back to 154.
Technical Outlook
SD/JPY is currently pulling back after rejecting near 157, but the structure remains bullish above 156.18.
The next major upside magnet is:
- 157.891 (Next Key Level)
- 158.877 (52-Week High)
Daily order flow suggests buyers still control momentum as long as the 154.66 zone remains intact.
The 4H shows the cleanest roadmap:
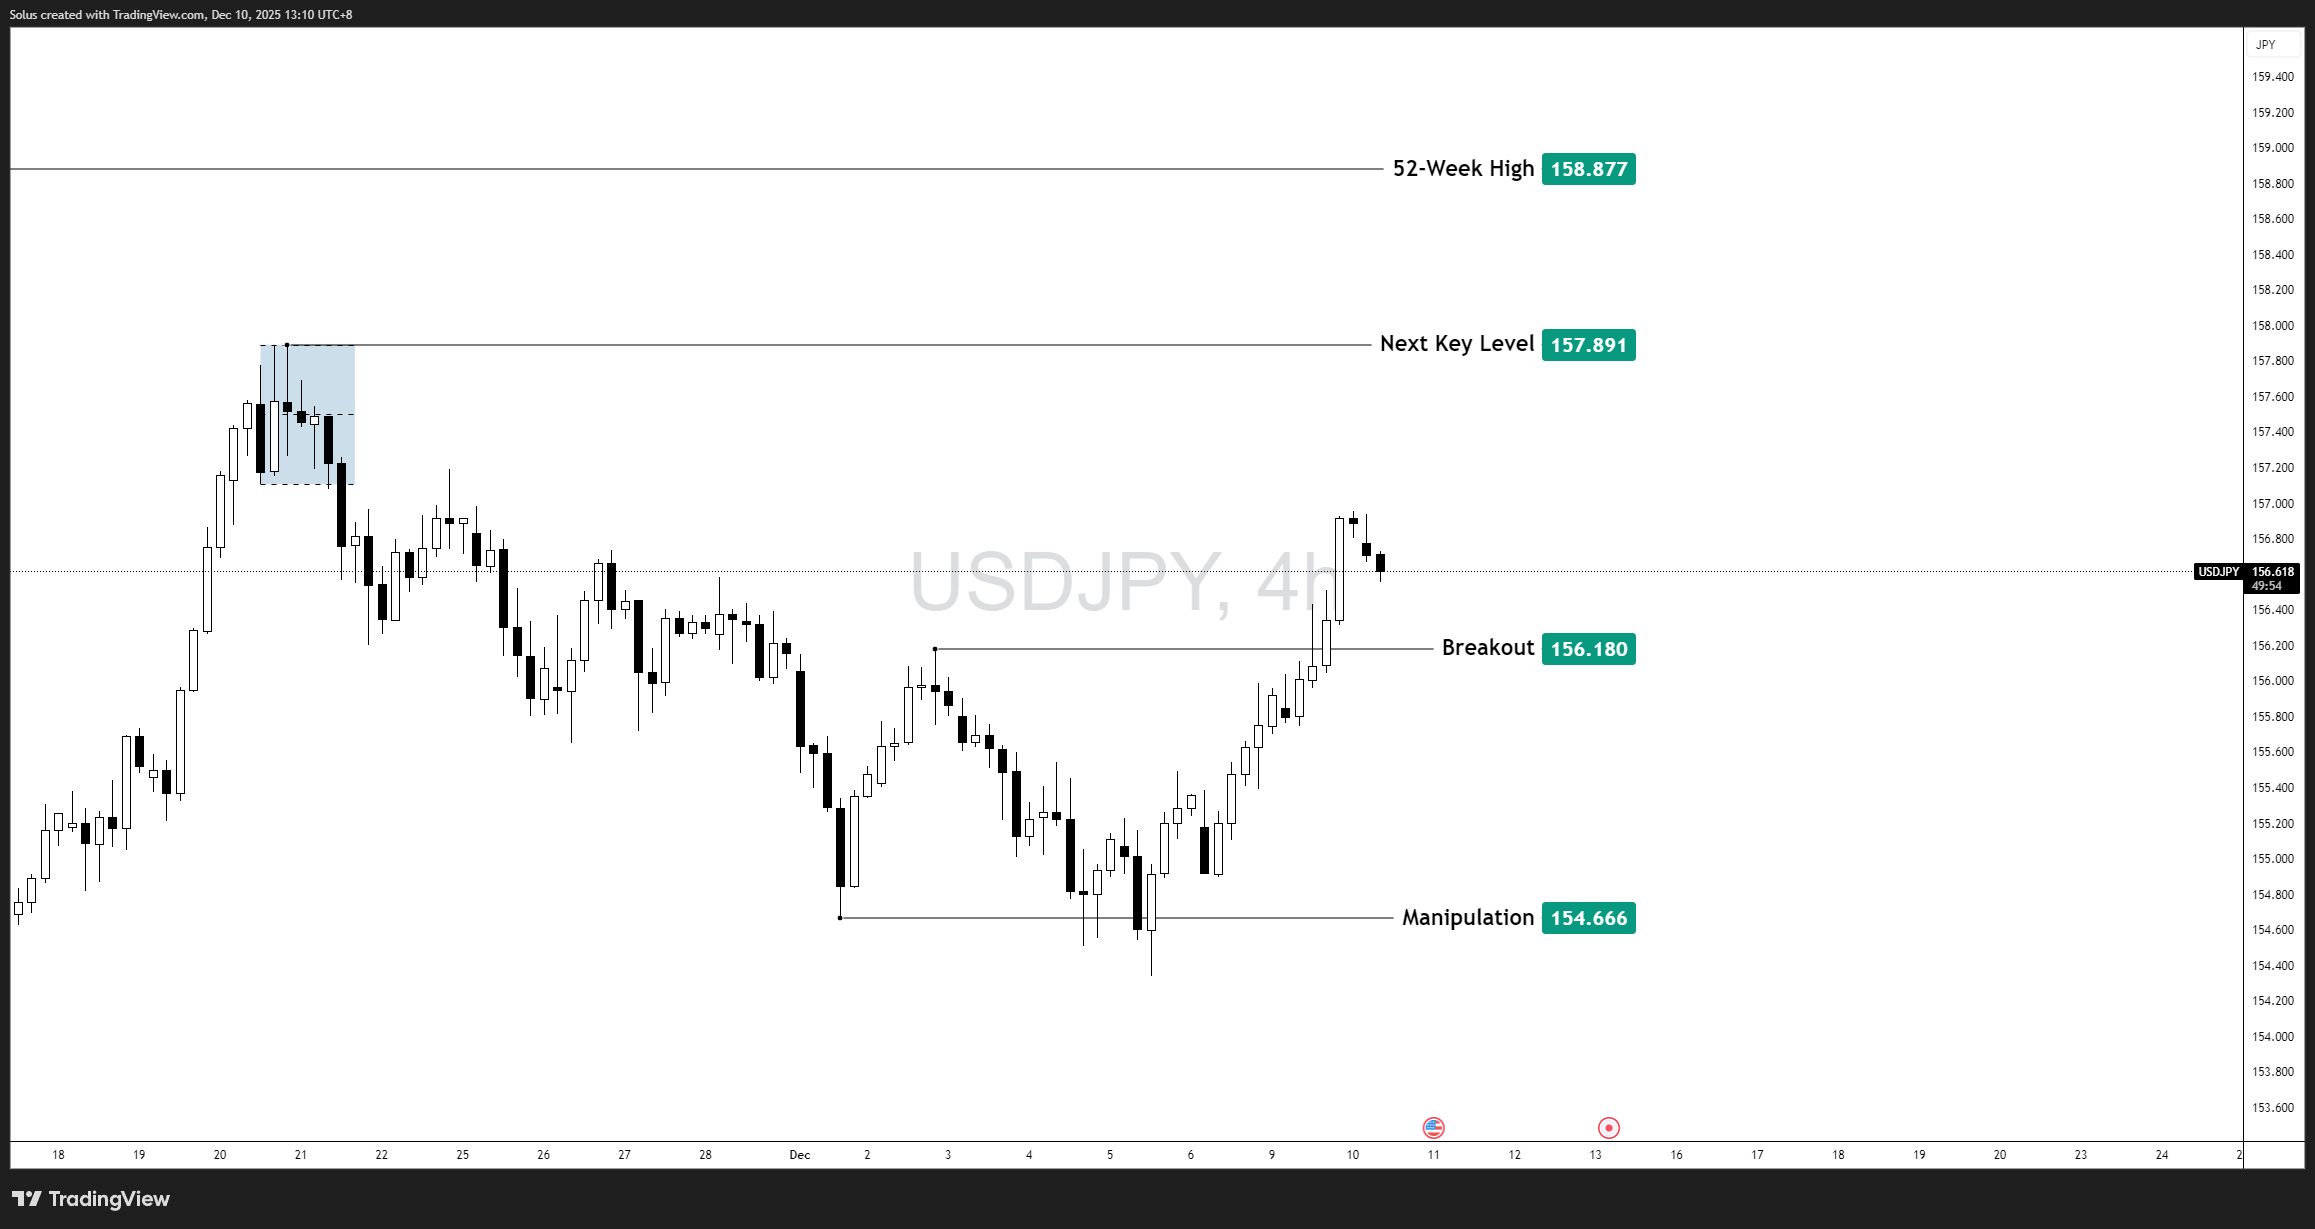
- 154.666 → manipulation and liquidity sweep
- 156.180 → the breakout and key structural level
- 157.891 → next upside objective
The current pullback is normal as long as price stays above 156.18.
Failure to hold above this level would shift momentum.
Bullish Scenario: Breakout Toward 158.88
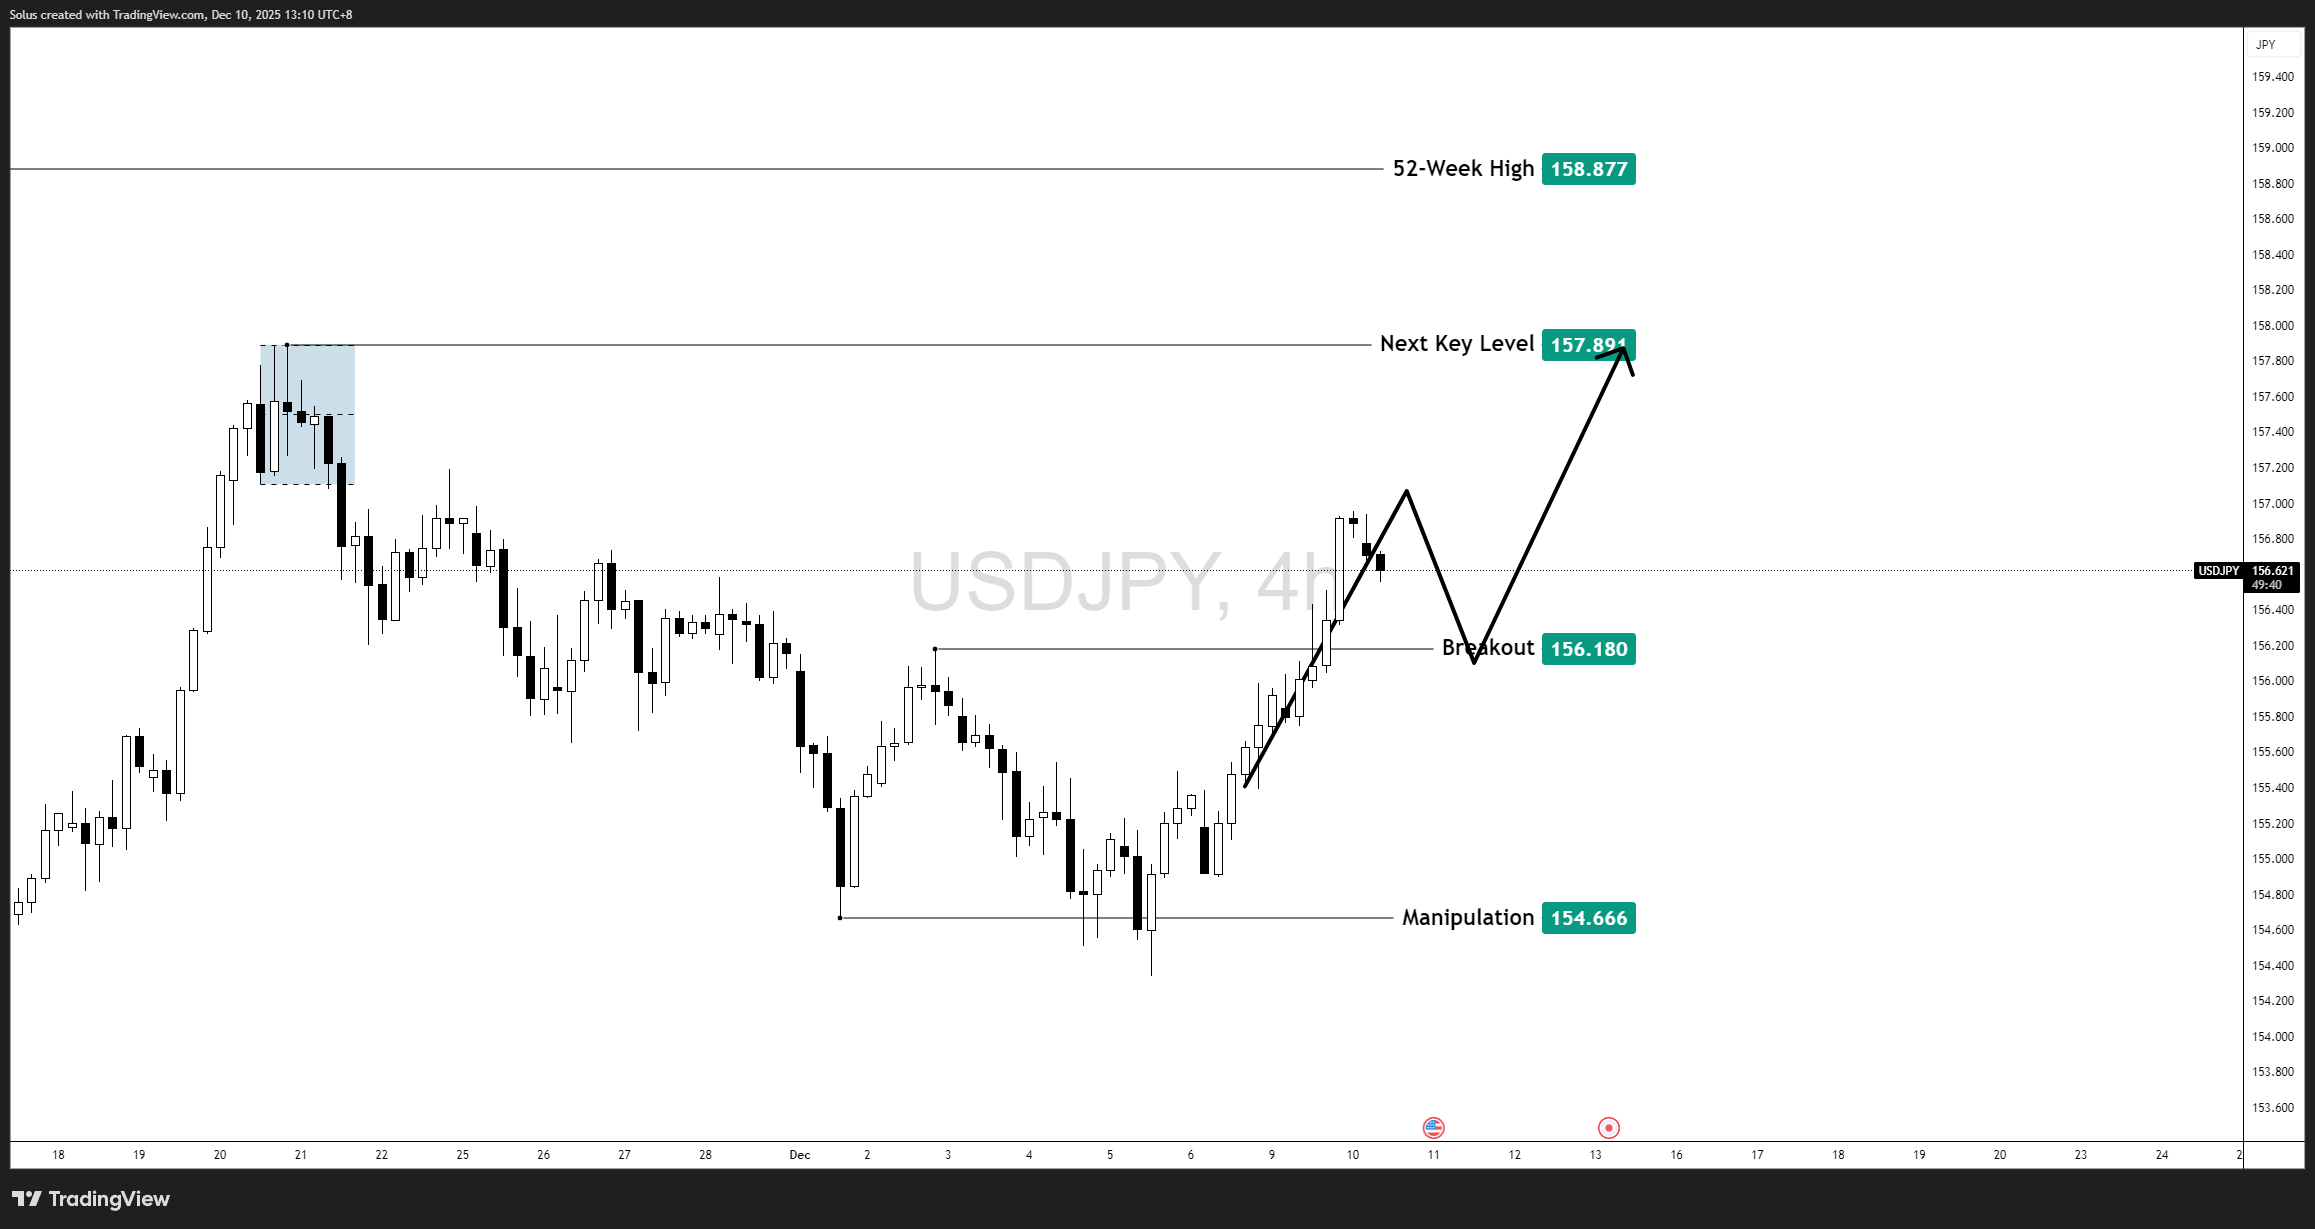
The bullish case strengthens if:
- USD/JPY holds above 156.18
- Generates a higher low on the 4H
- Breaks through 157.891
If these align, price can extend toward:
- 158.877 (52-Week High)
- 159.20 – 159.50 liquidity pockets
This scenario aligns with Fed caution + BOJ hesitation.
Bearish Scenario: Failed Retest and Rotation Lower
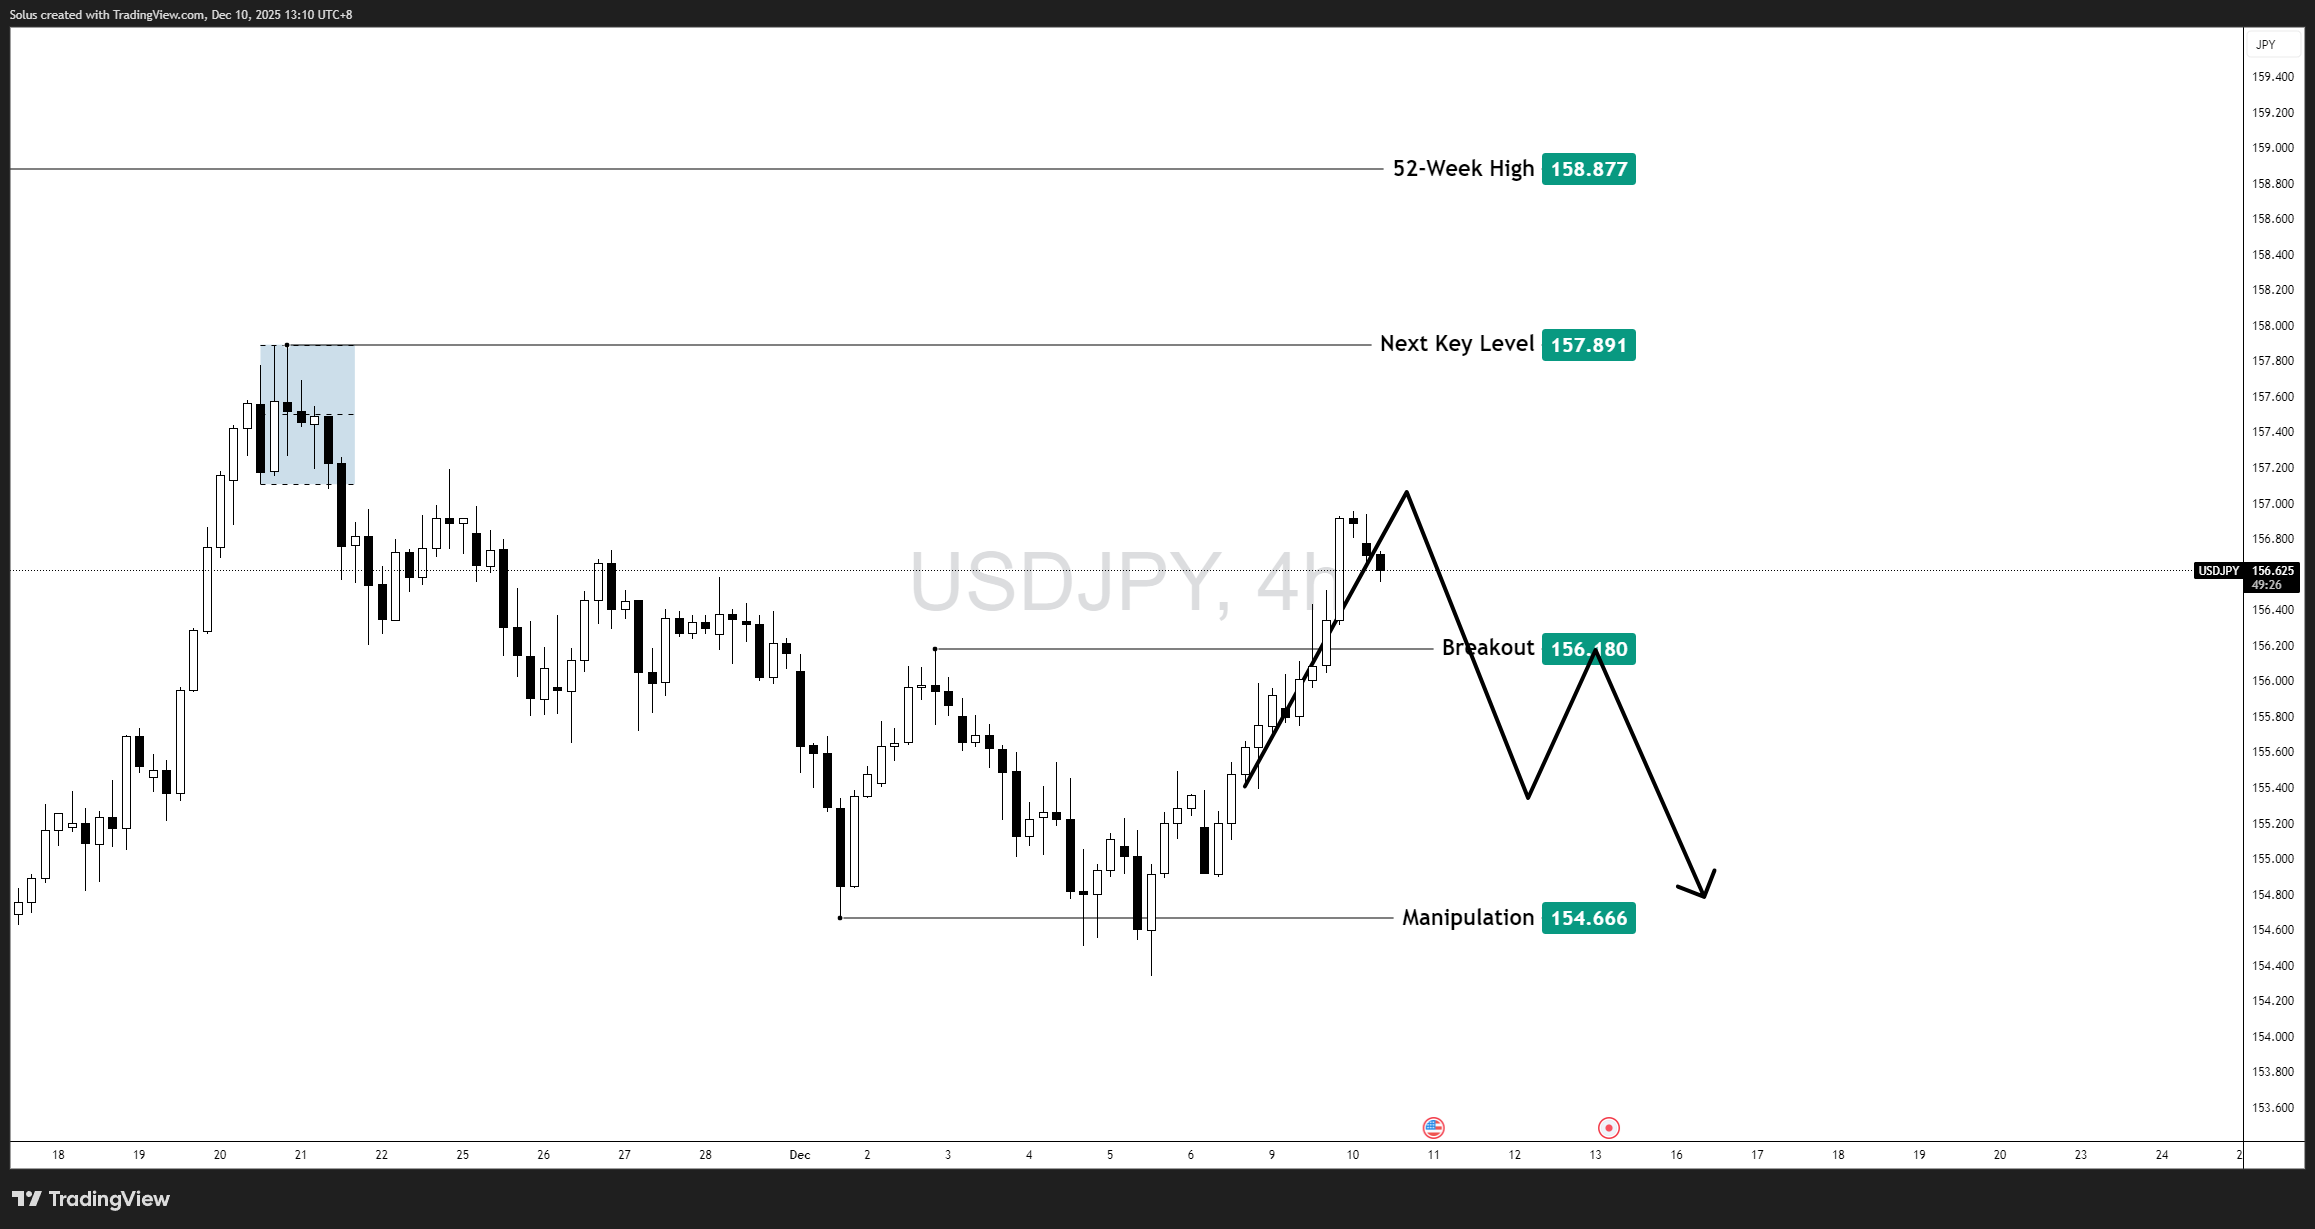
USD/JPY becomes vulnerable if:
- Price rejects 157.891
- Drops back below 156.18
- Breaks internal lows toward 155.00 – 154.66
Targets include:
- 155.50 inefficiency fill
- 154.666 manipulation zone (retest)
This path suggests risk-off sentiment or stronger Japanese commentary.
Final Thoughts
USD/JPY is now at a pivotal point.
The pair has the technical structure to retest its 52-week high — but it also sits close to levels where liquidity hunts often begin.
The next move will be decided at 156.18 and 157.89.
Hold above → bullish continuation
Break below → deeper corrective cycle
Until price resolves these levels, expect choppy, liquidity-driven moves ideal for tactical setups.
Start Trading Live!
- Trade forex, indices, gold, and more
- Access ACY, MT4, MT5, & Copy Trading Platforms
It’s time to go from theory to execution!
Create an Account. Start Your Live Trading Now!
Check Out My Contents:
Beginners Path
- Learn Trading From Scratch: Clean, Simple, Zero-Noise
- Introduction to Trading: What Beginners Must Understand
- Choosing Your Trading Market: Forex, Gold, or Indices
- Beginner Trading Strategy: How to Choose One Setup and Commit
- Minimalist Trading Indicators: The Only Tools Beginners Need
- Master Candlestick Entries: Reading Price Action at Key Levels
- Backtesting for Traders: How to Build Skill Fast
- Trading Risk Management: The Real Edge Behind Consistency
- Trading Psychology: How to Control Yourself in the Markets
- Daily Trading Routine: Build Consistency and Discipline Fast
- Scenario Planning: Expect Both Sides
- Beginner Trading Master Guide 2026: The Complete Roadmap to Consistency
Strategies That You Can Use
Looking for step-by-step approaches you can plug straight into the charts? Start here:
- How To Trade & Scalp Indices at the Open Using Smart Money Concepts (SMC)
- How to Trade Breakouts Effectively in Day Trading with Smart Money Concepts
- Complete Step-by-Step Guide to Day Trading Gold (XAU/USD) with Smart Money Concepts (SMC)
- The Power of Multi-Timeframe Analysis in Smart Money Concepts (SMC)
- Forex Trading Strategy for Beginners
- Mastering Candlestick Pattern Analysis with the SMC Strategy for Day Trading
- How to Use Fibonacci to Set Targets & Stops (Complete Guide)
- RSI Divergence Trading Strategy for Gold: How to Identify and Trade Trend Reversals
- Stochastics Trading Secrets: How to Time Entries in Trending Markets using Stochastics
- Gold Trading Stochastics Strategy: How to Trade Gold with 2R - 3R Targets
- RSI Hidden Divergence Explained: How to Spot Trend Continuations Like a Pro
- Moving Averages Trading Strategy Playbook
- Mastering Fibonacci Trading Psychology - Trusting the Levels, Managing the Mind
- Mastering Price Action at Key Levels - How to Spot, Trade, and Win at the Most Crucial Zones
- Mastering Retests: How to Enter with Confirmation After a Breakout
Indicators / Tools for Trading
Sharpen your edge with proven tools and frameworks:
- The Ultimate Guide to Risk Management in Trading - A Complete Compilation for 2026
- Moving Averages Trading Strategy Playbook
- How to Think Like a Price Action Trader
- Mastering Fibonacci Trading Psychology - Trusting the Levels, Managing the Mind
How To Trade News
News moves markets fast. Learn how to keep pace with SMC-based playbooks:
- Why Smart Money Concepts Work in News-Driven Markets - CPI, NFP, and More
- How to Trade NFP Using Smart Money Concepts (SMC) - A Proven Strategy for Forex Traders
- How to Trade CPI Like Smart Money - A Step-by-Step Guide Using SMC
- Learn to Trade News by Backtesting it with Forex Tester
Learn How to Trade US Indices
From NASDAQ opens to DAX trends, here’s how to approach indices like a pro:
- How to Start Trading Indices and Get into the Stock Market with Low Capital (2026 Guide)
- Best Indices to Trade for Day Traders | NASDAQ, S&P 500, DAX + Best Times to Trade Them
- How To Trade & Scalp Indices at the Open Using Smart Money Concepts (SMC)
- NAS100 - How to Trade the Nasdaq Like a Pro (Smart Money Edition)
How to Start Trading Gold
Gold remains one of the most traded assets - here’s how to approach it with confidence:
- How to Swing Trade Gold (XAU/USD) Using Smart Money Concepts: A Simple Guide for Traders
- Complete Step-by-Step Guide to Day Trading Gold (XAU/USD) with Smart Money Concepts (SMC)
- The Ultimate Guide to Backtesting and Trading Gold (XAU/USD) Using Smart Money Concepts (SMC)
- Why Gold Remains the Ultimate Security in a Shifting World
- How to Exit & Take Profits in Trading Gold Like a Pro: Using RSI, Range Breakdowns, and MAs as Your Confluence
- Backtest Gold using Forex Tester Online
How to Trade Japanese Candlesticks
Candlesticks are the building blocks of price action. Master the most powerful ones:
- Mastering the Top Japanese Candlesticks: The Top 5 Candlesticks To Trade + Top SMC Candlestick Pattern
- How to Trade Candlestick Patterns with High Probability: A Complete Guide for Beginners
- The Top Japanese Candlestick Guide: What is an Engulfing Pattern and How to Trade It?
- Piercing Pattern Candlestick Explained: How to Trade It - Step-By-Step Guide
- Morning & Evening Star Candlestick Patterns - How to Trade Market Reversals with Confidence
How to Start Day Trading
Ready to go intraday? Here’s how to build consistency step by step:
- 5 Steps to Start Day Trading: A Strategic Guide for Beginners
- 8 Steps How to Start Forex Day Trading in 2026: A Beginner’s Step-by-Step Guide
- 3 Steps to Build a Trading Routine for Consistency and Discipline - Day Trading Edition
- The Ultimate Guide to Understanding Market Trends and Price Action
- Trading with Momentum: The Best Trading Session to Trade Forex, Gold and Indices
Swing Trading 101
- Introduction to Swing Trading
- The Market Basics for Swing Trading
- Core Principles of Swing Trading
- The Technical Foundations Every Swing Trader Must Master
- Swing Trader’s Toolkit: Multi-Timeframe & Institutional Confluence
- The Psychology of Risk Management in Swing Trading
- Swing Trading Concepts To Know In Trading with Smart Money Concepts
- Becoming a Consistent Swing Trader: Trading Structure & Scaling Strategy
Learn how to navigate yourself in times of turmoil
Markets swing between calm and chaos. Learn to read risk-on vs risk-off like a pro:
- How to Identify Risk-On and Risk-Off Market Sentiment: A Complete Trader’s Guide
- How to Trade Risk-On and Risk-Off Sentiment - With Technical Confirmation
- The Ultimate Guide to Understanding Market Trends and Price Action
- Metals in Risk-On and Risk-Off Environments: How Sentiment Moves Gold and Commodities
Want to learn how to trade like the Smart Money?
Step inside the playbook of institutional traders with SMC concepts explained:
- Why Smart Money Concepts Work: The Truth Behind Liquidity and Price Action
- Mastering the Market with Smart Money Concepts: 5 Strategic Approaches
- Understanding Liquidity Sweep: How Smart Money Trades Liquidity Zones in Forex, Gold, US Indices
- The SMC Playbook Series Part 1: What Moves the Markets? Key Drivers Behind Forex, Gold & Stock Indices
- The SMC Playbook Series Part 2: How to Spot Liquidity Pools in Trading - Internal vs External Liquidity Explained
- Fair Value Gaps Explained: How Smart Money Leaves Footprints in the Market
- Accumulation, Manipulation, Distribution: The Hidden Cycle That Runs Every Market
- Institutional Order Flow - Reading the Market Through the Eyes of the Big Players
- London Session Trading Secrets: How Smart Money Sets the High & Low of the Day
- Mastering the New York Session - Smart Money Concepts Guide
- Anatomy of a Perfect Execution: How SMC Traders Trade with Precision
- Step-by-Step Trading Confirmation Guide for Precise Execution
- Execution Psychology: Turning Hesitation into Confidence
- What Is an Order Block? The Institutional Footprint Explained
- Anatomy of a Valid Order Block in Smart Money Concepts
- How to Draw Order Blocks Accurately - Day Trading Style
- Order Blocks and AMD Market Structure (Smart Money Concepts)
- The Confirmation Model: OB + FVG + Liquidity Sweep (Smart Money Concepts)
Master the World’s Most Popular Forex Pairs
Forex pairs aren’t created equal - some are stable, some are volatile, others tied to commodities or sessions.
- The Top 5 All-Time Best Forex Pairs to Trade
- Top Forex Pairs Beyond the Big Five
- EUR/USD: The King of Forex
- USD/JPY: The Fast Mover
- GBP/USD: The Volatile Cable
- AUD/USD: The Commodity Currency
- USD/CAD: The Oil-Backed Pair
- GBP/JPY: How to Trade The Beast
- Asian & London Session Secrets
- Mastering the New York Session
Metals Trading
- Metals Trading: Why Gold and Metals Are Rising Again
- Silver Trading: The Underdog with Dual Identity
- Gold vs Silver: Institutional Demand Breakdown Explained
- How to Day Trade Silver Like a Pro: Smart Money Tactics for XAG/USD
- Platinum & Palladium: The Quiet Power Duo of Industrial Metals
- How to Trade Metals with SMC and Fundamentals - Gold Trading Strategy
- Metals in Risk-On and Risk-Off Environments: How Sentiment Moves Gold and Commodities
- Future of Metals Market: Gold Forecast 2026 & Long-Term Commodities Outlook
Stop Hunting 101
If you’ve ever been stopped out right before the market reverses - this is why:
- Stop Hunting 101: How Swing Highs and Lows Become Liquidity Traps
- Outsmarting Stop Hunts: The Psychology Behind the Trap
- How to Lessen Risk From Stop Hunts in Trading
- How Stop Hunts Trigger Revenge Trading - Breaking the Pain Cycle
- How to Accept Stop Hunts Without Losing Discipline - Shifting From Frustration to Focus
Trading Psychology
Mindset is the deciding factor between growth and blowups. Explore these essentials:
- The Mental Game of Execution - Debunking the Common Trading Psychology
- Managing Trading Losses: Why You Can Be Wrong and Still Win Big in Trading
- The Hidden Threat in Trading: How Performance Anxiety Sabotages Your Edge
- Why 90% of Retail Traders Fail Even with Profitable Trading Strategies
- Top 10 Habits Profitable Traders Follow Daily to Stay Consistent
- Top 10 Trading Rules of the Most Successful Traders
- Top 10 Ways to Prevent Emotional Trading and Stay Disciplined in the Markets
- Why Most Traders Fail - Trading Psychology & The Hidden Mental Game
- Emotional Awareness in Trading - Naming Your Triggers
- Discipline vs. Impulse in Trading - Step-by Step Guide How to Build Control
- Trading Journal & Reflection - The Trader’s Mirror
- Overcoming FOMO & Revenge Trading in Forex - Why Patience Pays
- Risk of Ruin in Trading - Respect the Math of Survival
- Identity-Based Trading: Become Your Trading System for Consistency
- Trading Psychology: Aligning Emotions with Your System
- Mastering Fear in Trading: Turn Doubt into a Protective Signal
- Mastering Greed in Trading: Turn Ambition into Controlled Growth
- Mastering Boredom in Trading: From Restless Clicking to Patient Precision
- Mastering Doubt in Trading: Building Confidence Through Backtesting and Pattern Recognition
- Mastering Impatience in Trading: Turn Patience Into Profit
- Mastering Frustration in Trading: Turning Losses Into Lessons
- Mastering Hope in Trading: Replacing Denial With Discipline
- When to Quit on Trading - Read This!
- The Math of Compounding in Trading
- Why Daily Wins Matter More Than Big Wins
- Scaling in Trading: When & How to Increase Lot Sizes
- Why Patience in Trading Fuels the Compounding Growth
- Step-by-Step Guide on How to Manage Losses for Compounding Growth
- The Daily Habits of Profitable Traders: Building Your Compounding Routine
- Trading Edge: Definition, Misconceptions & Casino Analogy
- Finding Your Edge: From Chaos to Clarity
- Proving Your Edge: Backtesting Without Bias
- Forward Testing in Trading: How to Prove Your Edge Live
- Measuring Your Edge: Metrics That Matter
- Refining Your Edge: Iteration Without Overfitting
- The EDGE Framework: Knowing When and How to Evolve as a Trader
- Scaling Your Edge: From Small Account to Consistency
- Trading in the Zone: Execution Through Habit and Structure
- Trading in the Zone: Thinking in Probabilities
- The Inner War: Fear, Greed, and the Illusion of Control
- Detachment Discipline in Trading: How to Let Go of the Need to Be Right
- Trading Hack: Why You Keep Breaking Your Own Rules (And How to Stop)
- Trading Mindset Mastery: Building Confidence Through Data
- Flow State Trading: Entering the Zone Through Structure
- Cognitive Traps in Trading: Overconfidence, Recency Bias & Revenge Trades
- The Psychology of Risk in Trading: Fear of Loss vs Fear of Missing Out
- Self-Trust in Trading – Building Confidence from Repetition, Not Just Results
- The Zen of Trading: Becoming the Observer, Not the Reactor
- The Market Is Always Right: Why You Must Adapt, Not Demand
- The Three Stages to Becoming a Consistent Trader
- The Enemy Within: Limiting Beliefs and Emotional Conflict in Trading
- Self-Discipline in Trading: A Skill, Not a Personality Trait
- Mental Energy Management in Trading: Controlling Impulse, Stress, and Overwhelm
- Creating the Disciplined Trader Identity
- The Disciplined Trader: The Complete Blueprint for Consistency
Market Drivers
- Central Banks and Interest Rates: How They Move Your Trades
- Inflation & Economic Data: CPI Trading Strategy and PPI Indicator Guide
- Geopolitical Risks & Safe Havens in Trading (Gold, USD, JPY, CHF)
- Jobs, Growth & Recession Fears: NFP, GDP & Unemployment in Trading
- Commodities & Global Trade: Oil, Gold, and Forex Explained
- Market Correlations & Intermarket Analysis for Traders
Risk Management
The real edge in trading isn’t strategy - it’s how you protect your capital:
- Mastering Risk Management: Stop Loss, Take Profit, and Position Sizing
- Why Risk Management Is the Only Edge That Lasts
- How Much Should You Risk per Trade? (1%, 2%, or Less?)
- The Ultimate Risk Management Plan for Prop Firm Traders - Updated 2026
- Mastering Position Sizing: Automate or Calculate Your Risk Like a Pro
- Martingale Strategy in Trading: Compounding Power or Double-Edged Sword?
- How to Add to Winners Using Cost Averaging and Martingale Principle with Price Confirmation
- Managing Imperfect Entries in Trading - How Professionals Stay Composed
Suggested Learning Path
If you’re not sure where to start, follow this roadmap:
- Start with Trading Psychology → Build the mindset first.
- Move into Risk Management → Learn how to protect capital.
- Explore Strategies & Tools → Candlesticks, Fibonacci, MAs, Indicators.
- Apply to Assets → Gold, Indices, Forex sessions.
- Advance to Smart Money Concepts (SMC) → Learn how institutions trade.
- Specialize → Stop Hunts, News Trading, Turmoil Navigation.
This way, you’ll grow from foundation → application → mastery, instead of jumping around randomly.
Follow me for more daily market insights!
Jasper Osita - LinkedIn - FXStreet - YouTube
This content may have been written by a third party. ACY makes no representation or warranty and assumes no liability as to the accuracy or completeness of the information provided, nor any loss arising from any investment based on a recommendation, forecast or other information supplies by any third-party. This content is information only, and does not constitute financial, investment or other advice on which you can rely.

