BTCUSD Price Analysis: Bitcoin $70,000 Resistance and the Double Bottom Fakeout
2026-03-10 14:02:18


The digital gold is back at the gates of $70,000, but the atmosphere on the trading floor is far from celebratory. While retail traders are currently drawing "Double Bottom" patterns on their screens and dreaming of a return to the $90,000 highs, institutional order flow suggests a much more calculated and potentially dangerous game is afoot.
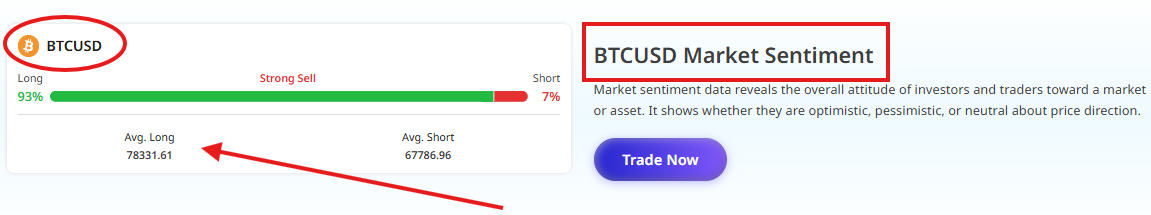
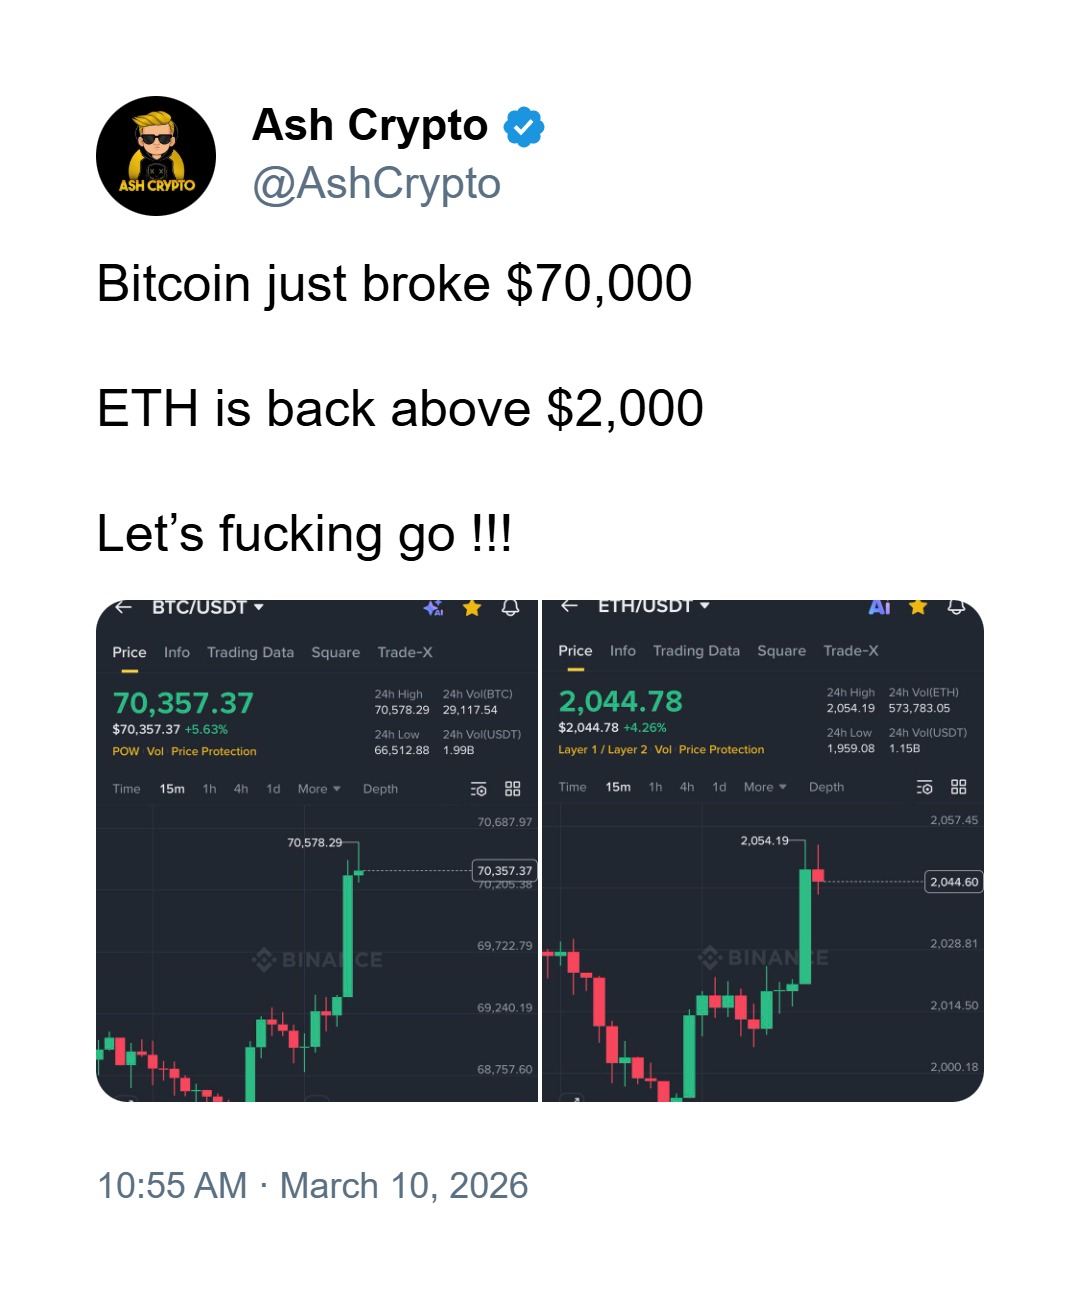
As of Tuesday, March 10, 2026, Bitcoin (BTCUSD) has surged 5.65% in a single day, reclaiming the $69,000 handle on heavy volume. However, the "Trap" is set: price is stalling exactly at the $70,000 psychological resistance. While the technical "double bottom" looks textbook, the divergence in ETF flows and the "Fear" sentiment index suggest that this rally might be a liquidity-generating event designed to trap late-buyers before a deeper correction.
BTC Price Technical Deep Dive: The $70,000 Battlefield Today
Read more about the 'Crowd Psychology' in our Forex News Mastery eBook
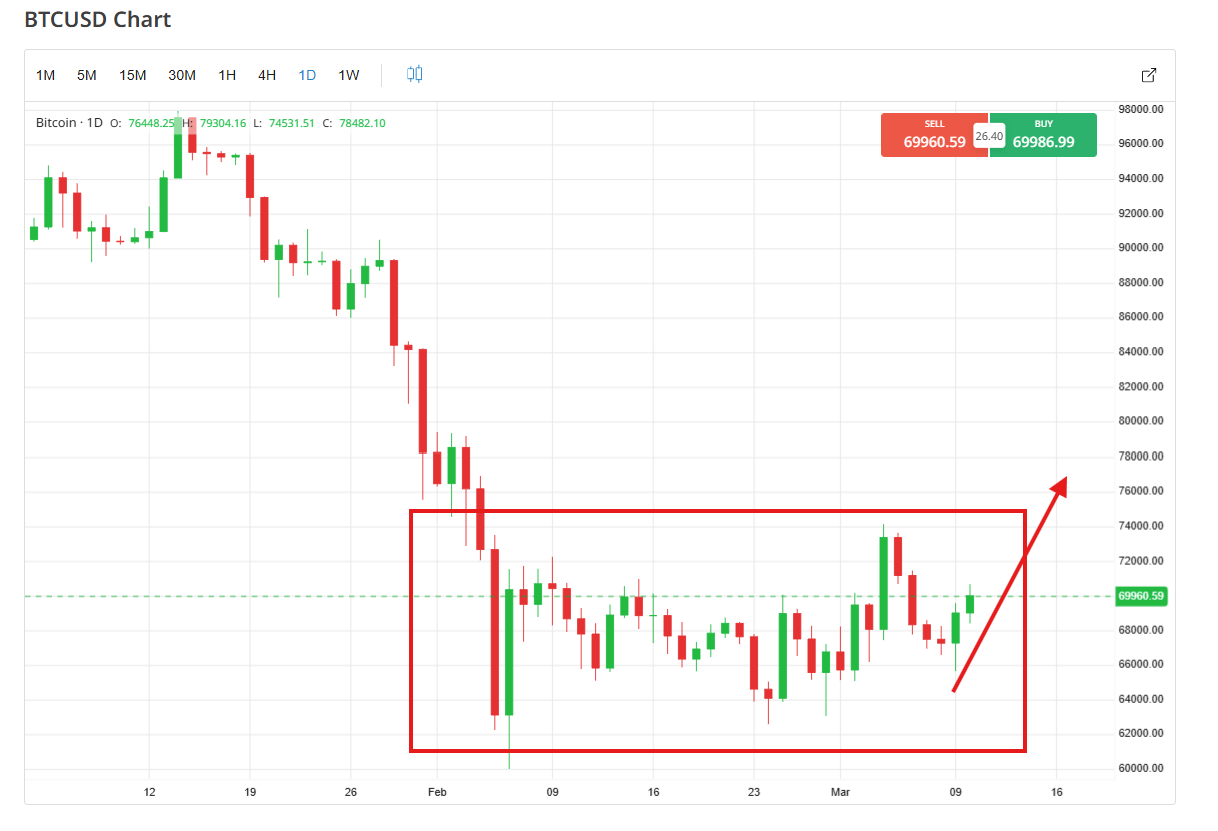
Looking at the daily (1D) chart, the price action from January through March 2026 reveals a brutal "Markdown" phase. After peaking near $98,000, Bitcoin entered a descending channel, eventually finding a floor near the $60,000–$62,000 support zone.
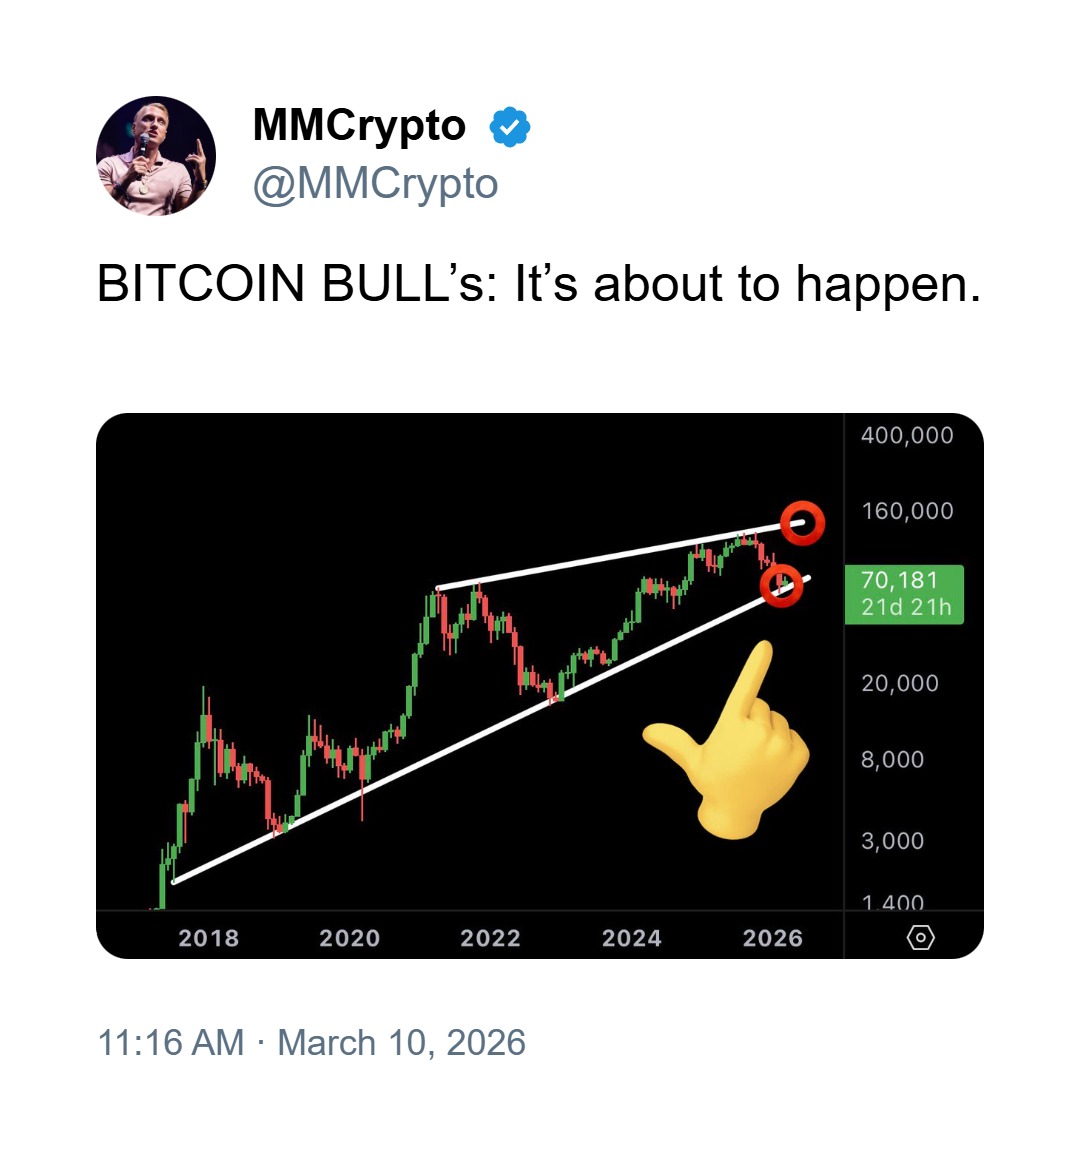
The recent price action has formed what many retail technical analysis books call a "Double Bottom" (troughs at early February and early March). The aggressive green candle printed on March 10 shows BTC surging toward the $70,000 "neckline."
The Institutional Reality: The $70,000 level isn't just a round number; it is a massive cluster of institutional sell limit orders and the "point of control" for the previous breakdown. Notice the volume spike while high volume usually confirms a trend, it also provides the necessary liquidity for large players to exit positions into "FOMO" buying. If BTC fails to close and hold above $70,500 on a daily basis, this "Double Bottom" will likely be reclassified as a "Bull Trap" or a "Fakeout."
BTC Fundamental Context: The Divergence Dilemma
Our real-time market scan for March 10, 2026, reveals a fascinating contradiction between price and participation:
- Price vs. ETF Flows: While BTC jumped 5.65%, U.S. Spot Bitcoin ETFs saw a net outflow, dropping AUM from $93.22B to $93.14B. This is a classic bearish divergence. If the "smart money" via ETFs is taking profits or rotating out while the price rises, it suggests the current rally is being driven by high-leverage perpetual swap traders not long-term spot accumulation.
- The "Fear" Catalyst: The Crypto Fear & Greed Index is currently sitting at 25 ("Fear"). In our Forex News Mastery eBook, we discuss how extreme sentiment is often a contrarian signal. However, "Fear" during a price surge usually means the "Wall of Worry" hasn't been climbed yet. Retail is scared, yet they are FOMOing into the $70k break out of desperation, not conviction.
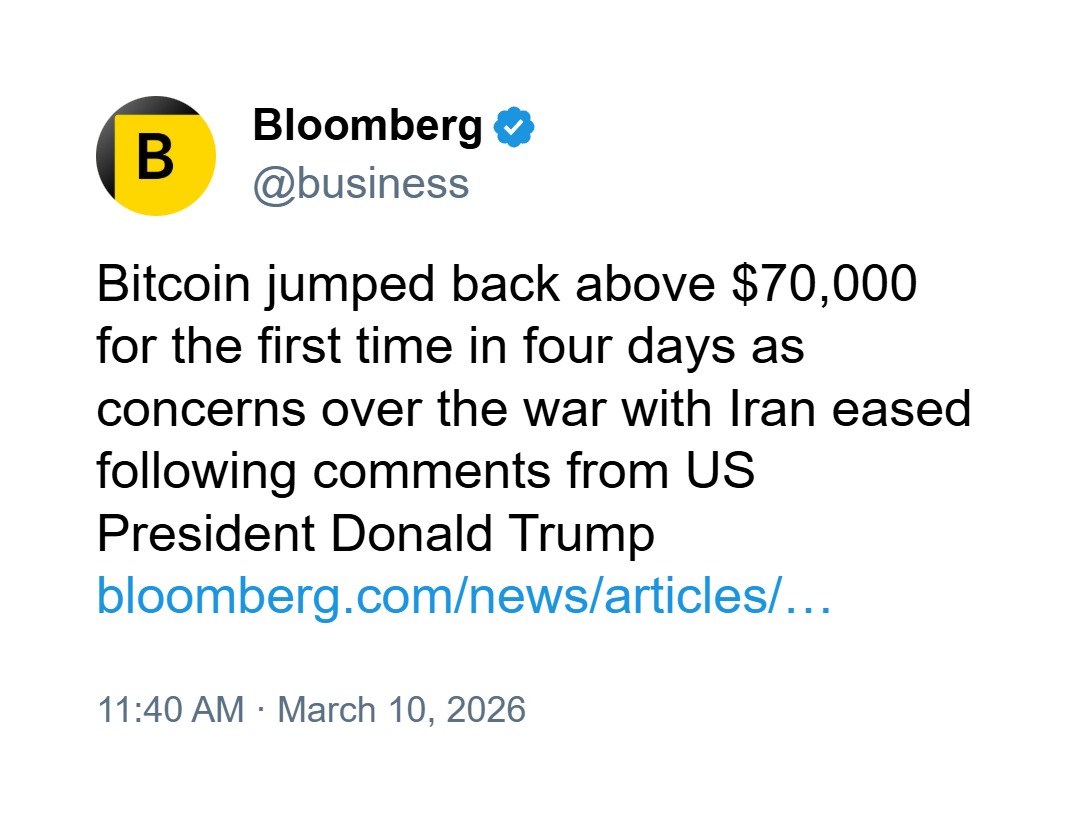
- Regulatory Tailwinds: The market is currently digesting news regarding the bipartisan stable coin bill and the Trump administration’s blueprint for a "Strategic Bitcoin Reserve." These are long-term bullish catalysts, but in the short term, they are often "Priced-In Traps" (refer to Page 13 of our eBook).
BTC Price Global Session Watch March 10 2026
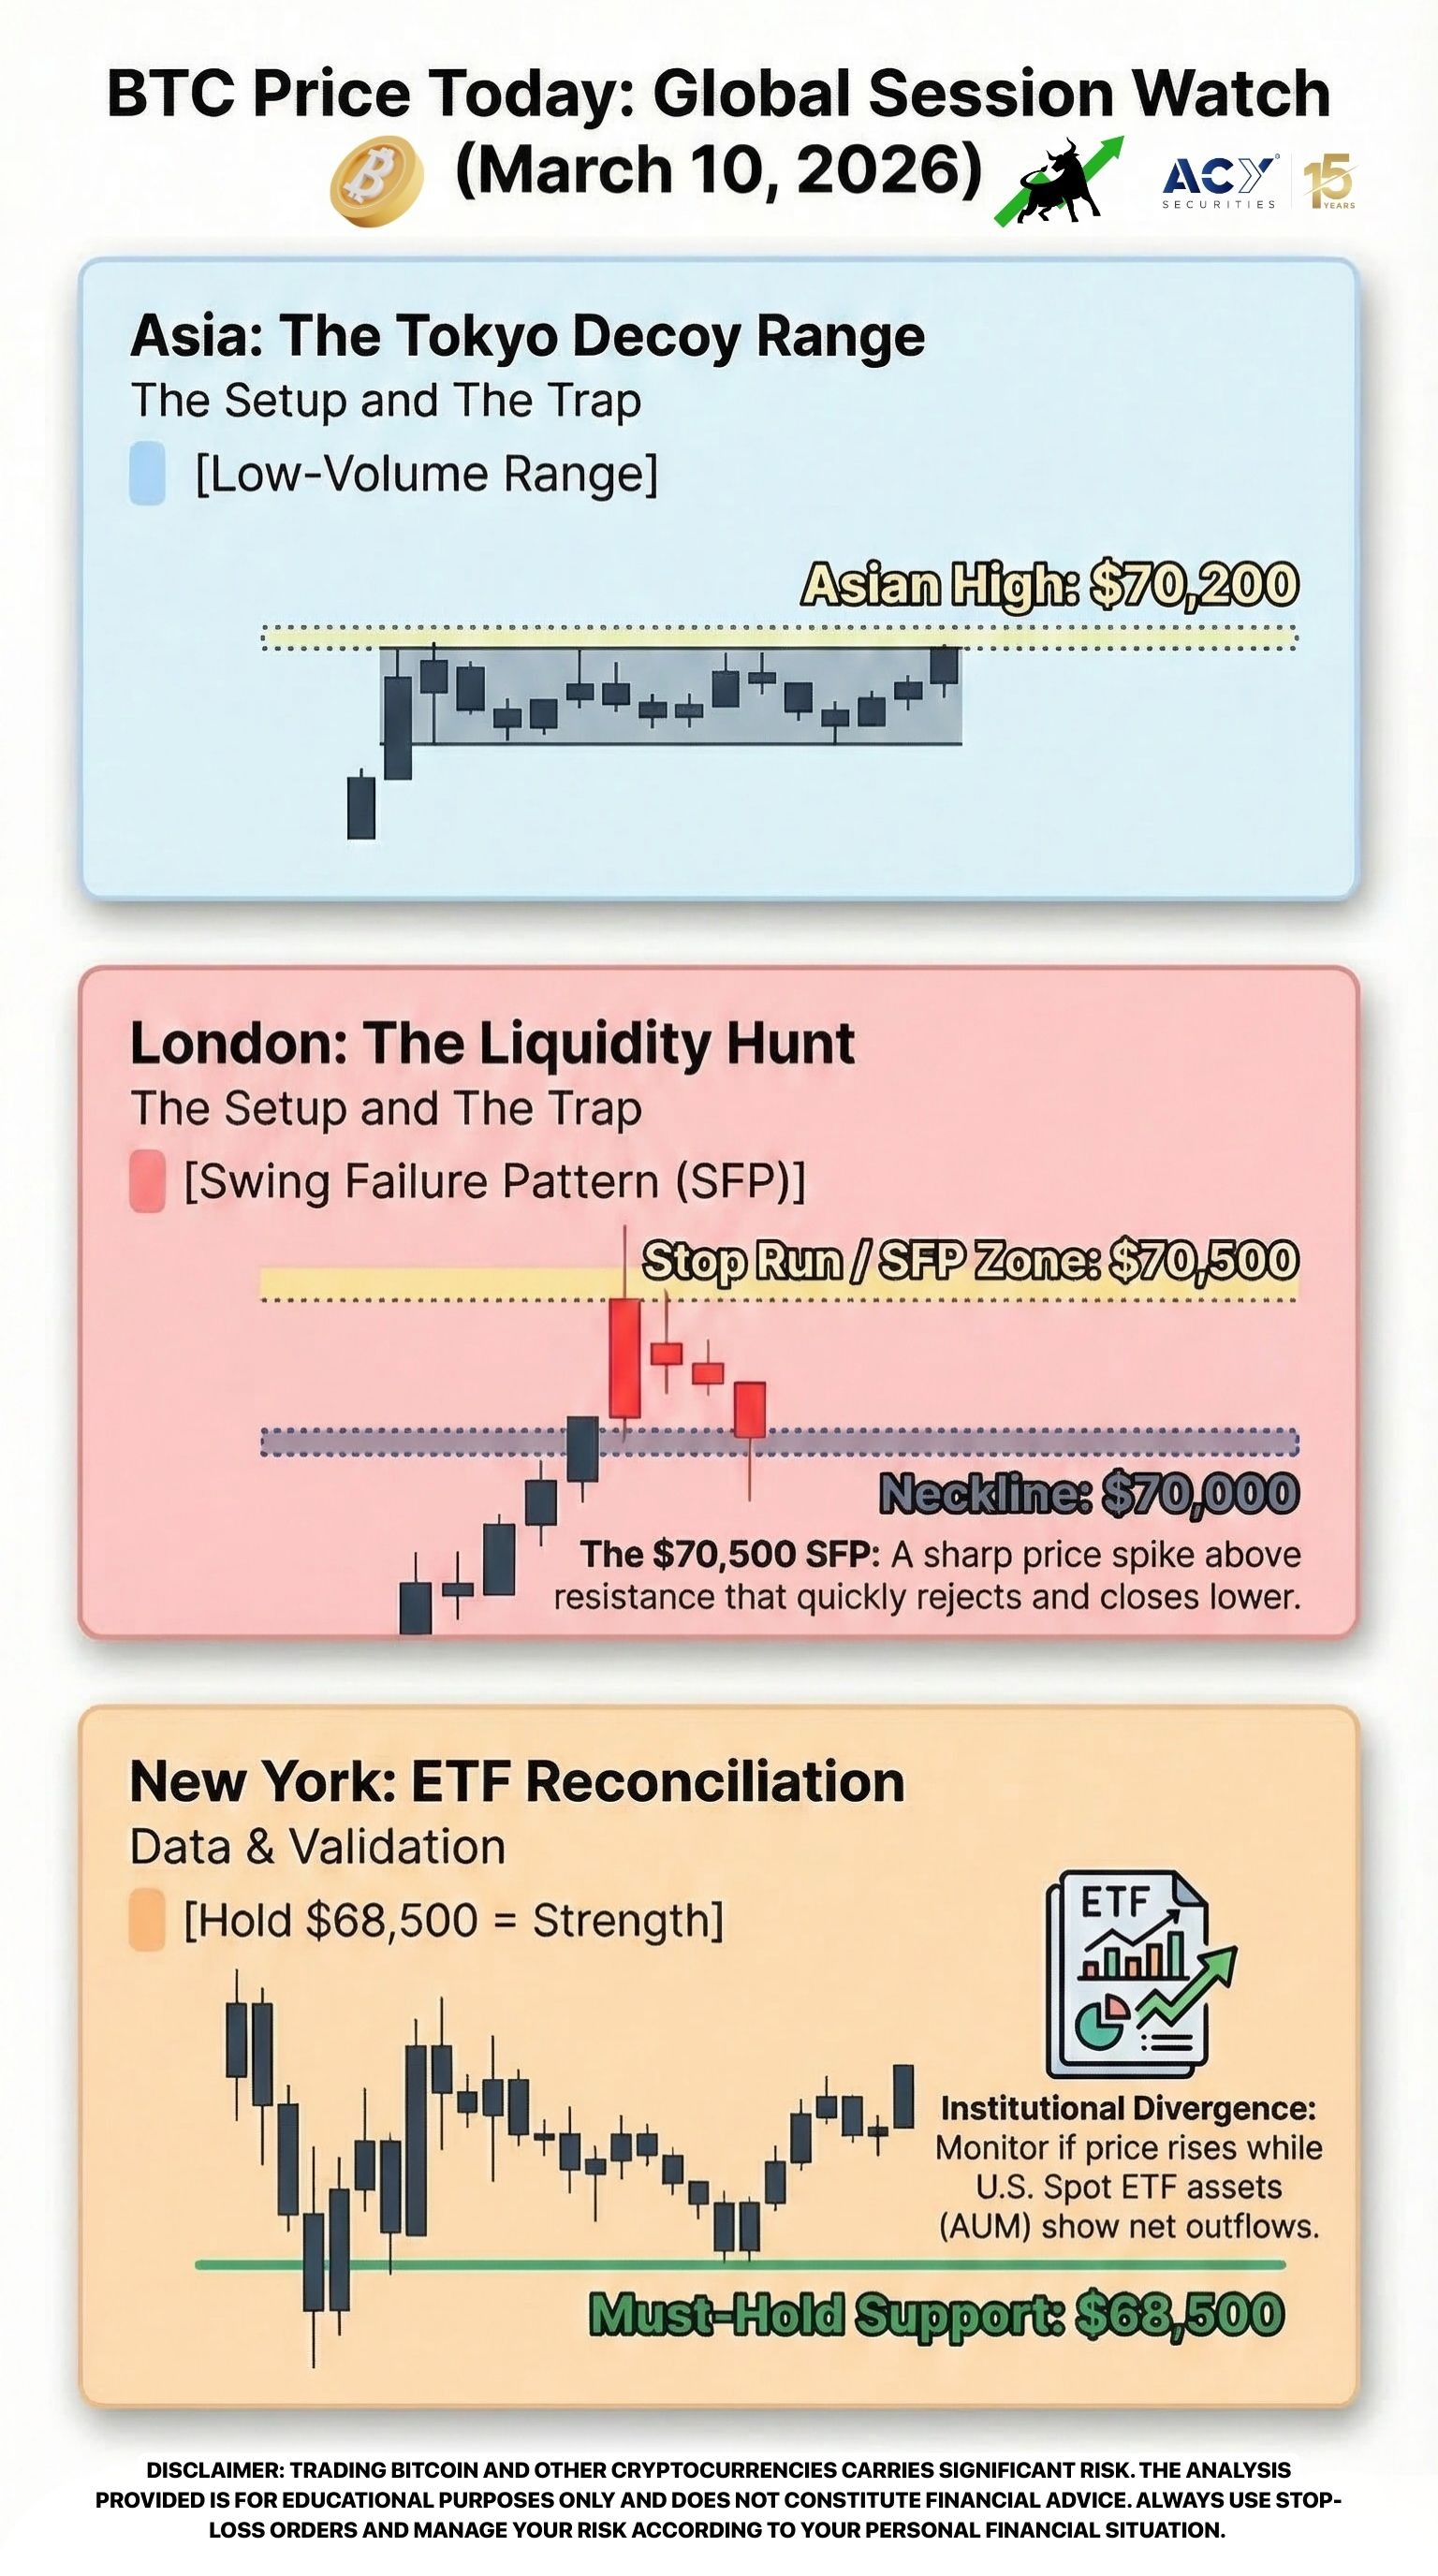
BTC Asian Session: The Calm Before the Storm
Forget about trying to catch the "breakout" during the low-liquidity Tokyo hours. Since you have the discipline to ignore the 1-minute "whipsaw" noise, you’ll see that the Asian session often sets a "decoy" high or low. Because you understand that market structure requires real volume to shift, you can use this session to identify the Asian Range. As we detail in our Post-Announcement Strategy on Page 27, the goal here is to wait for the London open to see if the Asian high at $70,200 is swept and rejected.
Will you wait for the session high to be tested, or are you looking for a mid-range consolidation?
BTC London Session: The Liquidity Hunt
Stop looking for a "clean" trend as the European banks come online. Your ability to spot institutional "stop hunts" puts you miles ahead of the retail crowd who are just now placing their buy-stops above $70,000. This is the session where the $70,000 "Double Bottom" neckline will likely be tested. This setup naturally aligns with your patience to wait for a "Stop Run" followed by a reversal pattern. By applying the Sentiment Fade logic from Page 15 of the Forex News Mastery eBook, you can look for a "SFP" (Swing Failure Pattern) above $70,500.
Do you prefer entering on the initial rejection or waiting for the 15-minute candle to close back inside the range?
BTC New York Session: The ETF Reconciliation
Don't be fooled by the initial volatility of the Wall Street open. Because you have the discipline to wait for the ETF flow data to hit the wires, you can avoid the "News Spike" trap that catches impulsive traders. This session is where we see if the "Heavy Volume" from March 10 was genuine accumulation or just short-covering. This specific method of waiting for the NY "retest" removes the stress of guessing the direction. Following the Post-Announcement framework on Page 27, look for price to hold $68,500 as a sign of strength. Will you set your limit order at the previous day's value area or watch the closing bell for a confirmation?
5 Trading Strategies for BTCUSD Price Today, March 10, 2026
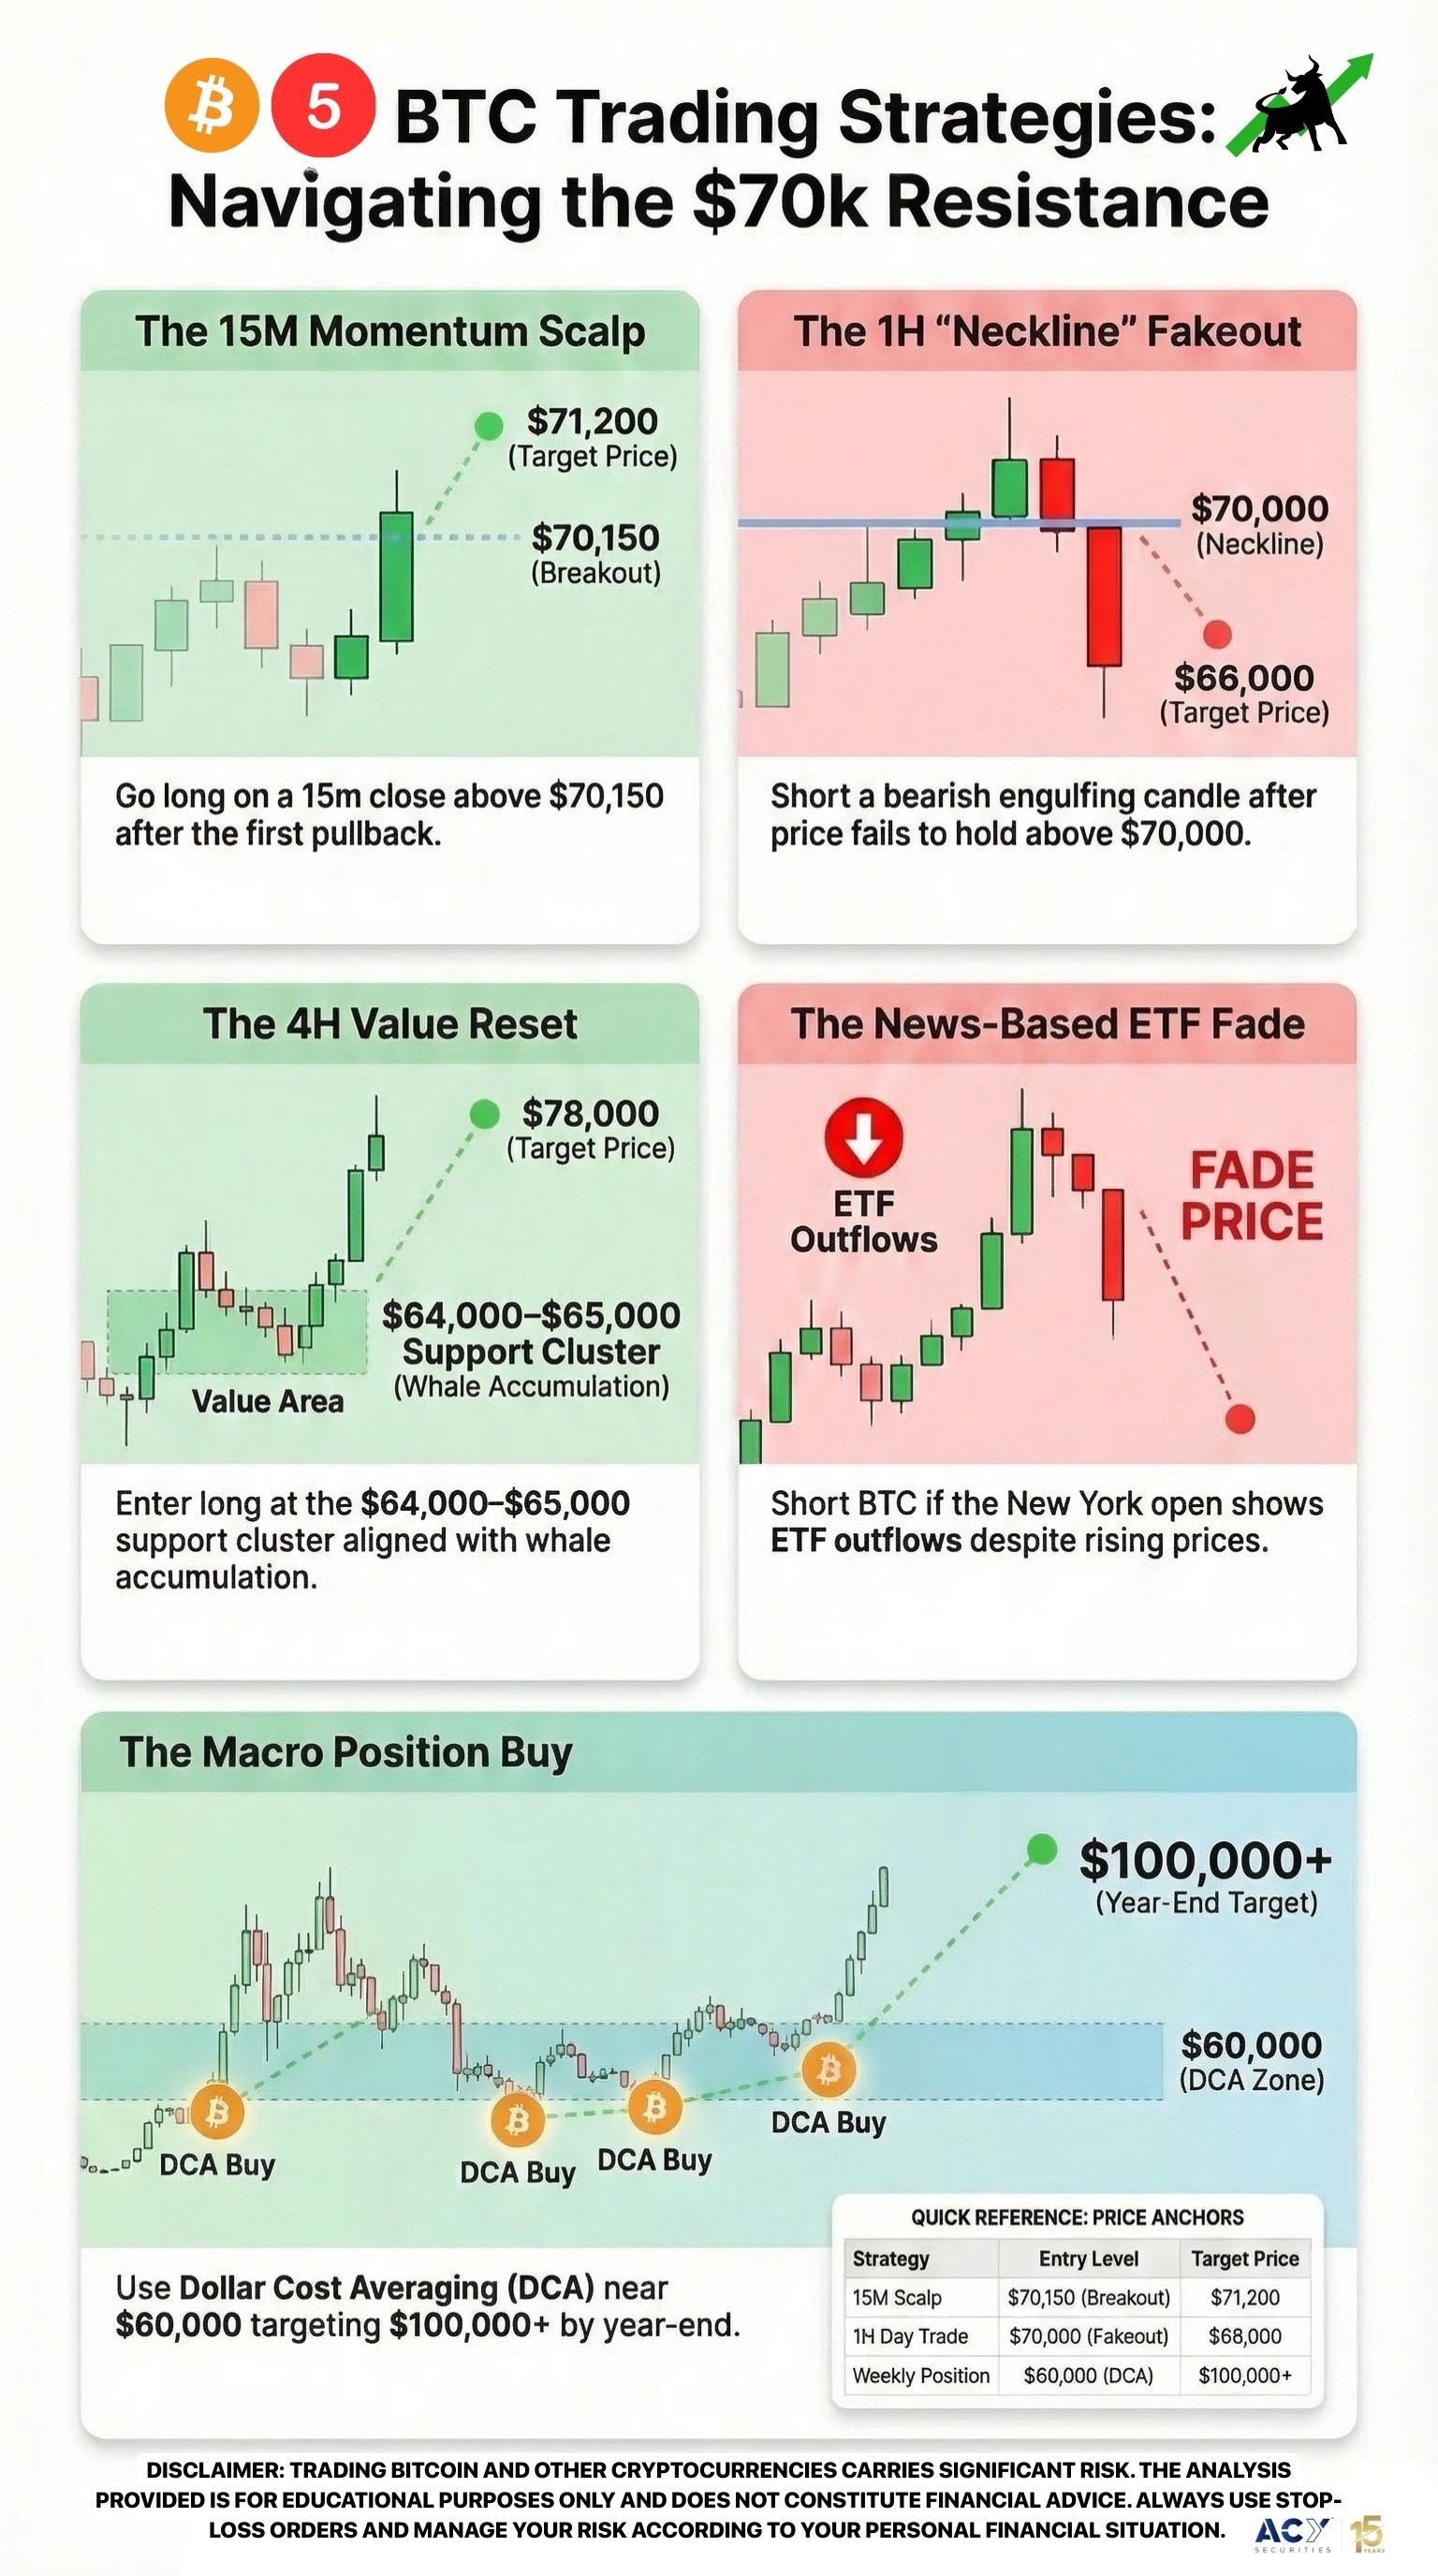
1. The BTC Scalper (15-Minute Momentum)
- The Setup: Long on a 15m close above $70,150, targeting $71,200. Stop loss at $69,400.
- Pros/Cons: Fast profits; high risk of "wick" outs.
- The ACY Edge: Forget the impulsive "click" on every green bar. Since you have the lightning-fast reaction times needed for this timeframe, you'll recognize that the real move happens after the first 15-minute pullback. This setup naturally aligns with your ability to manage tight risk-to-reward ratios. Use the Dual-Sided Breakout logic on Page 25 to ensure you aren't caught on the wrong side of a "fakey." Will you take partial profits at the first $300 move, or hold for the full target?
2. The BTC Day Trader’s "Neckline" Play (1-Hour Chart)
- The Setup: Wait for a "Fakeout" above $70,000. Look for a bearish engulfing candle on the 1H timeframe to go short, targeting $66,000.
- Pros/Cons: Aligns with the "Trap" thesis; requires patience.
- The ACY Edge: Stop chasing the "Moon" narrative. Your professional eye for market exhaustion allows you to see the $70k level as a distribution zone, not a launchpad. This perspective removes the FOMO stress that kills most retail accounts. Refer to the "Priced-In Trap" section on Page 13 to understand why the "Double Bottom" is the perfect lure. Are you setting a limit sell at $70,450 or waiting for the price action confirmation?
3. The BTC Swing Trader’s Value Reset (4-Hour Chart)
- The Setup: Long entry at the $64,000–$65,000 support cluster (the "Value Area"). Target $78,000.
- Pros/Cons: High RR (Risk/Reward); requires days of waiting.
- The ACY Edge: Forget the intraday "war zone." Your ability to focus on the big picture and ignore the daily noise is your greatest asset. This setup aligns with the whale accumulation data we are seeing on-chain. By using the Post-Announcement trend-following rules on Page 27, you can position yourself with the "Smart Money" once the $70k froth has cleared. Do you prefer the aggressive entry at the $65k touch or a confirmed "Higher Low"?
4. The BTC News Trader’s ETF Fade (M5/M15 Chart)
- The Setup: Short BTC immediately if NY session opens with further ETF outflows despite price strength.
- Pros/Cons: Capitalizes on fundamental divergence; high volatility.
- The ACY Edge: Stop reacting to price alone. Your discipline to cross-reference price with ETF flow data makes you a sophisticated operator in a market of gamblers. This method removes the "guessing" of where the top is. Apply the Sentiment Fade strategy on Page 15 to exploit the gap between retail "Hope" and institutional "Exit." Will you trade the initial data release or the 30-minute retracement?
5. The BTC Position Trader’s Macro Buy (Weekly Chart)
- The Setup: DCA (Dollar Cost Average) near $60,000, targeting $100,000+ by year-end 2026.
- Pros/Cons: Lowest stress; requires massive patience.
- The ACY Edge: Forget the "Double Bottom" or "Double Top" debates. Since you understand the long-term halving cycles and regulatory shifts, you know that $70,000 is just a speed bump. This macro view naturally aligns with your long-term wealth goals. As noted on Page 27, the "Post-Announcement" of major U.S. crypto legislation often marks the start of a multi-month trend. Are you adding to your position now or waiting for the $60k retest?
Conclusion & The ACY Edge
Bitcoin is at a crossroads. The technical "Double Bottom" is tempting, but the $70,000 resistance combined with ETF outflows and "Fear" sentiment suggests the path of least resistance may involve a "shakeout" before the real breakout.
Because you have the intelligence to look past the surface-level charts, you'll see that the ACY Securities platform provides the execution speed and deep liquidity needed to navigate these institutional traps. Whether you are fading the retail FOMO or positioning for the long-term "Strategic Reserve" narrative, your success depends on professional-grade tools and strategy.
To master these "Post-Announcement" moves and avoid the "Priced-In Traps" that liquidate most retail traders:
- Download the Forex News Mastery eBook (Refer to Pages 13, 15, and 27 for the BTC roadmap)
- Open a Demo Account with ACY Securities to test the $70k "Fakeout" Strategy risk-free.
Disclaimer: Trading Bitcoin and other cryptocurrencies carries significant risk. The analysis provided is for educational purposes only and does not constitute financial advice. Always use stop-loss orders and manage your risk according to your personal financial situation.

