How Do MT4 & MT5 Indicators and Scripts Actually Calculate Their Data?
2025-09-12 15:55:37


Last Updated: September 12, 2025
This article is reviewed annually to reflect the latest market regulations and trends
TL;DR (Too Long; Didn’t Read)
- Indicators are Calculators, Not Crystal Balls: Every indicator, from a Simple Moving Average to RSI, is a mathematical formula based on past price (OHLC) and volume data. They are inherently lagging and do not predict the future.
- MT5 is Technologically Superior: While MT4 has a vast legacy library, MT5 is a 64-bit, multi-threaded platform with a faster backtesting engine and a more powerful MQL5 language, making it the clear choice for serious quantitative development.
- Data Quality is Everything: The accuracy of your indicators is directly tied to the quality of your broker's data feed. "Garbage in, garbage out" is the rule, as bad ticks or data variations can create false signals.
- Process Over Prediction: Profitable trading isn't about finding the "holy grail" indicator. It's about building a robust trading system with defined rules for entry, exit, and risk management, using indicators as tools for confirmation, not commands.
- Beware of "Repainting" Indicators: Many commercial indicators are scams designed to look perfect in hindsight by altering their past signals. Always verify a new tool using the Strategy Tester in "Visual Mode" to avoid these traps.
How to install Metatrader Scripts in your MT4 Trading Platform
"The market is a device for transferring money from the impatient to the patient." - Warren Buffett
How Do MT4 & MT5 Indicators and Scripts Actually Calculate: Your Indicators Are Lying to You (But Not How You Think)
You see a perfect "BUY" arrow on your chart, right at the bottom of a massive uptrend. You see a moving average crossover that, in hindsight, would have netted you hundreds of pips. It feels like the market is leaving a trail of breadcrumbs, and if you could just find the right indicator, you could follow it to consistent profits.
But what if that trail is an illusion?
The hard truth is that most traders use indicators without ever understanding what’s happening under the hood. They are driving a high-performance vehicle by only looking in the rearview mirror. This article lifts the hood. We will dismantle the engine of technical analysis, revealing exactly how MT4 and MT5 indicators and scripts calculate their data. You will learn not just what they do, but why they do it, and more importantly, how to use them as the powerful,but flawed,tools they truly are.
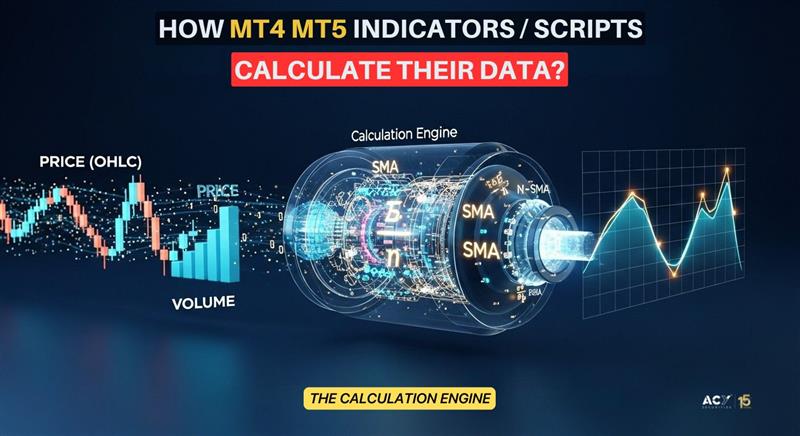
What Are Technical Indicators and Why Do They Matter?
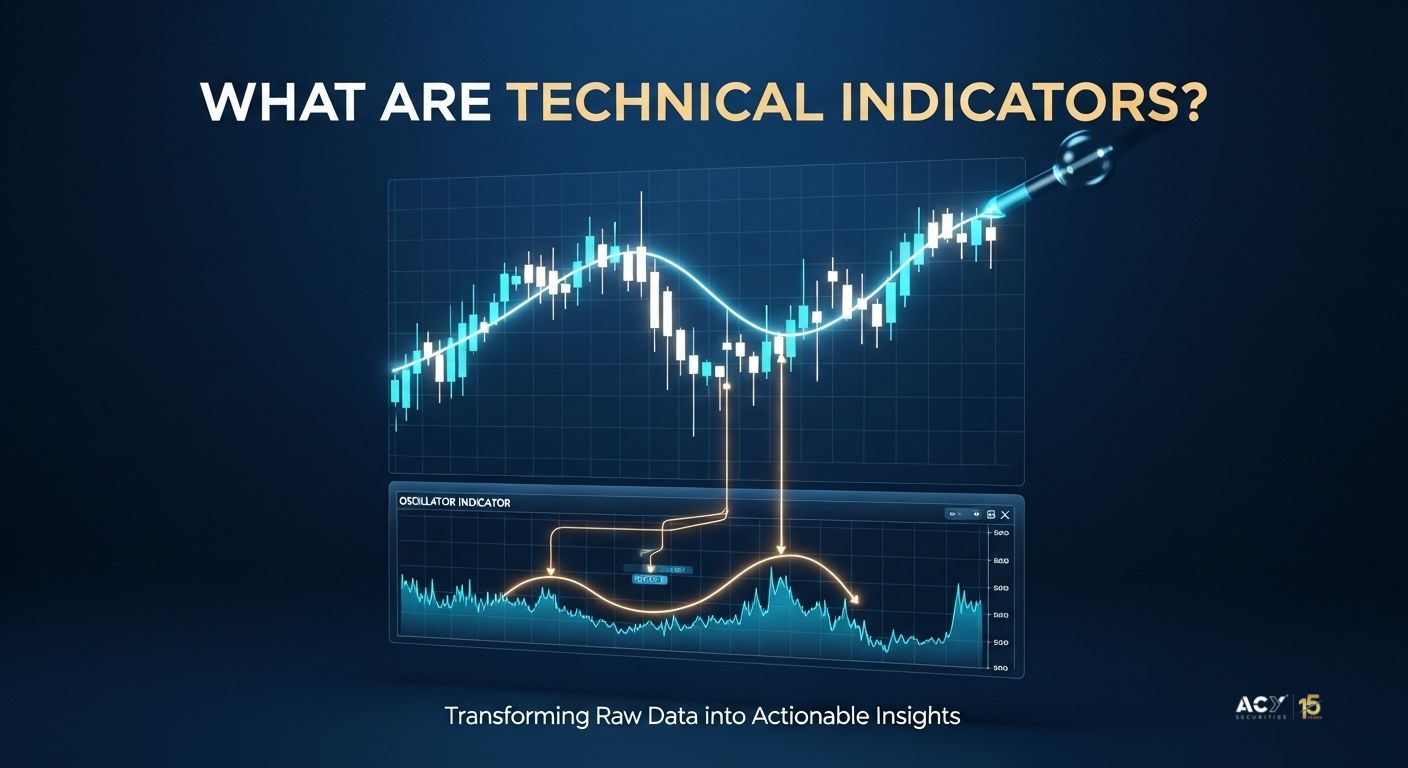
At their core, technical indicators are mathematical tools that transform raw market data into actionable insights. They are not predictive instruments but rather complex calculators that apply formulas to historical price series (Open, High, Low, Close) and volume. Their primary role is to help traders:
- Identify and confirm trends.
- Measure market momentum and volatility.
- Pinpoint strategic entry and exit points.
Indicators are broadly categorized into two types: overlays, like Moving Averages or Bollinger Bands, which are plotted directly over the price on a chart, and oscillators, like the Relative Strength Index (RSI) or MACD, which are displayed in a separate window below the price chart.
MT4 vs. MT5: Which Platform Is Right for Your Indicator Strategy?
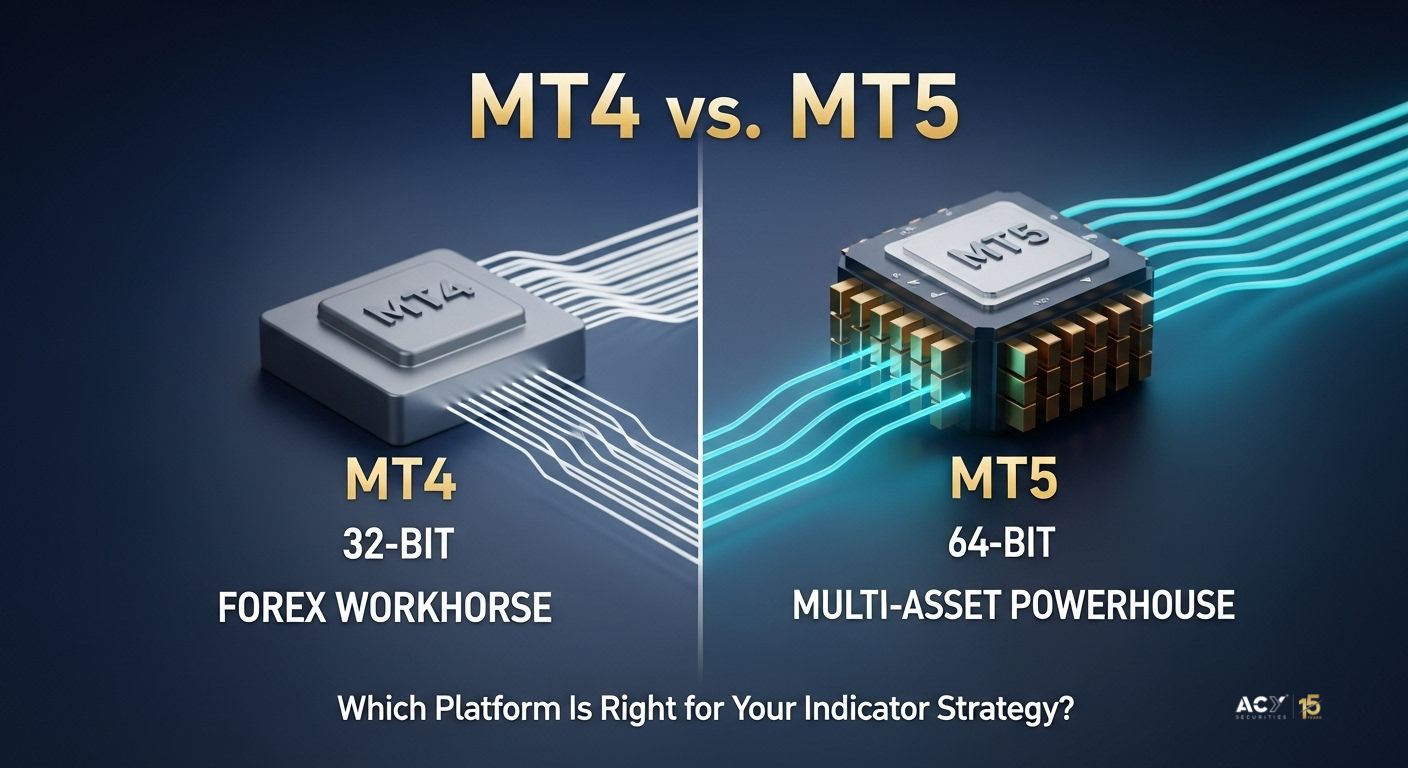
The choice between MetaTrader 4 (MT4) and MetaTrader 5 (MT5) is a critical one that dictates your analytical capabilities. While often seen as sequential versions, they are distinct platforms with different architectural philosophies.
- MetaTrader 4 (MT4): Released in 2005, MT4 became the industry standard for forex trading due to its simplicity and stability. It's a 32-bit, single-threaded application, which limits its processing speed, especially during backtesting. Its programming language is MQL4. The biggest reason for its continued dominance is its massive, long-standing ecosystem of custom indicators and automated robots (Expert Advisors).
- MetaTrader 5 (MT5): Released in 2010, MT5 was engineered as a superior, multi-asset platform capable of trading stocks, futures, and options in addition to forex and CFDs. It is a 64-bit, multi-threaded platform that leverages modern processors for significantly faster and more accurate backtesting. Its object-oriented MQL5 language is far more powerful and flexible for developing complex strategies.
While MT4 is sustained by its vast library of legacy tools, MT5 is unequivocally the platform for the future. For any trader serious about quantitative analysis and robust strategy development, MT5's technological superiority makes it the only logical long-term choice.
How Do Indicators Get Their Raw Material? The Foundation of Historical Data
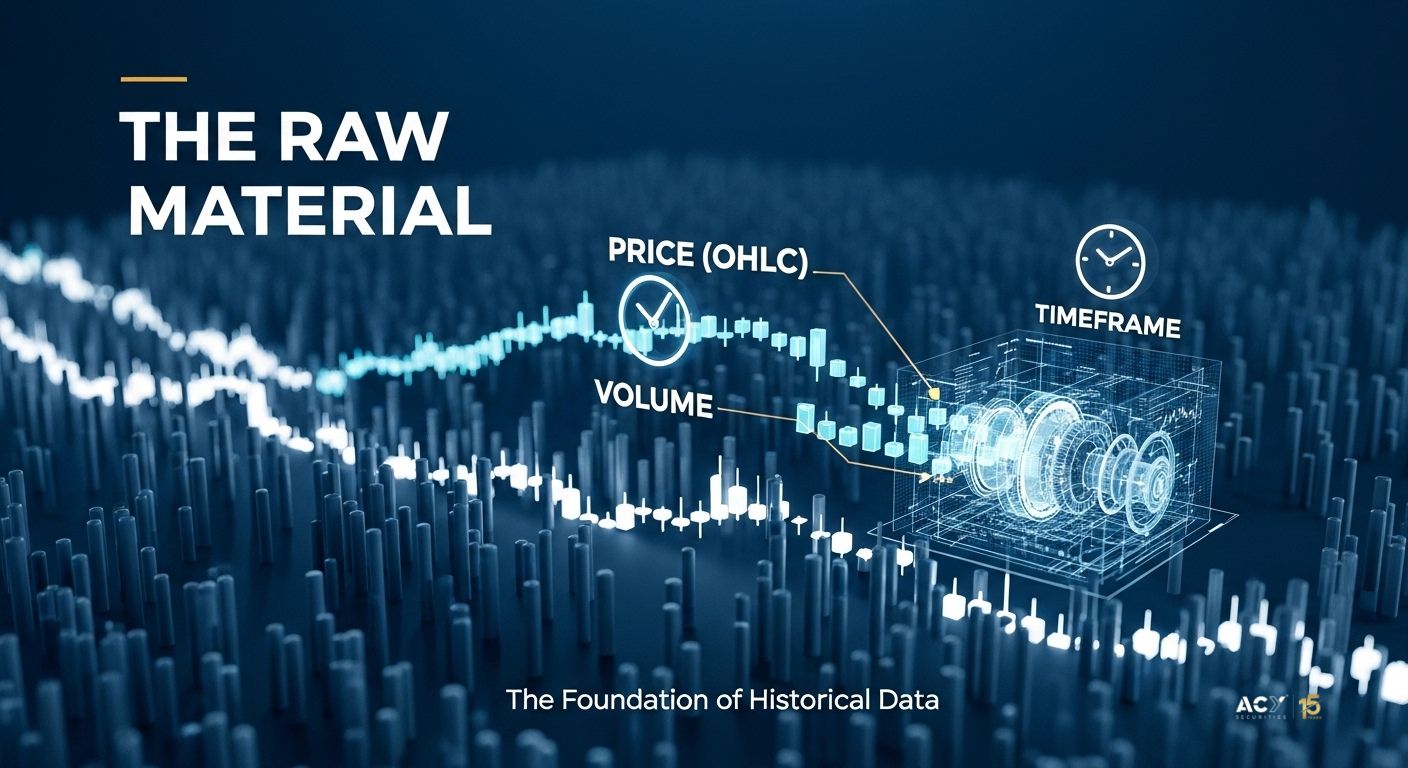
Every indicator calculation begins with the raw data arrays provided by the MetaTrader platform. When you attach an indicator to a chart, it gains access to the historical data for that specific financial instrument and timeframe. The primary arrays are:
- Price: Open, High, Low, and Close (OHLC) values for each bar.
- Volume: The trading volume for each bar.
A crucial concept to grasp is that all indicator calculations are timeframe-dependent. A 20-period Moving Average on a daily chart uses the last 20 days of data. The exact same indicator on a 5-minute chart uses the last 20 five-minute bars (100 minutes of data). This means an indicator's output and its signals are only relevant within the context of the timeframe on which they are calculated.
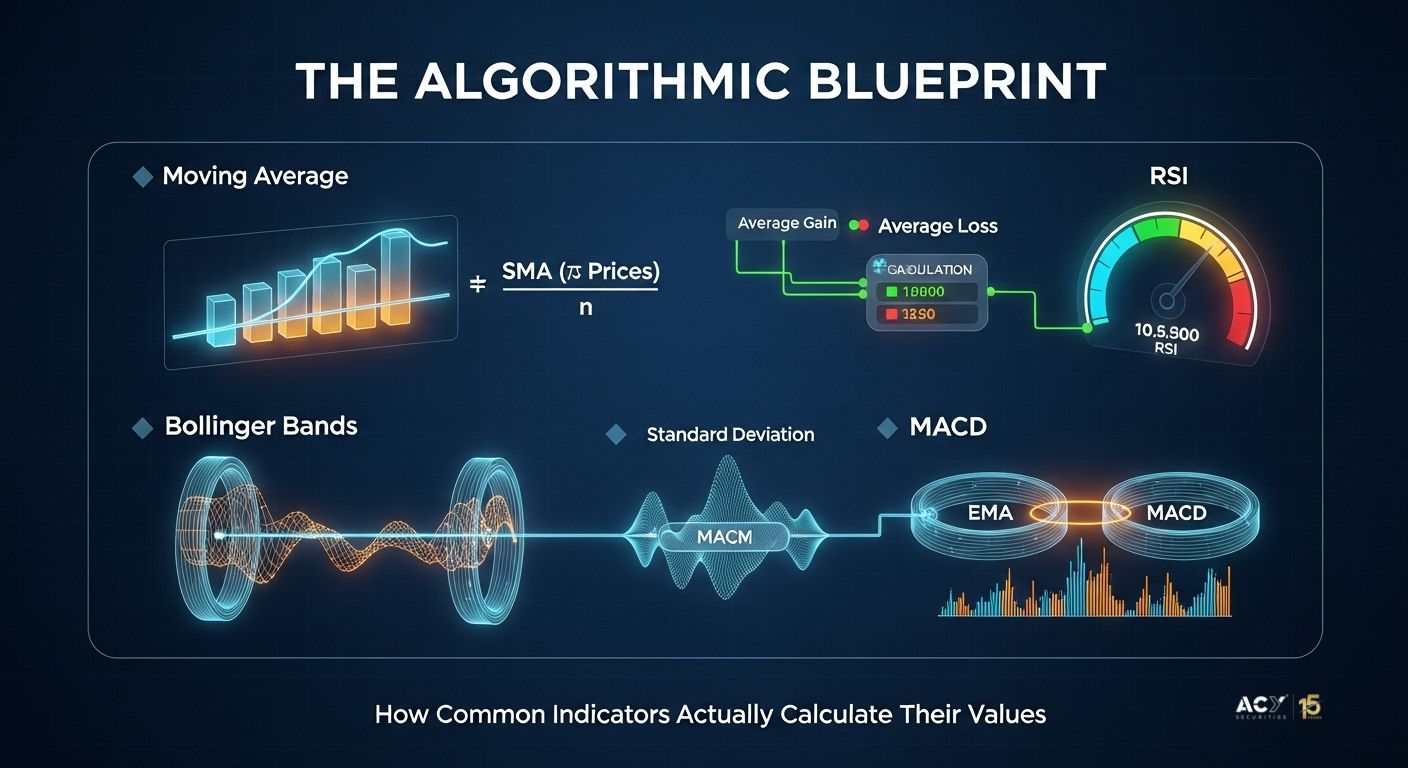
How Do Common Indicators Actually Calculate Their Values? A Granular Breakdown
Let's demystify the math behind some of the most popular indicators.
1. Moving Averages (MA): Smoothing the Trend
- Purpose: To smooth out price fluctuations and make it easier to identify the underlying trend direction.
- Simple Moving Average (SMA): This is the arithmetic mean price over a specified number of periods.
- Formula: SMA = (Sum of Prices over 'n' Periods) / n
- Example (10-period SMA): To calculate the SMA value for the 10th bar, you sum the closing prices of the last 10 bars and divide by 10. For the 11th bar, you drop the oldest price and add the newest one, creating a "moving" average.
- Exponential Moving Average (EMA): The EMA gives more weight to the most recent data points, making it more responsive to recent price changes. The calculation is slightly more complex, involving a smoothing multiplier that is applied to the previous day's EMA value.
2. Relative Strength Index (RSI): Measuring Momentum
- Purpose: A momentum oscillator that measures the speed and change of price movements on a scale of 0 to 100. It's primarily used to identify overbought (typically >70) and oversold (<30) conditions.
- Calculation Logic:
- Calculate Gains and Losses: Over a 14-period lookback, determine the price change. If the price went up, it's a "gain"; if down, a "loss."
- Calculate Average Gain & Loss: Find the average of all gains and all losses over the 14 periods.
- Calculate Relative Strength (RS): RS = Average Gain / Average Loss
- Calculate RSI: RSI = 100 - (100 / (1 + RS))
This final step normalizes the value into the 0-100 range.
3. Moving Average Convergence Divergence (MACD): Unveiling Momentum Shifts
- Purpose: A momentum oscillator that measures the speed and change of price movements on a scale of 0 to 100. It's primarily used to identify overbought (typically >70) and oversold (<30) conditions.
- Calculation Logic:
- MACD Line: (12-period EMA) - (26-period EMA)
- Signal Line: 9-period EMA of the MACD Line
- Histogram: MACD Line - Signal Line
The MACD is an "indicator of indicators." It uses the output of two moving averages to create its fast line, then smooths that line again with another moving average to create the signal line. Crossovers occur when the histogram crosses the zero line.
4. Bollinger Bands: Gauging Volatility
- Purpose: To measure market volatility and provide a relative definition of high and low prices. The bands widen when volatility increases and contract when it decreases.
- Calculation Logic:
- Middle Band: 20-period Simple Moving Average (SMA)
- Upper Band: Middle Band + (20-period Standard Deviation x 2)
Lower Band: Middle Band - (20-period Standard Deviation x 2)
Standard deviation is a statistical measure of price dispersion. The bands create a dynamic channel that contains the majority of price action, making moves outside the bands statistically significant.
5. Volume Indicators (OBV & MFI): Measuring Conviction
- Purpose: To incorporate trading volume to gauge the strength behind price movements.
- On-Balance Volume (OBV): A cumulative indicator. If today's close is higher than yesterday's, today's volume is added to the running total. If the close is lower, it's subtracted. The theory is that volume precedes price.
- Money Flow Index (MFI): Often called the volume-weighted RSI. It uses a similar calculation to the RSI but incorporates volume by first calculating a "Typical Price" (High + Low + Close) / 3 and then multiplying it by volume to determine "Money Flow."
What’s the Difference Between an Indicator, a Script, and an Expert Advisor?
Within the MetaTrader ecosystem, custom programs are divided into three distinct types:
| Feature | Custom Indicator | Script | Expert Advisor (EA) |
| Primary Purpose | Market analysis and data visualization | Execute a single, one-time task | Fully automate a trading strategy |
| Execution Model | Continuous (runs on every tick) | One-off (runs once when activated) | Continuous (runs on every tick) |
| Ability to Trade | No | Yes | Yes |
| Common Use Cases | Plotting custom analysis, identifying divergences | Closing all trades, deleting objects | Trend-following robots, risk management bots |
What is MQL4/MQL5 and How Does It Power These Tools?
MetaQuotes Language (MQL) is the native programming language of the MetaTrader platforms, with a syntax heavily based on C++. For a non-coder, MQL is the set of instructions that transforms a trader's subjective strategy into an objective, automated process that the computer can execute with speed and discipline. It's the "brain" that tells the indicator how to calculate its values and how to draw itself on the chart.
How Did Custom Indicator Technology Evolve from MT4 to MT5?

The evolution from MQL4 to MQL5 was a monumental leap. MQL4 is a procedural language, while MQL5 is fully object-oriented, making it more scalable, maintainable, and efficient for building complex systems.
The most critical difference for indicator calculation is how data is retrieved:
MQL4: Uses a direct, single-function call (iMA(...)) that recalculates the value every time it's called. It's simple but inefficient.
MQL5: Uses a more complex but vastly more efficient two-step, handle-based method. You first create a persistent "handle" to the indicator object, then use a separate function (CopyBuffer()) to retrieve the already-calculated data from memory.
This handle-based system allows MQL5 programs to run up to 20 times faster than their MQL4 counterparts, enabling sophisticated multi-symbol and multi-timeframe analysis without performance degradation.
How Would a Master Like George Soros View Technical Indicators?

George Soros, renowned for his theory of reflexivity, would likely view technical indicators with a healthy dose of skepticism. Reflexivity posits that market participants don't just react to reality; their actions and biases actively shape that reality in a constant feedback loop.
From a Soros-like perspective, an indicator is not a tool for predicting an objective future. Instead, he might see it as:
- A Reflection of Herd Mentality: When thousands of traders watch the same 200-day moving average or the same RSI "oversold" level, their collective actions at that level can create a self-fulfilling prophecy. The indicator doesn't predict the support level; it creates the support level because it focuses the market's attention there.
- A Flawed Participant in the Feedback Loop: Soros would argue that relying solely on past price (the foundation of all indicators) is a critical error because it ignores the underlying biases and fundamental shifts that are constantly altering the market landscape. An indicator is part of the reflexive feedback loop, but it can't understand the loop itself.
- A Tool to Exploit Mispricings: While he wouldn't base his strategy on them, Soros might use indicators to gauge where the "herd" is positioned and what their consensus view is. He could then look for flaws in that consensus,where the market's perception (as shown by the indicator) diverges from underlying reality,to find his trading opportunities.
In short, Soros would likely see indicators as a crude map of market psychology, useful for understanding the prevailing bias but ultimately insufficient for true market mastery without a deep understanding of fundamentals and reflexivity.
What Are 10 Lessons from Van Tharp's "Trade Your Way to Financial Freedom" About Using Indicators?
Van Tharp's classic book is a masterclass in system development, and his wisdom provides a powerful framework for using indicators correctly. He argues that most traders are dangerously fixated on finding the perfect entry signal (the "holy grail" indicator), when it is one of the least important parts of a trading system.
Here are 10 lessons from his book applied to indicator usage:
- Your System Is Everything: A single indicator is not a trading system. A complete system includes setup conditions, an entry trigger, an initial stop-loss, and multiple exit strategies for taking profits and cutting losses.
- Entry is the Least Important Part: Tharp famously states that you could have a random entry system and still be profitable if you have excellent position sizing and exit strategies. Don't obsess over finding the perfect indicator signal.
- Focus on Low-Risk Ideas: Use indicators to identify opportunities where the potential reward is many times greater than the initial risk (high R-multiple trades), not just to find any possible entry.
- Position Sizing is Your Holy Grail: Your success is determined not by your win rate, but by how you manage risk. Use indicators for entry ideas, but use a strict position-sizing model to determine how much you risk on each trade.
- Know Your System's Expectancy: A system has positive expectancy if, over many trades, it makes money. You must backtest your indicator-based rules to know if they are statistically profitable after accounting for costs.
- Fit the Indicator to the Market Type: Tharp categorizes markets into different types (e.g., bull quiet, bear volatile, sideways quiet). Trend-following indicators like moving averages will fail in sideways markets, while oscillators will fail in strong trends. You must match your tool to the current market condition.
- Avoid "Analysis Paralysis": Using too many conflicting indicators leads to indecision and missed opportunities. A simple, robust system with one or two indicators for confirmation is better than a complex one.
- You Trade Your Beliefs about the Market: If you believe an indicator can predict the future, you will suffer. If you believe it's a tool for gauging probabilities within a risk management framework, you can succeed.
- Thorough Testing is Non-Negotiable: Never trade an indicator-based strategy with real money until it has been rigorously backtested and forward-tested on a demo account.
- The Objective is to Follow Your Rules: The ultimate goal is not to predict the market but to execute your well-tested, indicator-based rules with flawless discipline.
What Factors Can Affect an Indicator's Accuracy?
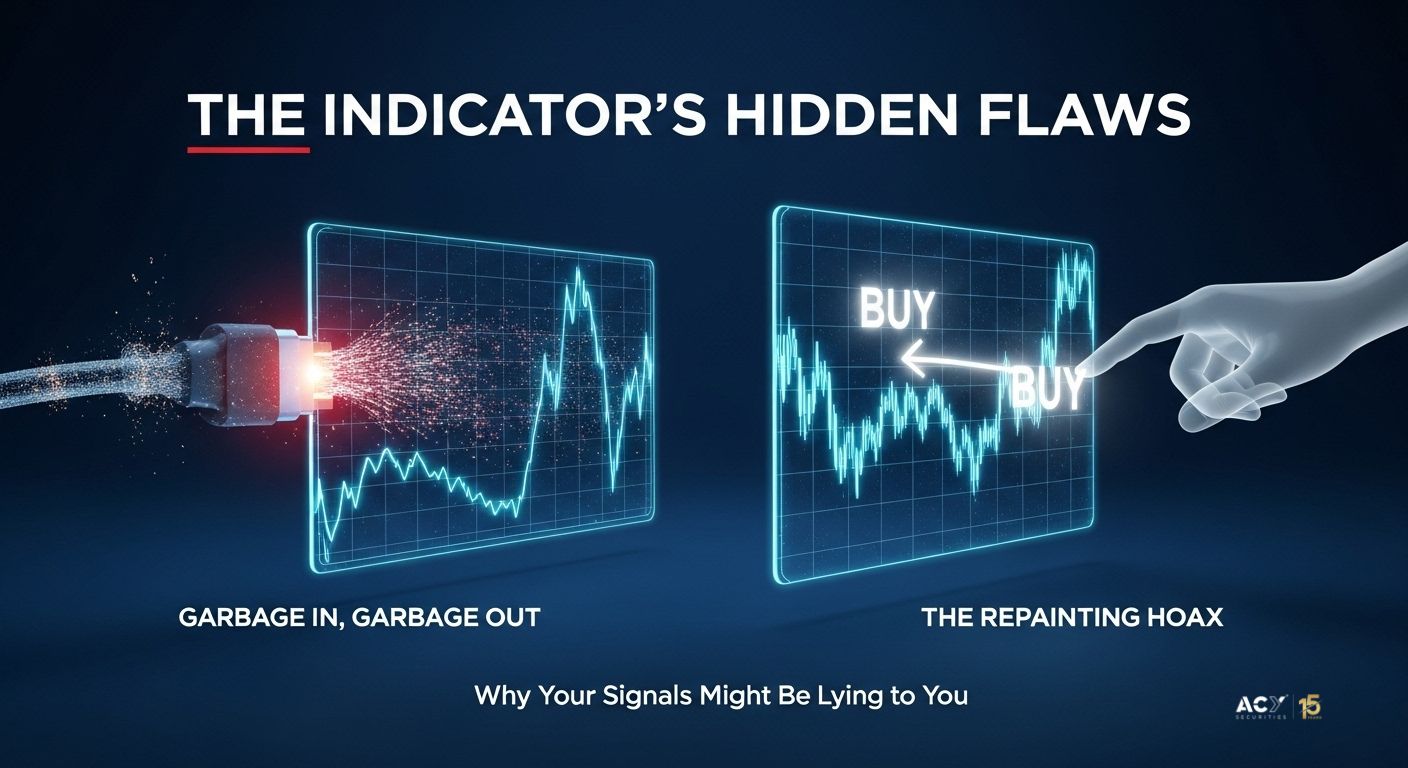
Even with a perfect formula, an indicator's real-world output can be unreliable.
- Garbage In, Garbage Out: Your indicator is only as good as your broker's data feed. Subtle differences in price data between brokers can cause an indicator to generate a signal on one platform but not another. Erroneous "bad ticks" can severely distort calculations and generate false signals.
- The "Repainting" Hoax: This is one of the most insidious scams in the trading world. A "repainting" indicator is a fraudulent tool that modifies its past signals to look perfect. It waits for a move to be confirmed and then goes back in time to draw a "perfect" entry arrow. It creates a flawless but completely fake historical record.
- How to Detect It: The ultimate lie detector is MetaTrader's Strategy Tester in "Visual Mode." Run the indicator and watch it bar-by-bar. If any past signal (arrow, dot, etc.) ever moves, changes, or disappears, the indicator repaints and is a scam.
How Can Beginners Avoid Pitfalls and Become Smarter Traders?
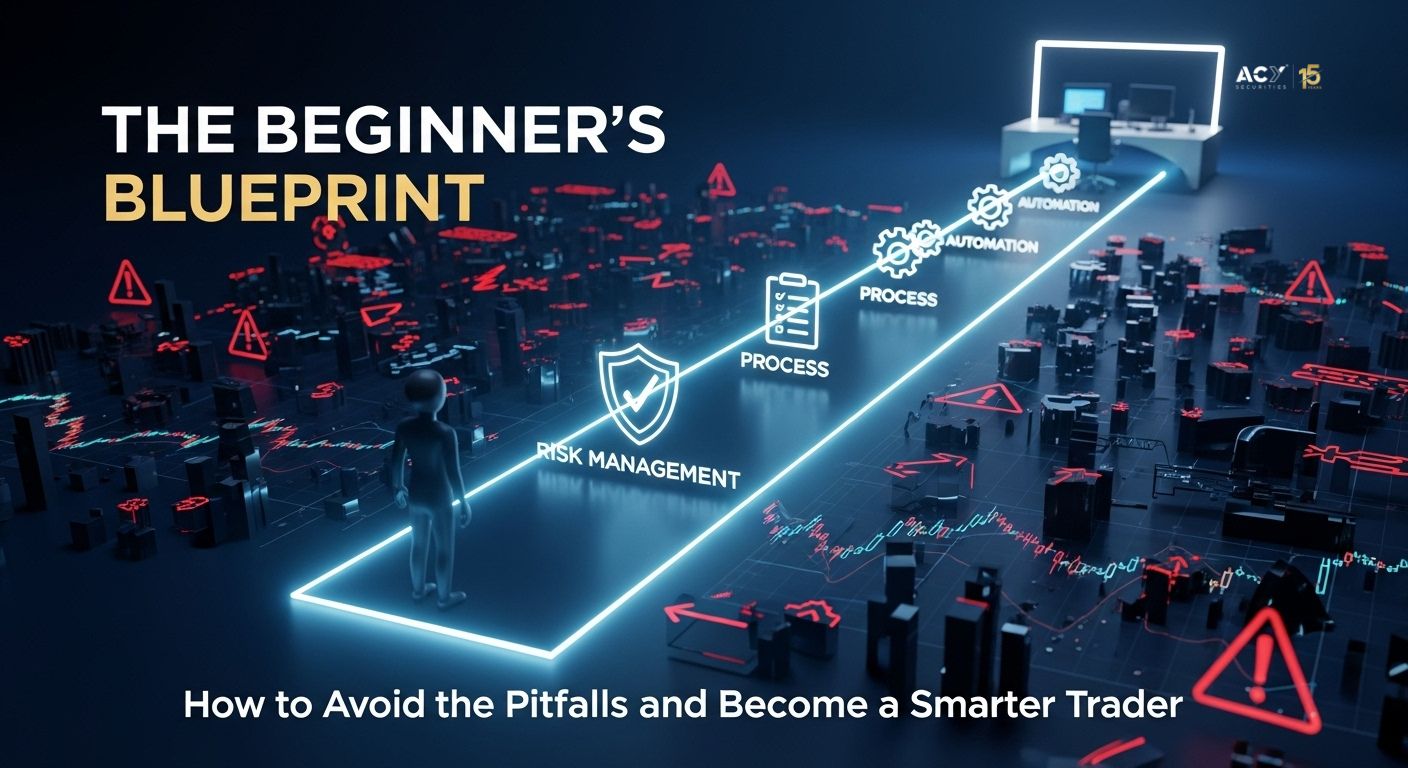
The journey from novice to expert is fraught with danger, from scam indicators to information overload. The key is to shift your focus from chasing signals to building a professional process. Instead of venturing into the "Wild West" of online forums, it's wise to consider where to find the best MT4/MT5 indicators and scripts for beginners from a trusted source.
A curated, professional toolkit, such as the one offered by ACY.com, can be invaluable. These tools are designed not as magic bullets but as utilities to instill professional habits. They provide a clear framework for how to use MT4/MT5 indicators and scripts for risk management, not just signals. By automating tasks like position sizing or closing all trades before a news event, a systematic approach can dramatically lower the emotional toll of trading. This allows you to simplify your MT4/MT5 indicators and scripts for stress-free trading.
Ultimately, this process-driven approach is what separates amateurs from pros. By using indicators and scripts to enforce discipline, automate analysis, and manage risk, you are no longer just guessing. You are building an analytical framework that helps you understand market dynamics, which is precisely how custom MT4/MT5 indicators can make you a smarter trader.
Conclusion: Beyond Signals, Towards a Systematic Process
The inner workings of MT4 and MT5 indicators reveal a world of precise mathematics operating on imperfect data. We've seen that these tools are not crystal balls but lagging calculators whose output is fragile, dependent on data quality, platform architecture, and user interpretation.
The inescapable conclusion is that the search for a "holy grail" indicator is a fool's errand. The path to expertise is a paradigm shift from prediction to process. A successful trader builds a robust system with explicit rules for entry, exit, and risk management. In this professional paradigm, indicators and scripts are relegated to their proper role: tools in service of the system, used to automate analysis, enforce discipline, and execute a well-defined plan with mechanical precision.
Frequently Asked Questions (FAQ)
1. Are MT5 indicators more accurate than MT4 indicators?
The core calculation formulas for standard indicators (like SMA, RSI) are the same on both platforms. However, MT5's ability to handle higher quality, tick-by-tick historical data in its backtester means that strategy testing with indicators is generally more accurate and reliable on MT5. The underlying technological superiority of MT5 provides a more robust environment for quantitative analysis.
2. Can a moving average predict the future price?
No. A moving average, by its very definition, is calculated using past prices. It is a lagging indicator designed to clarify the direction of the current trend, not predict the future. It can help you make probabilistic forecasts, but it offers no certainty.
3. What is a "repainting" indicator and how do I avoid it?
A "repainting" indicator is a fraudulent custom indicator that cheats by changing its past signals. It plots an entry signal (like a "BUY" arrow) only after the move has already happened, making its historical chart look deceptively perfect. The best way to avoid them is to test any new indicator in the MetaTrader Strategy Tester's "Visual Mode." If you see any past signal change or disappear as new bars are added, it repaints and should be deleted immediately.
4. How many indicators are too many on a trading chart?
While there's no magic number, most professional traders advise using a "less is more" approach. A chart cluttered with 5, 6, or more indicators often leads to "analysis paralysis," where conflicting signals cause confusion and inaction. A good practice is to use 2-3 indicators at most, ensuring they measure different things (e.g., one for trend, one for momentum) and are used primarily to confirm your price action analysis.
This content may have been written by a third party. ACY makes no representation or warranty and assumes no liability as to the accuracy or completeness of the information provided, nor any loss arising from any investment based on a recommendation, forecast or other information supplies by any third-party. This content is information only, and does not constitute financial, investment or other advice on which you can rely.
Try These Next

