Top 5 Candlestick Trading Formations Every Trader Must Know
2023-07-17 14:33:58


Steve Nison is considered the Godfather of candlesticks, and every trader who loves candlestick patterns must read at least one of his outstanding books.
In this article, we'll dive into the top 5 candlestick trading formations every trader must know, so you can set a rock-solid foundation for your entries and exits.
Candlesticks are a great way for traders to visualise specific price patterns on charts.
They help traders make better trading decisions about where and when to enter and exit the markets, as well as where best to set their stop-loss and take-profit levels.
Candlestick trading formations are used to identify situations where:
- The trend is about to reverse - reversal candlestick patterns.
- The trend is about to accelerate in the same direction after a short consolidation - continuation patterns.
- There is no real trend, as neither buyers nor sellers are in control – indecision patterns.
Candlesticks are a common form of technical analysis and nearly all charting platforms default to a candlestick chart, such as MT4.
Candlestick charting basics
A candle is formed by a body and wicks.
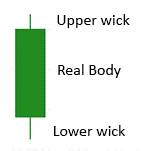
The body is the solid area between the open price and the close price, and the wicks represent the highest and the lowest levels during the timeframe used.
The size of the body can give clues to traders about the strength of the movement, and the wicks help give an idea as to volatility.
Now you have the basics of Japanese candlestick charts and what they represent, let’s have a look at five of the most widely used candlestick patterns.
Whether you’re a beginner trader or someone who has been in the markets for a long time, you will regularly encounter these powerful candlesticks patterns.
Top 5 candlestick formations every trader should know
1. Doji candlestick pattern
A doji happens when the opening and closing prices are (almost) the same, which often results in a straight line as a body.
It shows that buyers and sellers are undecided about the direction in which the asset should evolve. Whether you’re trading forex, CFDs, Indices, Commodities or Cryptocurrencies, doji candles can show up at times of indecision in the markets.
This pattern is the strongest indecision candlestick pattern, as no market participant (buyers or sellers) is in control.
You can see in the chart below several doji candlestick patterns.
How to trade the doji candlestick pattern:
Since a doji is considered a indecision period, your strategy here is to be on high alert for a potential change in direction of trend.
A lot of times a doji will indicate a potential change of direction.
When you see a doji candlestick pattern, consider tightening your stops or exit on a confirmation of the next candle breaking lower.
Or for those looking to enter on this candlestick pattern with a bullish view, consider putting your stop entry order above the high of the current doji, once again confirming the direction or breakout.

You can find different types of dojis, depending on the length of the upper and lower wicks:
- The “regular doji”
- The gravestone doji
- The long-legged doji
- The four price doji
- And the dragon-fly doji.
With dojis, traders know that sentiment is likely to change.
They are waiting for either the bulls or the bears to take control and push prices higher or lower. Be patient and wait for a confirmation of direction.
2. Bearish & Bullish engulfing pattern
A bearish engulfing pattern represents a major bearish reversal pattern that is composed of two candlesticks that appear after an uptrend. The second candle is always bigger than the previous one, engulfing it.
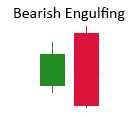
Here is what you need to monitor to be sure that this pattern is valid:
- This pattern has to appear after an uptrend.
- The body of the 2nd candlestick must “swallow” the body of the first candle (not necessarily with the wicks).
- The 1st candlestick should usually be bullish, while the second one should be a bearish candle.
- The wicks of the 2nd candle should be short, showing there is little volatility, and the movement is strong.
A bearish engulfing pattern can only appear after an uptrend.
With a bearish engulfing pattern, the 1st candle is bullish, and prices increase on the following day. The instrument opens higher compared to the closing price of the previous day.
However, the bulls aren’t strong enough, and sellers take control by pushing prices down, so then prices finally close below the opening of the previous day.
The gains of the previous day are erased, which shows a bearish force has taken over.
A bullish engulfing pattern is the same as the bearish engulfing pattern but in the opposite direction and is one of the best candlestick patterns for day trading.
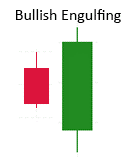
You will notice the green candle completely engulfs the previous bearish candle.
This is a bullish sign with the bulls in complete control and dominating the bears and one of the most popular forex candle formations.
Bullish reversals like the three shown on the GBPUSD chart below are a popular signal for traders looking to identify early turning points in the market.

How to trade the bullish engulfing candlestick pattern:
This powerful reversal pattern occurs after a downtrend, signalling a shift in market sentiment from bearish to bullish.
To effectively trade the Bullish Engulfing pattern, first ensure it appears after a sustained downward movement.
The first candlestick should be bearish, followed by a second candlestick that completely engulfs the body of the previous bearish candle.
This signifies a strong bullish momentum takeover. To confirm the validity of the pattern, observe shorter wicks on the engulfing candle and relatively low volatility.
As a trader, you can take advantage of this pattern by entering a long position once the Bullish Engulfing pattern is confirmed.
Consider setting a stop-loss order below the pattern's low to manage risk, and identify a favourable profit target based on your trading strategy.
Why not open a live demo trading and test these strategies out today?
3. Dark cloud cover candlestick formation
This pattern is a 2-day reversal pattern with bearish implications that appears at the end of an uptrend.
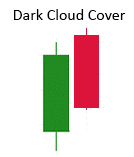
A Dark cloud cover is formed when the 1st candle has a long bullish body, and the 2nd candle opens at a new high – this confirms the uptrend but closes lower than the midpoint of the 1st candle.
This bearish candlestick formation is often one of the first patterns new candlestick traders learn.
This pattern considerably weakens the bullish sentiment and forces many traders to exit the market, which adds to the new bearish movement.

How to trade the dark cloud cover candlestick pattern:
This bearish reversal pattern manifests at the end of an uptrend, indicating a potential shift in market sentiment from bullish to bearish.
To effectively trade the Dark Cloud Cover pattern, wait for it to materialise after a prolonged upward movement.
The first candlestick should have a long bullish body, followed by a second candlestick that opens higher than the previous day's high, validating the continuation of the uptrend.
However, the second candlestick should then close below the midpoint of the first candlestick's body, showcasing the emerging bearish pressure.
This formation weakens the prevailing bullish sentiment and entices traders to exit the market, often leading to a subsequent bearish move.
As a trader, you can capitalise on this pattern by considering a short position after confirming the Dark Cloud Cover.
Implement a stop-loss order above the pattern's high to manage risk effectively and determine a suitable profit target based on your trading strategy and risk reward goals.
4. Piercing line candlestick pattern
Piercing line is the opposite of a Dark cloud cover pattern and has therefore revered to as a bullish reversal pattern.
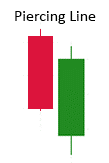
In a downtrend, the 1st candle is long and bearish, while the 2nd candle opens lower than the lowest level of the previous day, confirming the downward trend.
However, the bulls eventually take control, and the 2nd candle closes above the midpoint of the body of the 1st candle, reversing the downtrend.

5. Rising three periods candlestick formation
The rising three method is a bullish continuation pattern that can only happen during a bullish trend.
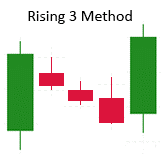
The 1st candle of this pattern is a long bullish candle that confirms the strength of the established trend.
However, the next 3 candles are small and bearish (at least 2 of the 3 candles should be bearish), all remaining within the range of the body of the 1st candle. You will notice the short shadows on the bearish candles.
Consequently, it shouldn’t be perceived as a reversal signal, as on the 5th day, another long bullish candle should appear, closing at new highs and breaking out from this short trading range to continue its uptrend movement.
Often, this is a strong buying signal, and price action trading systems will kick in, fuelling the surge higher.
As far as continuation candlestick patterns go, the rising three method is considered one of the strongest.
You may like to know as well, the opposite of this pattern is the falling three method and is equally as strong.
How to trade the Rising Three Periods Candlestick pattern:
This bullish continuation pattern manifests exclusively within a pre-existing uptrend, indicating the potential for further upward movement.
To effectively trade the Rising Three Periods pattern, ensure the first candlestick is a long bullish candle, reaffirming the strength of the ongoing trend.
The subsequent three candles should be relatively small and bearish, with at least two of them displaying a downward bias.
Importantly, all three candles should remain within the range of the first candlestick's body, reflecting a consolidation phase.
However, it's crucial to note the Rising Three Periods pattern should not be perceived as a reversal signal.
On the fifth day, another long bullish candle should emerge, closing at new highs and breaking out from the preceding tight trading range to continue the upward momentum.
This pattern often triggers strong buying signals, attracting price action trading systems and driving prices higher.
Where to place your stops when trading the Rising Three Periods candlestick pattern
As this pattern suggests a continuation of the existing bullish trend, it's prudent to position your stop-loss order below the low of the consolidation range.
This level acts as a support zone, and if the price were to break below it, it could indicate a potential reversal or weakening of the upward momentum.
Placing your stop-loss order below this support level helps minimise potential losses in case the market unexpectedly turns against your trade.
Are you using candlestick charting techniques on your live account? Before going live, be sure to backtest your ideas and strategies first.
The Best Trading Books on Candlestick Trading:
Here are our top 4 Candlestick Trading books to add to your library. Makre sure you purchase the actual book as the kindle and Audible versions cannot provide the rich visual you need to master candlestick patterns.
Based in Australia, we have our very own 'Queen of Candlestick Charting,' Louise Bedford. Her book, titled 'The Secret of Candlestick Charting,' is considered the best candlestick book for anyone looking to master candlestick patterns in any market.
As mentioned at the start of this article, Steve Nison is considered the ‘grandfather’ of Japanese candlesticks and has written several outstanding books on the subject. His 2nd edition book, published in 2001 has nearly 2000 reviews and is titled ‘Japanese Candlestick Charting Techniques: A Contemporary Guide to the Ancient Investment Techniques of the Far East, Second Edition.’ If you want to master candlestick patterns, you must have this in your library.
One book we love that was written more recently is 'The Ultimate Guide to Candlestick Charting: Advanced Candlestick Charting Techniques & Strategies used to profit in Stock and Forex trading,' by Alex Richards. This is the best Forex candlestick book and includes many forex candle formations and Forex candlestick patterns for Forex traders, covering your favourite FX pairs. Alex has what he calls his collection of the best candlestick patterns to profit in Forex.
And lastly, to round out my top 5 candlestick books, is a recent addition from Stewart Price, published in 2022, titled, ‘Japanese Candlestick Charting Techniques: A Contemporary Guide to the Ancient Investment Techniques of the Far East, Second Edition.’ This one is really well illustrated and makes for an excellent reference guide.
Concluding the top 5 candlestick trading formations
In conclusion, mastering the top 5 candlestick patterns is a game-changer for traders seeking to elevate their skills and achieve better trading outcomes.
Armed with the knowledge of these powerful formations, you can identify potential trend reversals, fine-tune entry and exit points, and make well-informed trading decisions.
Whether you're captivated by the Doji's indications of market indecision, the engulfing patterns' reversal signals, or the rising three method's bullish continuation opportunities, each candlestick pattern holds valuable insights.
Remember to combine these patterns with proper risk management techniques and your own trading strategy to maximize their effectiveness.
All the best with your trading.
This content may have been written by a third party. ACY makes no representation or warranty and assumes no liability as to the accuracy or completeness of the information provided, nor any loss arising from any investment based on a recommendation, forecast or other information supplied by any third-party. This content is information only, and does not constitute financial, investment or other advice on which you can rely.
Try These Next
4 Powerful Tactics to Overcome the Most Costly Forex Mistakes
How to Master MT4 & MT5 - Tips and Tricks for Traders
The Importance of Fundamental Analysis in Forex Trading
Forex Leverage Explained: Mastering Forex Leverage in Trading & Controlling Margin
The Importance of Liquidity in Forex: A Beginner's Guide
Close All Metatrader Script: Maximise Your Trading Efficiency and Reduce Stress
Best Currency Pairs To Trade in 2025
Forex Trading Hours: Finding the Best Times to Trade FX
MetaTrader Expert Advisor - The Benefits of Algorithmic Trading and Forex EAs
Top 5 Candlestick Trading Formations Every Trader Must Know