Multi-Timeframe Moving Average Strategy: How to Spot High-Probability Pullback Trades
2025-07-25 10:06:15


Goal of This Lesson
To help you identify potential bounce zones using moving averages across different timeframes — combining structure, momentum, and timing to execute high-probability pullback trades with clarity.
Real-Life Analogy: The Bouncing Ball

Imagine dropping a rubber ball.
- On a firm surface, it rebounds sharply.
- On a soft cushion, it barely lifts.
In trading, moving averages act like the floor — but price only bounces when there’s enough momentum underneath. Not every touch leads to a trade. But when that bounce happens at the right place, at the right time, with structure to support it — that’s when you strike.
Why You Can’t Trust Every MA Bounce
A common mistake: thinking price will bounce just because it touches a moving average.
But moving averages are reaction zones, not just trade signals. The high probability edge comes from combining:
- Trend context (higher timeframe)
- Reaction zones (mid timeframe)
- Entry confirmation (lower timeframe)
When all three align, you’re no longer trading guesses — you’re trading evidence.
How to Use Multi-Timeframe Moving Averages to Spot Pullback Entries
Step 1: Identify the Macro Trend on your Higher Timeframe
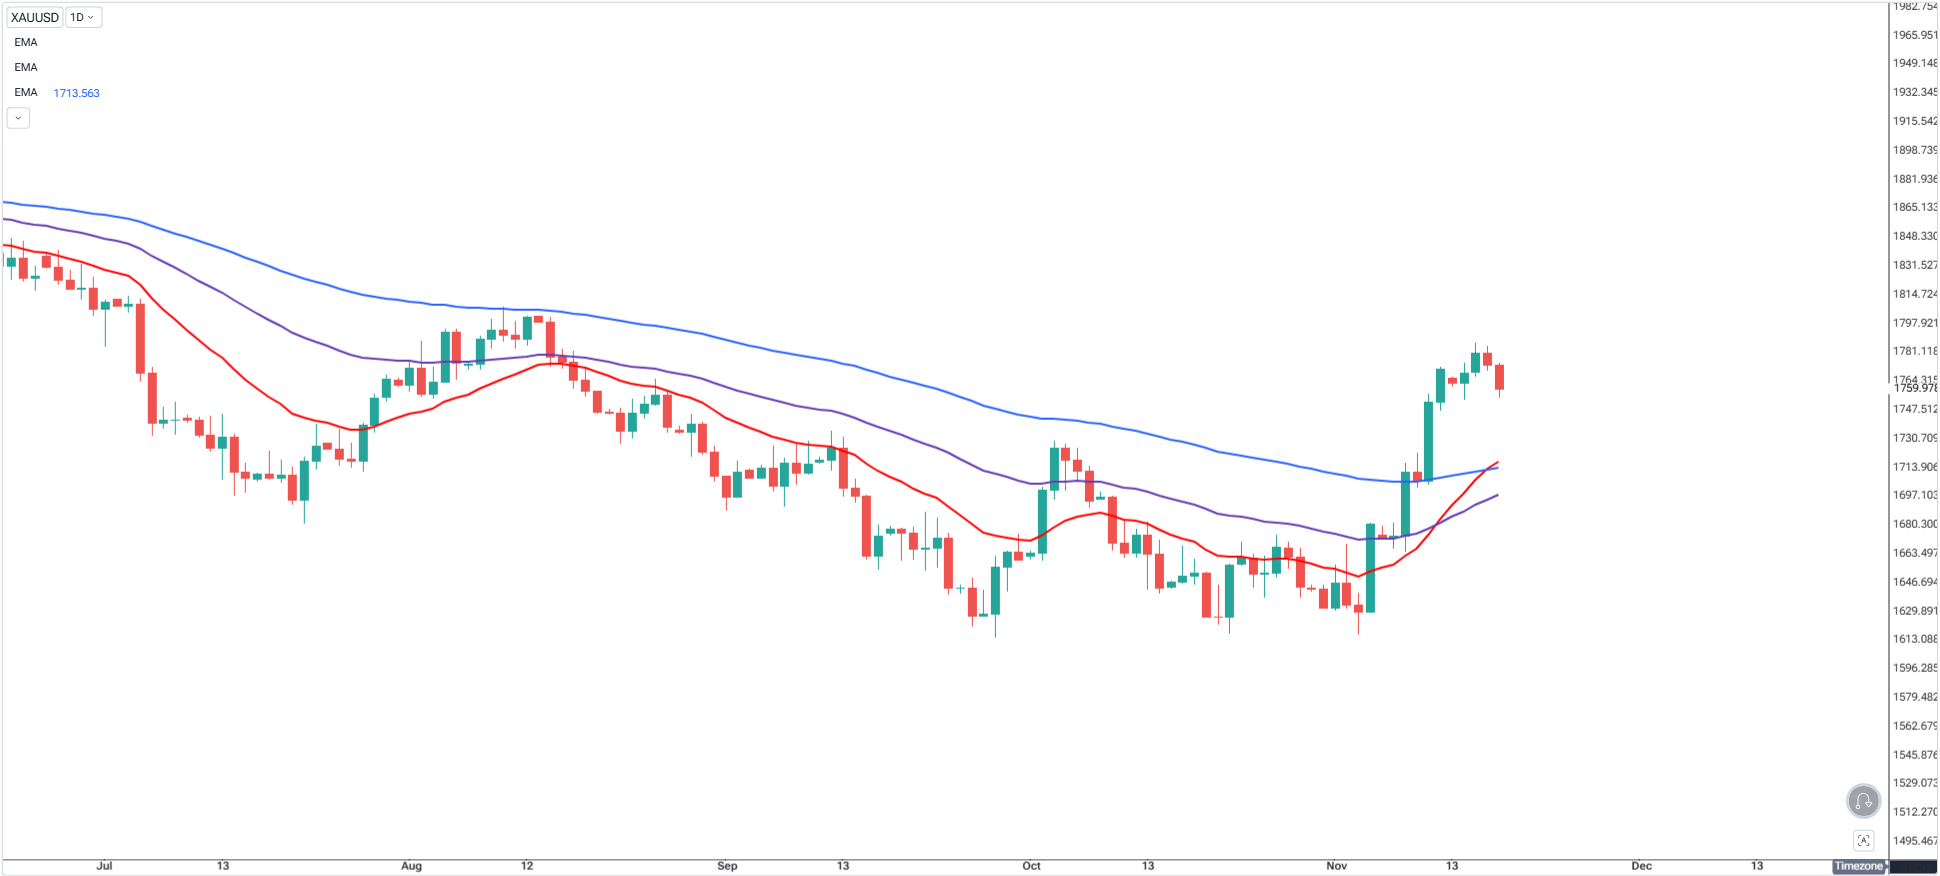
Use a 100 EMA or 200 SMA to spot the broader direction.
- Price above the MA = bullish flow
- Price below = bearish environment
- Clean slope = trending
- Flat = range
Let this timeframe be your trend anchor — not for entries, but for directional bias.
In this example, we are using the 20-50-100 Moving Averages on the Daily Timeframe.
Step 2: Wait for Price to Arrive at Whichever Moving Average
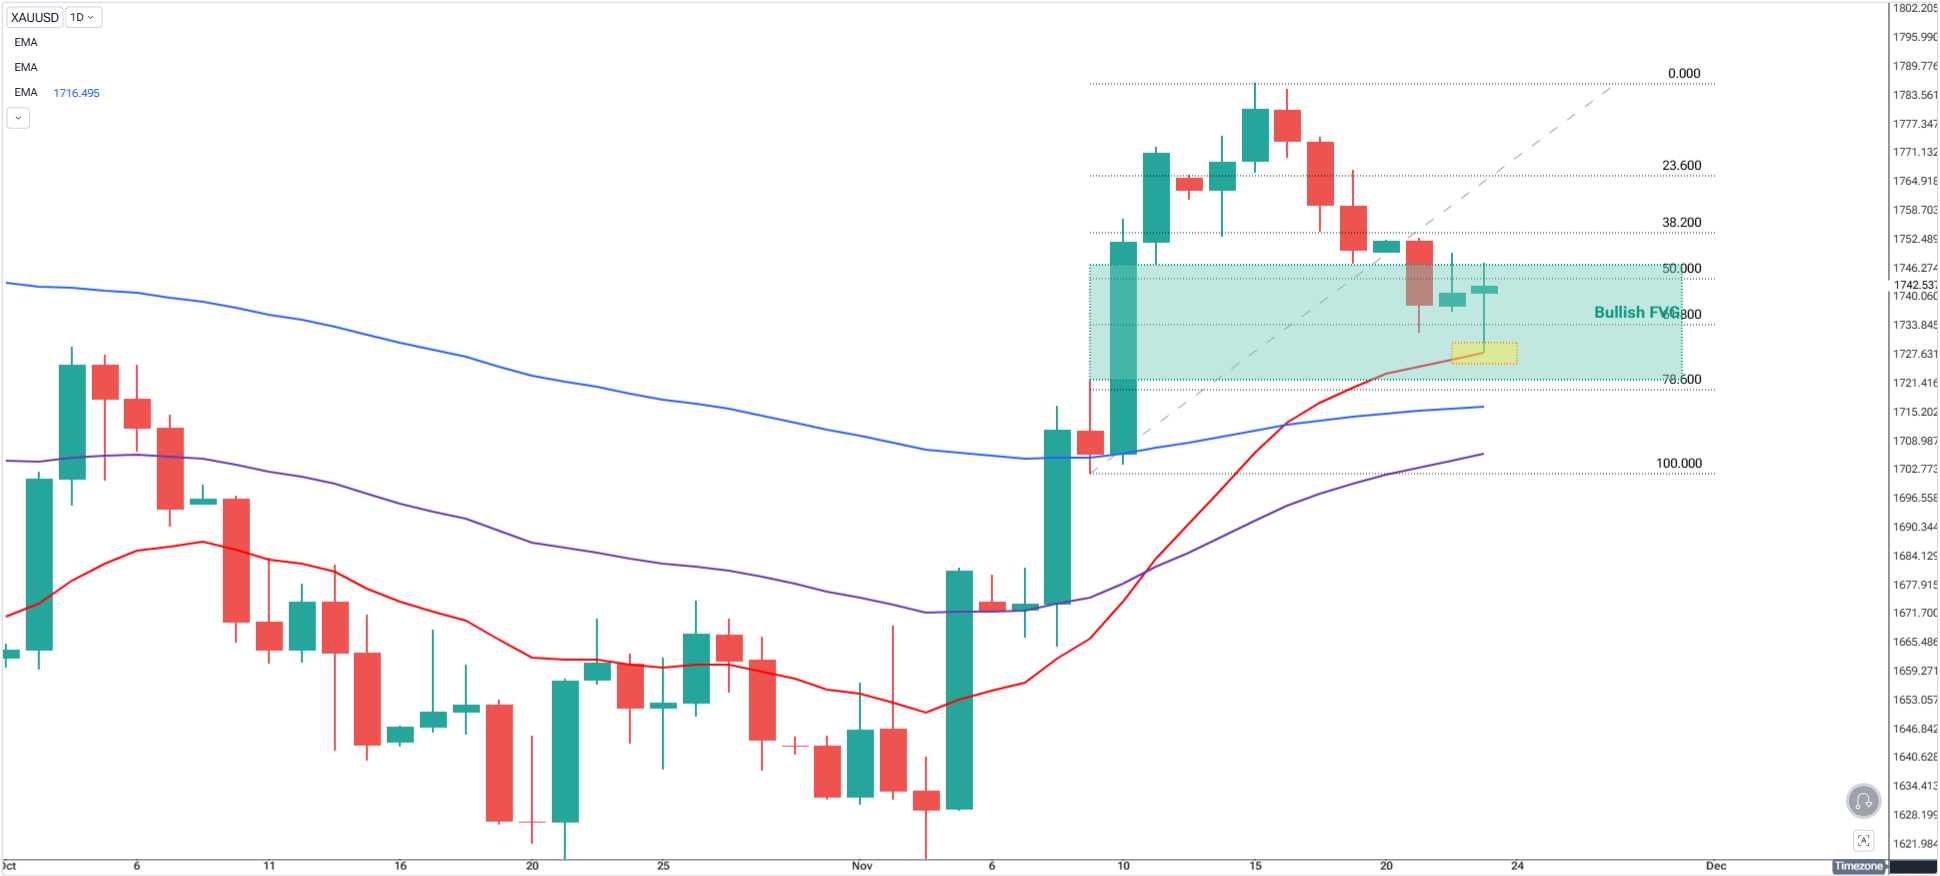
Zoom in to find where price might retrace and bounce.
Use:
- 50 SMA for deeper, smoother pullbacks
- 20 EMA for faster, sharper momentum corrections
Bonus: Look for confluence with:
- Recent swing highs/lows
- Fibonacci 50–61.8% retracement zones
- Previous OB/FVG or S&R zones
You’re not taking trades here yet — just marking potential bounce areas where trend and pullback meet.
Step 3: Wait for Confirmation on the Lower Timeframe
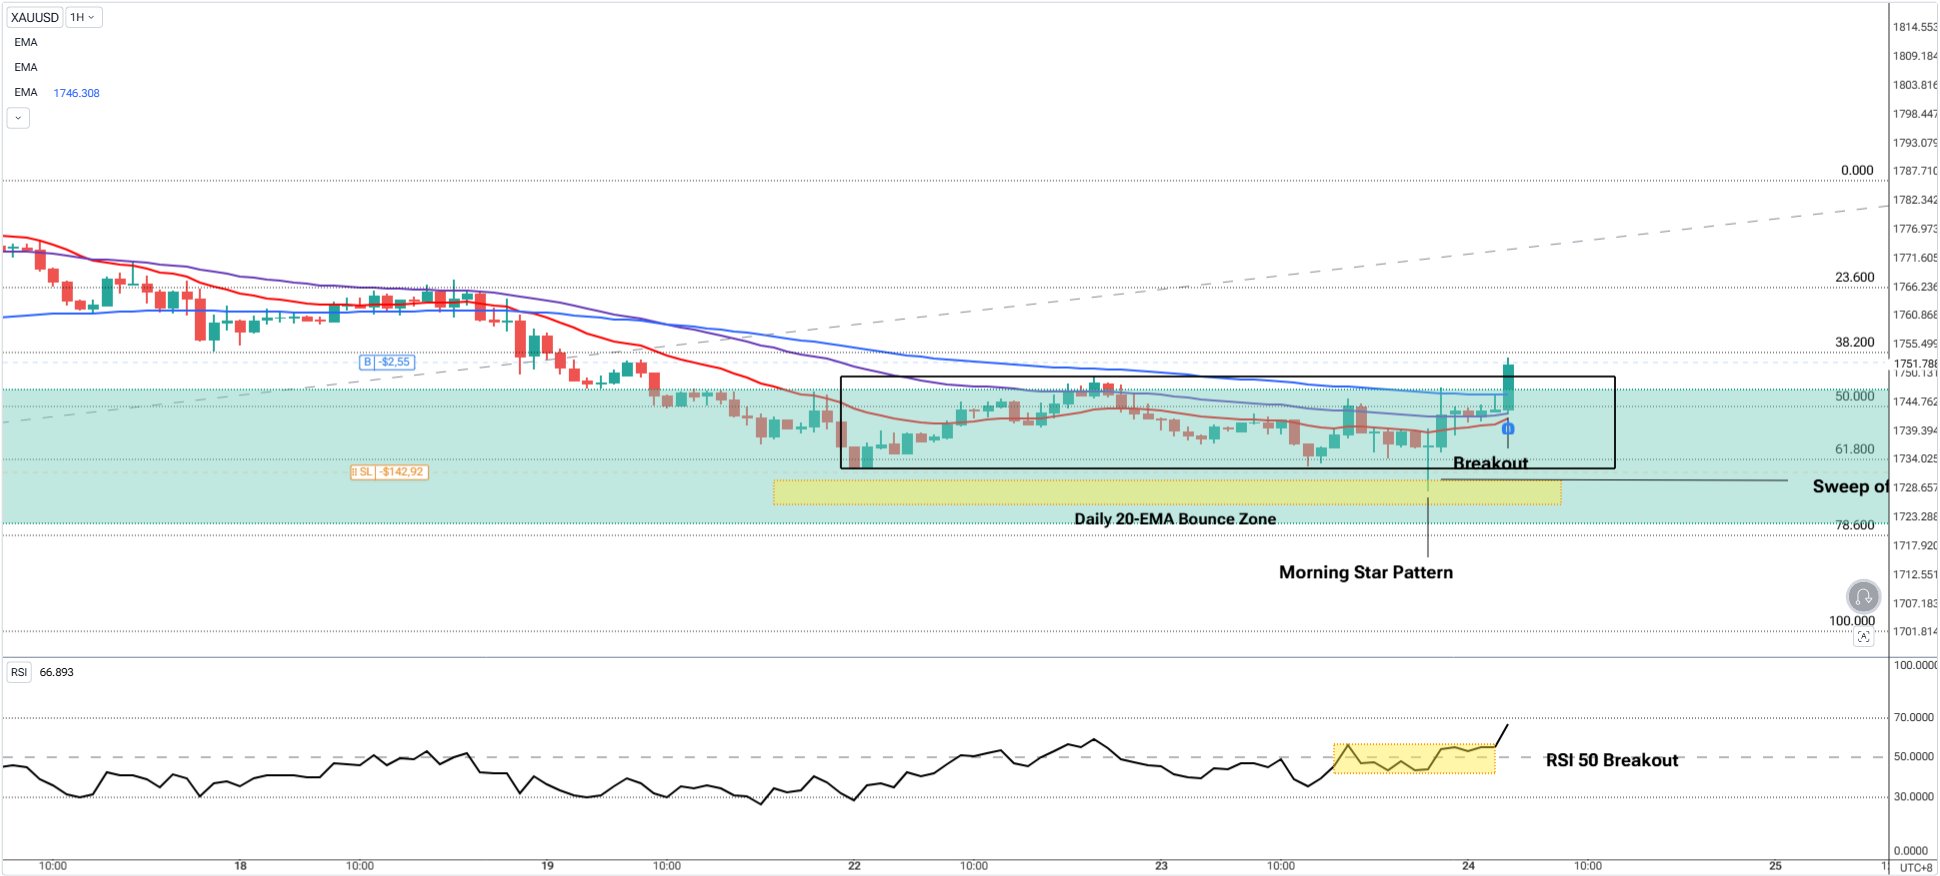
Now drop to a lower timeframe to confirm whether the bounce is real. For this example, we use the 1-hour timeframe for confirmation.
Look for:
- Bullish/bearish engulfing candles;
- Liquidity sweep followed by a strong reaction;
- Break of structure (BOS) or market shift;
- RSI breakout
These signs show an intention to continue the trend, not just a random reaction.
When this aligns with your MA zones above, the probability shifts in your favor.
Step 4: Zoom Out to the Higher Timeframe and Ride the Trend
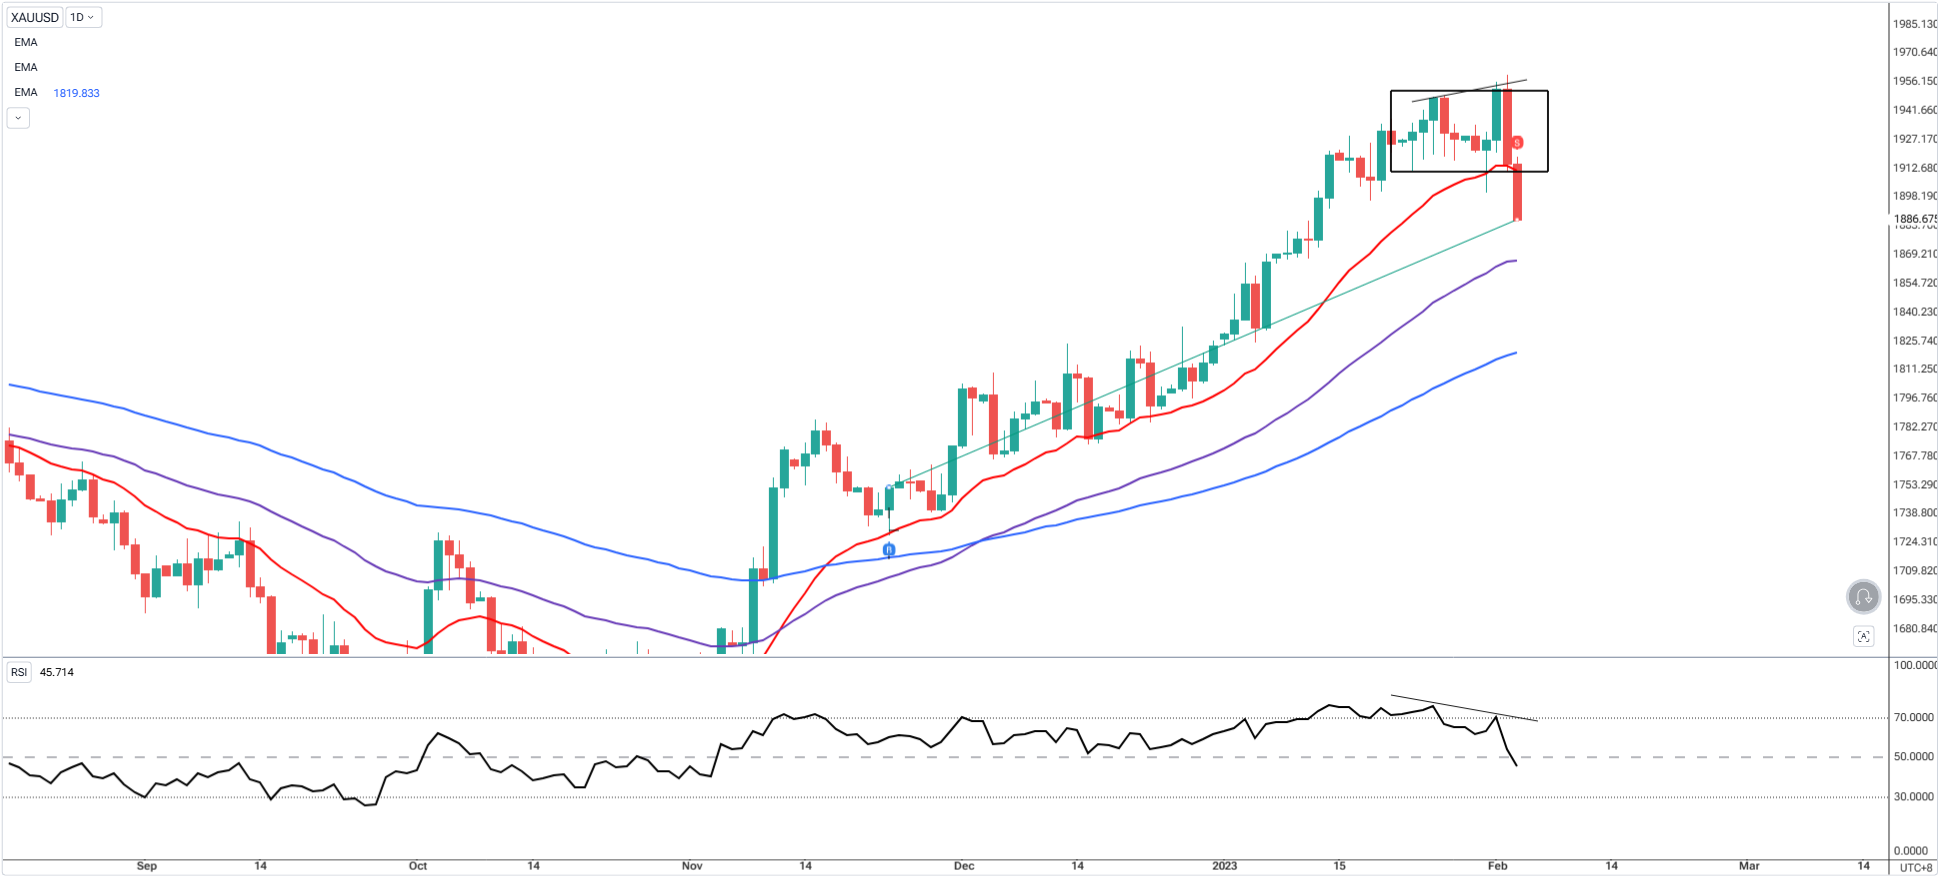
Once you’ve executed your trade from the lower timeframe confirmation, it’s time to shift your attention to the higher timeframe to manage the trade effectively.
This is where many traders lose out — they focus only on the entry, but miss the bigger picture that holds the real potential.
Move to the Daily Chart
After your breakout entry is live and protected with a stop, go to the Daily timeframe.
Why?
Because this is where the macro structure lives, if price is breaking out of a compression zone or continuing a trend, this is where you’ll see it unfold — often riding far longer than you expect on the smaller timeframes.
Use the 20 EMA as a Trailing Guide
The 20 EMA on the Daily becomes your macro trail guide:
- As long as price stays above the 20 EMA, the uptrend is intact — hold your trade
- If price closes below the 20 EMA and breaks the short-term structure, it’s your first sign of a momentum shift
- Combine this with a break back into a prior range → you have grounds to exit or tighten stop
Bonus:
- If RSI is now diverging, exit the trade with a confirmation of structure invalidation.
This method is especially powerful during trending phases after a breakout:
- Sideways to trending → wait for the range to break on Daily, then hold above EMA 20
- Trending to pausing → let price rest, EMA will catch up, trail underneath each swing
Common MA Combinations That Work Across Timeframes
| Setup Style | Trend (HTF) | Entry Timing |
|---|---|---|
| Short-term momentum | 100 EMA (H4) | M15 |
| Balanced swing | 200 SMA (Daily) | H1 |
| Smooth pullback | 100 EMA (H1) | Price Action + EMA on M5 |
You can adjust these combos depending on the asset or volatility — but the core logic remains:
Trend confirmed → Bounce expected → Entry confirmed
Why Not Trade Every Pullback?

In earlier parts of this series, we covered pullback strategies using single-timeframe MAs.
But not every pullback is equal. Some are just noise, others are traps. By waiting for confirmation on the lower timeframe, you move from guessing to executing with structure.
This is especially critical when price pulls back to a 20 EMA or 50 SMA. Alone, that means nothing. But if price structure confirms it, now you’re trading a bounce with purpose.
Final Thought

Moving averages alone don’t make the trade — they frame it.
When aligned across timeframes and confirmed by price action, they become powerful contextual tools that guide you through noise, fakeouts, and hesitation.
Trade the bounce, not because the line is there, but because the market structure says it’s time.
Start Practicing with Confidence - Risk-Free!
Open a free demo account today and experience institutional-grade spreads, lightning-fast execution, and all the tools you need to grow as a trader.
- Trade forex, indices, gold, and more
- Access ACY, MT4, MT5, & Copy Trading Platforms
- Practice with zero risk
It’s time to go from theory to execution - risk-free.
Create an Account. Start Your Free Demo!
Check Out My Contents:
Strategies That You Can Use
How To Trade & Scalp Indices at the Open Using Smart Money Concepts (SMC)
How to Trade Breakouts Effectively in Day Trading with Smart Money Concepts
Complete Step-by-Step Guide to Day Trading Gold (XAU/USD) with Smart Money Concepts (SMC)
The Power of Multi-Timeframe Analysis in Smart Money Concepts (SMC)
Forex Trading Strategy for Beginners
Mastering Candlestick Pattern Analysis with the SMC Strategy for Day Trading
Mastering Risk Management: Stop Loss, Take Profit, and Position Sizing
How to Use Fibonacci to Set Targets & Stops (Complete Guide)
RSI Divergence Trading Strategy for Gold: How to Identify and Trade Trend Reversals
Stochastics Trading Secrets: How to Time Entries in Trending Markets using Stochastics
Gold Trading Stochastics Strategy: How to Trade Gold with 2R–3R Targets
RSI Hidden Divergence Explained: How to Spot Trend Continuations Like a Pro
How To Trade News
Why Smart Money Concepts Work in News-Driven Markets - CPI, NFP, and More
How to Trade NFP Using Smart Money Concepts (SMC)-A Proven Strategy for Forex Traders
How to Trade CPI Like Smart Money - A Step-by-Step Guide Using SMC
Learn How to Trade US Indices
How to Start Trading Indices and Get into the Stock Market with Low Capital (2026 Guide)
Best Indices to Trade for Day Traders | NASDAQ, S&P 500, DAX + Best Times to Trade Them
How To Trade & Scalp Indices at the Open Using Smart Money Concepts (SMC)
NAS100 - How to Trade the Nasdaq Like a Pro (Smart Money Edition)
How to Trade CPI Like Smart Money - A Step-by-Step Guide Using SMC
Why Smart Money Concepts Work in News-Driven Markets - CPI, NFP, and More
How to Start Trading Gold
How to Swing Trade Gold (XAU/USD) Using Smart Money Concepts: A Simple Guide for Traders
Complete Step-by-Step Guide to Day Trading Gold (XAU/USD) with Smart Money Concepts (SMC)
The Ultimate Guide to Backtesting and Trading Gold (XAU/USD) Using Smart Money Concepts (SMC)
Why Gold Remains the Ultimate Security in a Shifting World
How to Trade Japanese Candlesticks
How to Trade Candlestick Patterns with High Probability: A Complete Guide for Beginners
The Top Japanese Candlestick Guide: What is an Engulfing Pattern and How to Trade It?
Piercing Pattern Candlestick Explained: How to Trade It - Step-By-Step Guide
Morning & Evening Star Candlestick Patterns – How to Trade Market Reversals with Confidence
How to Start Day Trading
5 Steps to Start Day Trading: A Strategic Guide for Beginners
8 Steps How to Start Forex Day Trading in 2026: A Beginner’s Step-by-Step Guide
3 Steps to Build a Trading Routine for Consistency and Discipline - Day Trading Edition
The Ultimate Guide to Understanding Market Trends and Price Action
Trading with Momentum: The Best Trading Session to Trade Forex, Gold and Indices
Learn how to navigate yourself in times of turmoil
How to Identify Risk-On and Risk-Off Market Sentiment: A Complete Trader’s Guide
How to Trade Risk-On and Risk-Off Sentiment - With Technical Confirmation
The Ultimate Guide to Understanding Market Trends and Price Action
Want to learn how to trade like the Smart Money?
Why Smart Money Concepts Work: The Truth Behind Liquidity and Price Action
Mastering the Market with Smart Money Concepts: 5 Strategic Approaches
Mastering Candlestick Pattern Analysis with the SMC Strategy for Day Trading
Understanding Liquidity Sweep: How Smart Money Trades Liquidity Zones in Forex, Gold, US Indices
The SMC Playbook Series Part 4: How to Confirm Trend Reversal & Direction using SMC
The SMC Playbook Series Part 5: The Power of Multi-Timeframe Analysis in Smart Money Concepts (SMC)
Fair Value Gaps Explained: How Smart Money Leaves Footprints in the Market
The Best Time to Use Smart Money Concepts (SMC): Why Timing Is Everything in Trading SMC
How to Trade the London Session Using Smart Money Concepts (SMC)
Trading Psychology and Continuous Improvement Contents
The Mental Game of Execution - Debunking the Common Trading Psychology
5 Steps to Backtest a Trading Strategy with AI: A Step-by-Step Guide
Managing Trading Losses: Why You Can Be Wrong and Still Win Big in Trading
The Hidden Threat in Trading: How Performance Anxiety Sabotages Your Edge
Why You Fail in Trading: You Don’t Have Enough Capital to Survive
Why 90% of Retail Traders Fail Even with Profitable Trading Strategies
The Top 10 Best Trading Books That Changed My Mindset, Strategy & Performance
Discovering Your Trader Profile: What Kind of Trader Are You?
Follow me for more daily market insights!
Jasper Osita - LinkedIn - FXStreet - YouTube
This content may have been written by a third party. ACY makes no representation or warranty and assumes no liability as to the accuracy or completeness of the information provided, nor any loss arising from any investment based on a recommendation, forecast or other information supplies by any third-party. This content is information only, and does not constitute financial, investment or other advice on which you can rely.
Try These Next

