Simple Bitcoin Trading Strategy for Active Traders
2021-02-25 15:27:37


Today, we're going to look at a simple Bitcoin trading strategy ideal for active traders.
It goes without saying that active traders need volatility, and one of the places volatility has been running high is in the cryptocurrency space and, in particular, Bitcoin.
Bitcoin's volatility peaked from the 13th of January 2021, when it hit record highs and then briefly pulled back from those peaks.
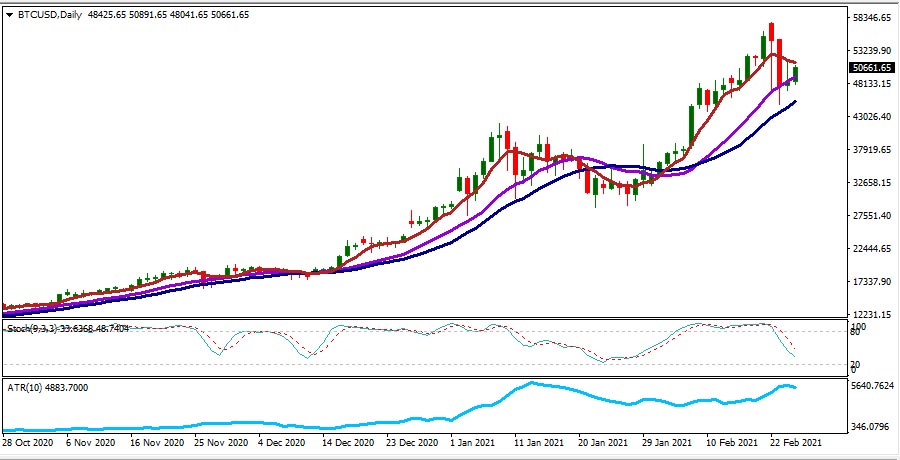
At one stage, Bitcoin was moving $5,064 per day on average. You will notice the Average True Range (ATR) indicator on the chart above.
That peak in volatility was on the 24th of February 2021. But we don't know how much higher it can go. The future is yet to be written ;-)
The simple Bitcoin trading strategy
The strategy we're going to have a look at today involves using three simple moving averages.
These three moving averages are simply a 5-period moving average, a 20-period moving average, and a 50-day moving average.
You can see the three simple moving averages below, applied to the hourly chart.
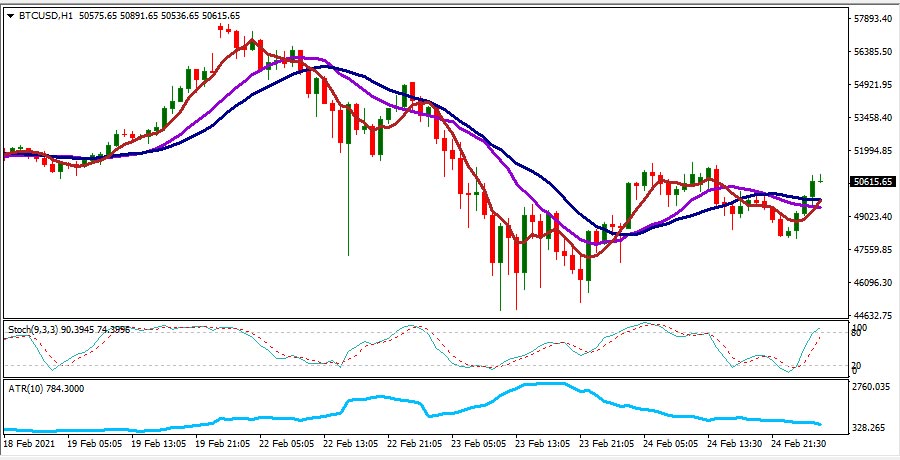
You could apply this to the daily chart but in this example, we will be focused on the hourly timeframe.
This means you'll get more signals, and the strategy can be tested across the hourly timeframe to see if it fits in with your risk tolerance and trading timeframes.
Why are we outlining such a simple moving average strategy across Bitcoin?
Well, first of all, we do want you to keep in mind that this is only a framework.
We suggest you use this framework as an idea generator.
What you want to do is see if the idea fits in with your timeframe and risk tolerance and the ability to get in and out of the market.
As you can appreciate, we all trade with our own biases, and those biases shape the way we trade.
For some of you, when you see this strategy, it will not resonate with you, and you will not want to trade this strategy.
For others, it might inspire some curiosity in what you could use as part of your trading strategies, or you could look to incorporate bits and pieces of this into your methodologies.
The Three Moving Averages
The three moving averages we're going to look to use, as mentioned before, are:
- 5-period simple moving average;
- 20-period simple moving average; and a
- 50-period moving average.
Typically, a moving average crossover system would be a simple 2 moving average system where you might have, say, just the 5 and the 20.
But what you'll tend to find over time is you need some qualification gates that stop you from entering low-probability trades.
Of course, we'd all like the highest probability trades with the lowest possible risk, but this is just a gentle way to get an understanding and, as mentioned, a framework around a methodology you can test to see if it fits in with your criteria.
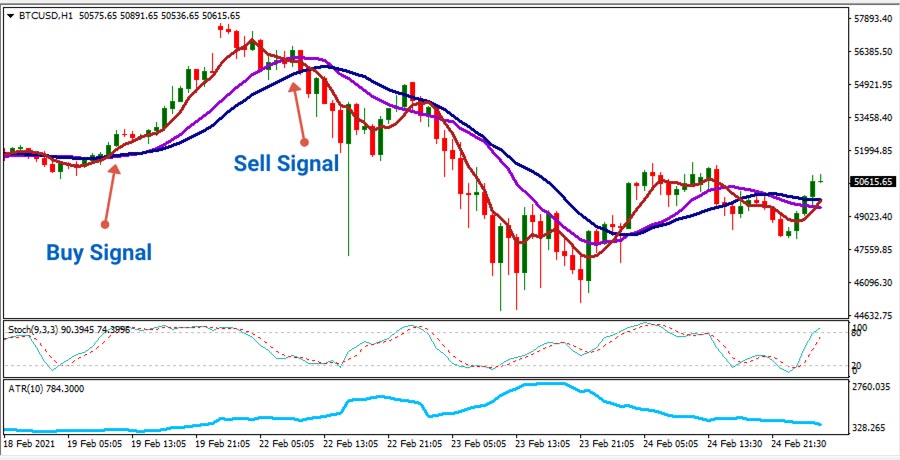
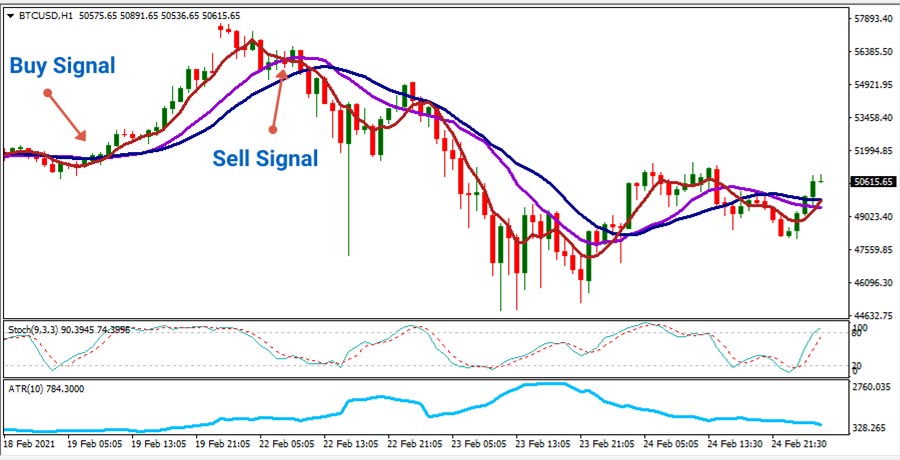
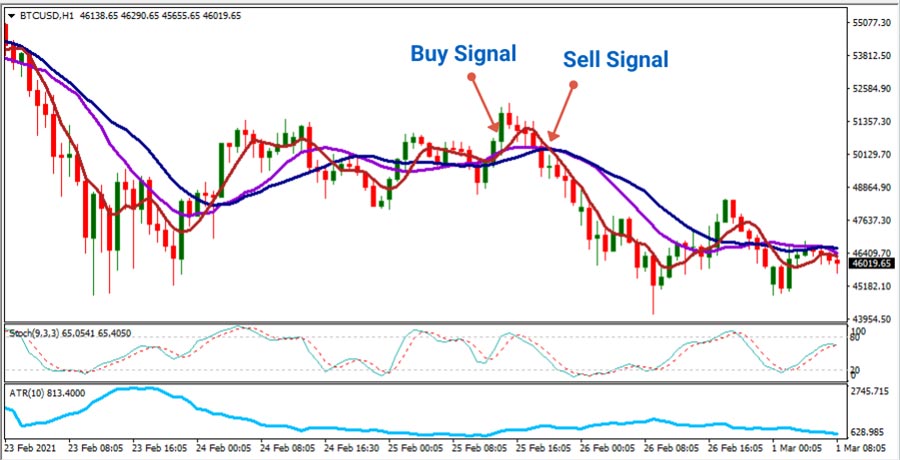
What we're going to look for is we want to see the 5-period moving average rising up through the 20-period moving average.
The 5-period is the maroon line. The 20-period is the pink line. The 50-period is the navy line.
We want to see the 5-period rising up through the 20-period in order to generate a buy signal.
And to keep things very simple, we're just going to wait for the cross to occur, so when the 5-period crosses back down below the 20-period moving average, that would be the exit.
Building a solid exit strategy
Of course, exits are extremely important for any trading system. Exits are when you lock in your profit or loss. So, it goes without saying, your exits are critical.
You might want to play around with more aggressive exits or more passive exits, depending on how much the market is trending.
As you can appreciate, moving averages are very slow-moving.
They are lagging indicators, so we're not going to be the first into any trend.
This particular strategy is looking to capture portions of the trend, and, of course, moving averages are great if you want a low-maintenance strategy that is not actively buying and selling all the time.
How to avoid getting chopped in and out using a moving average gate
Let's talk about the qualifying gate.
The qualifying gate is the 50-period moving average or the navy line.
What we want to do is we only want to take a long position when the 50-period moving average is rising today compared to yesterday.
Conversely, we only want to take a short position when the 50-period moving average is lower today compared to yesterday.
Combining the three moving averages to confirm an entry signal
Here is what a long entry signal will look like:
- The 50-period moving average (blue line) is rising today compared to yesterday.
- The 5-period moving average (brown line) has crossed the 20-period moving average (pink line).
Getting Whipsawed In and Out
By having a qualifying gate, it can help us eliminate getting whipsawed in and out and going long and short.
You see, the 50-period moving average is long enough, such that if we're in a long trade, we won't be able to take the short trade directly after.
Normal moving average systems are 'always in' meaning you go long when the short-term moving average crosses the longer moving average and then reverse to short when the short-term moving average crosses back below the longer-term moving average.
You're either long or you're short and you are always in.
But by having a qualifying gate, the goal is to qualify the trades to try and eliminate those where you might get whipsawed.
Time and price
When a market rallies, you have both time and price.
If it moves very quickly in price, then time has to catch up, and we usually see a consolidation period.
It's during those consolidations that moving average systems usually get you chopped in and chopped out, costing you brokerage (and time) along the way.
Example winning and losing trades
Let's look at a winning trade example of this and how we would have locked in profits.
Then we'll look at one losing trade where we would have exited at a loss, just so you can see both sides of the story.
Always keep in mind this is just a framework.
This is a framework you can potentially use or add to an existing trading strategy you might be using or use portions of it to test to see if it's worthwhile for you to pursue as a trading system on your live account.
Winning trade example
Hypothetical entry price long: 51710.69
Hypothetical exit price: 56117.40
Total win: 4406.71 or 8.52%
Losing trade example
Hypothetical entry price long: 56028.37
Hypothetical exit price: 53624.71
Total win: -2403.66 or -4.48%
Backtest all trading ideas before going live
One of the things we would recommend is backtesting any trading system before you commit your own funds to trading it.
You can backtest the system manually, but you need to make sure you get a large enough same size. A large enough sample size means a minimum of 20-30 completed trades based on the exact entry and exit criteria.
Alternatively, if you are good enough to code your own system test, you can test hundreds and hundreds of trades in minutes.
Your goal here is to run a system test to see if this strategy is producing a positive expectancy.
By positive expectancy, we simply mean there's an edge in the system to give you profitability over time. Another way to look at it, is that for every dollar you risk, you expect to make a small return above your initial outlay.
Remember to include sensible money management into your system
A couple of the other elements we haven't talked about in regard to this system is your money management rules.
Of course, you want to risk a small portion of your overall funds in any one trade, so do keep that in mind, as well, and build a money management system that helps you meet your financial objectives.
As you can see, the system itself is designed to capture the trend on an hourly chart, trading Bitcoin, and when it does trend, it enables you to lock in some good profits.
However, when it does get you out of the market and you have a loss on the trade, those losses aren't too severe.
Be sure to test these strategies on a demo account or paper trading before you go live.
This content may have been written by a third party. ACY makes no representation or warranty and assumes no liability as to the accuracy or completeness of the information provided, nor any loss arising from any investment based on a recommendation, forecast or other information supplied by any third-party. This content is information only, and does not constitute financial, investment or other advice on which you can rely.
Try These Next

