Unleashing the Power of Fibonacci Retracement in Forex Trading
2023-07-06 11:31:53


In the forex market, where trading is influenced by volatility and traders' sentiment, having reliable support and resistance levels is crucial. ACY Securities understands the significance of these levels, and that is why we provide valuable resources to help traders navigate the market effectively. While some traders rely on price action to identify potential support and resistance points, this method often requires more accuracy.
Fortunately, the Fibonacci retracement tool offers traders a powerful predictive tool that can be used to identify potential trading levels across various timeframes. In this comprehensive guide from ACY Securities, we will explore the intricacies of the Fibonacci retracement tool and delve into techniques for spotting optimal entry and exit points in forex trading.
By mastering Fibonacci retracement, traders can enhance their trading strategies and make informed decisions in the dynamic forex market.
Understanding Fibonacci Retracements in Forex Trading
Fibonacci retracements are derived from an infinite sequence of natural numbers known as the Fibonacci sequence. While widely used in various fields, including financial markets, we will focus on their application in forex trading. The Fibonacci sequence was discovered by Leonardo Pisano Bogolla, an Italian mathematician who observed a pattern within a sequence of numbers.
Starting with the second number, each subsequent number in the sequence is the sum of the previous two numbers. For instance, 2+1 equals 3, then 5, 8, 13, 21, and so on, indefinitely. This pattern serves as a fundamental building block for algorithms that automate trading activities in the financial markets.

A notable feature of the Fibonacci sequence is that when you divide a number by the immediately following number, the result is approximately 0.618 (e.g., 8 divided by 13 equals 0.6154). Similarly, dividing a number by the subsequent number yields a value close to 0.382 (e.g., 8 divided by 21 equals 0.381).
Technical analysis utilises these relationships by assuming that price movements in financial markets adhere to Fibonacci retracements based on the principles discovered by Fibonacci.
This information serves as a valuable tool for traders to identify potential support and resistance levels and make informed trading decisions in the dynamic world of forex trading.
Fibonacci Retracement Levels
The Fibonacci retracement is a widely used tool among technical traders in the forex market. It assists in identifying strategic points for placing trades, setting target prices, or determining stop losses. These levels, derived from the Fibonacci sequence, often serve as new support and resistance areas following significant price fluctuations. Unlike moving averages, Fibonacci retracement levels are typically static and remain unchanged, allowing traders to easily anticipate and pinpoint these crucial price points.
It is important to note that price fluctuations in the forex market are driven by market sentiment and the dynamics of supply and demand. Traders closely monitor these Fibonacci levels due to the high liquidity typically found in these areas. As more traders focus on these levels, liquidity tends to increase accordingly. Depending on their trading strategy, traders can utilize different Fibonacci lines as reference points for trade resets or target prices.
- 0.236 Fibonacci Retracement: This level suits high momentum trades, particularly when the trend exhibits high volume. It is important to avoid trading against other resistances in the forex market when utilizing this Fibonacci retracement level.
- 0.382 Fibonacci Retracement: Considered a relatively less significant level, the market typically moves towards the 0.5 Fibonacci Retracement level, making this level less influential in price action.
- 0.5 Fibonacci Retracement: The 0.5 Fibonacci retracement is widely regarded as the most important and effective retracement level among the Fibonacci tools. It represents the average movement, and many algorithms and traders utilize this level to initiate buying positions at half the price.
- 0.618 Fibonacci Retracement: When combined with the 0.5 Fibonacci retracement, the 0.618 retracement forms a powerful entry and exit level. The market often oscillates between 0.382 and 0.618 retracements, making it an ideal zone for optimal pullback trades.
- 0.786 Fibonacci Retracement: Considered one of the least significant retracements, the trend has often progressed considerably by the time the price reaches this level. Making a pullback trade at this level is generally not advisable, and entering the trend may be less profitable.
Calculating Fibonacci Retracement
The Fibonacci retracement tool is readily available on most major forex trading platforms, eliminating the need for manual calculations. Attempting to calculate Fibonacci levels manually would be unnecessary, as it is already well-established.
To understand Fibonacci retracement, we start with a number sequence that begins with zero and one, and each subsequent number is the sum of the two preceding numbers.
This sequence is known as the Fibonacci sequence, which looks like this: 0, 1, 1, 2, 3, 5, 8, 13, 21, 34, 55, 89, 144, 233, 377, 610, 987, and so on.
While the Fibonacci sequence itself is not directly applied to the chart, the Fibonacci retracement ratios are derived from these sequences. For example, dividing a number in the sequence by the next immediate Fibonacci number results in a ratio close to 0.618.
Similarly, dividing a number in the sequence by the number two places to the right gives a ratio close to 0.382. The Fibonacci retracement indicators use a formula to calculate the length of an upward or downward trend and divide it into four key levels.
By understanding the concept of Fibonacci retracement, forex traders can effectively utilise these ratios to identify potential levels of support and resistance.
How to Plot the Fibonacci Retracement Tool
Drawing the Fibonacci retracement tool is a straightforward process using the available tools. Here is a step-by-step guide:
1. Identify a completed trend you want to analyse using the Fibonacci retracement tool.
2. Locate the "Fibonacci retracement" charting tool, commonly found in various platforms such as the ACY Securities MT4 platforms and Finlogix.
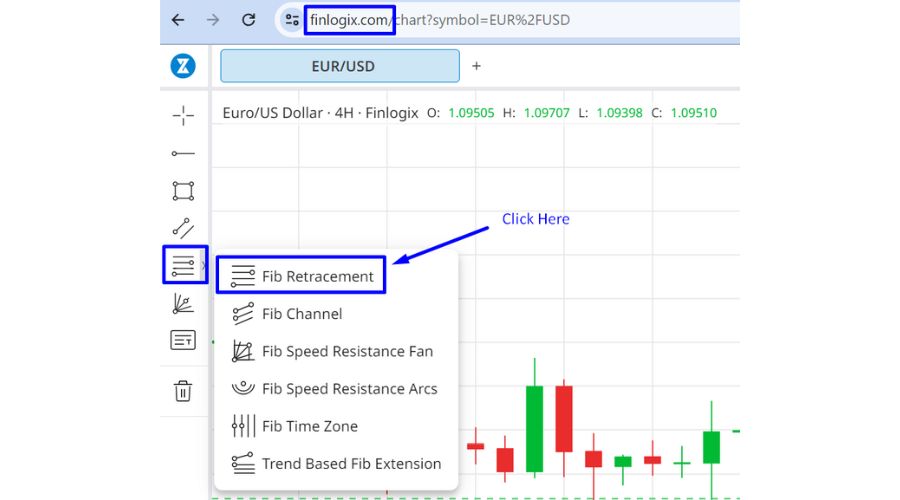
3. Click the Fibonacci retracement tool and ensure you click on the starting point of the trend (Point 1) and the ending point of the completed trend (Point 2).

4. Customise the visible levels to include the commonly used Fibonacci retracement levels: 23.6 percent, 38.2 percent, 61.8 percent, and 78.6 percent.

5. The Fibonacci retracement levels will now be displayed on the chart. Pay close attention to these levels, which can indicate potential reversal points during subsequent corrections.
By following these steps, traders can effectively plot the Fibonacci retracement tool on their forex charts and utilize it as a valuable tool for technical analysis.
How to Utilise Fibonacci Retracements in Forex Trading?
The Fibonacci retracement tool is a valuable addition to any forex trading strategy, providing buy or sell signals and indicating potential price targets. During an uptrend, the Fibonacci retracement levels can be utilized as buy signals when the market experiences pullbacks.
Conversely, in a bearish market, the golden ratio can identify short-selling opportunities when resistances reject a Fibonacci retracement level. To optimize entry and exit points, it is recommended to complement the Fibonacci retracement tool with momentum indicators such as stochastics or a MACD oscillator.
The Fibonacci ratios also serve as key support and resistance levels, depending on the market trend. These levels often result in short-term pullbacks before the trend resumes.
To confirm a trend, it is prudent to wait for the price to breach these levels again. Among the Fibonacci retracement levels, the most significant one is 0.618, the reciprocal of the Golden Ratio (1.618). This level holds psychological importance in the market and attracts significant trading activity.

In a bullish trend, the market often experiences peak greed at the 0.618 Fibonacci retracement level, leading to a temporary pullback as nervous traders sell their holdings. However, bargain hunters quickly re-enter the market, resuming the upward trend. The effectiveness of the Fibonacci retracement levels can be seen in the EUR/USD price chart below, where the market consistently respects these levels.
During a bearish trend, the 0.618 Fibonacci retracement level becomes a point of heightened fear in the market. It is at this level that nervous short sellers begin to exit their positions, causing a temporary pullback. However, as the buying pressure subsides, the sellers regain control, pushing the price further downward and continuing the bearish trend.

To confirm the continuation of the bearish trend, it is advisable to wait for the price to break below the 0.618 Fibonacci retracement level. This bearish scenario can be observed in the Bitcoin price chart below, where the market adheres to these patterns.
How to Confirm Fibonacci Retracement Trades
In the financial markets, Fibonacci ratios are valuable for identifying support and resistance levels, which can guide our entry and exit points in trades. While Fibonacci ratios are powerful on their own, it is recommended to incorporate other indicators into a trading strategy to validate trades effectively.
To validate Fibonacci retracement trades, it is advisable to use oscillators like the RSI, MACD, and Stochastics indicators. Candlestick analysis can also complement Fibonacci levels and assist in determining whether a specific Fibonacci level will hold.

For example, consider the EUR/USD pair on a 4-hour time frame chart. Initially, the pair showed an uptrend but entered the overbought zone, leading to a retracement.
In the chart, we can observe that EUR/USD completed a 38.2% Fibonacci retracement and closed a Doji candle above this ratio, suggesting that sellers were losing momentum. Subsequently, a bullish engulfing candle formed, triggering a strong uptrend. To forecast the length of the uptrend, Fibonacci extensions can be employed. These tools provide valuable insights for planning trades.
In conclusion, combining Fibonacci retracement with other indicators and utilising candlestick analysis can enhance the validation of trades. It is essential to apply a comprehensive approach to make informed decisions in the dynamic world of financial markets.
Final thoughts
Fibonacci retracements are an incredibly versatile tool for crypto traders, allowing them to identify potential entry and exit levels. However, it is important to note that retracements alone do not guarantee a successful trade with 100% certainty. To enhance their effectiveness, it is advisable to confirm the validity of Fibonacci retracements by combining them with other reliable technical indicators or analysing candlestick patterns.
By incorporating additional indicators or studying candlestick patterns, traders can gather more comprehensive information and increase the accuracy of their trading decisions. This helps in minimizing risks and maximizing potential profits. Remember, trading is a dynamic process that requires continuous learning and adaptation.
If you found this article useful and interesting, you can read more valuable educational content at our website.
Try These Next

