NASDAQ on the Edge: AI Boom Meets Government Shutdown - Next Big Move Loading…
2025-10-15 12:33:08


- The Nasdaq 100 is trapped between the AI investment boom fueling optimism and a government shutdown freezing key U.S. data - a tug-of-war that could define Q4’s direction.
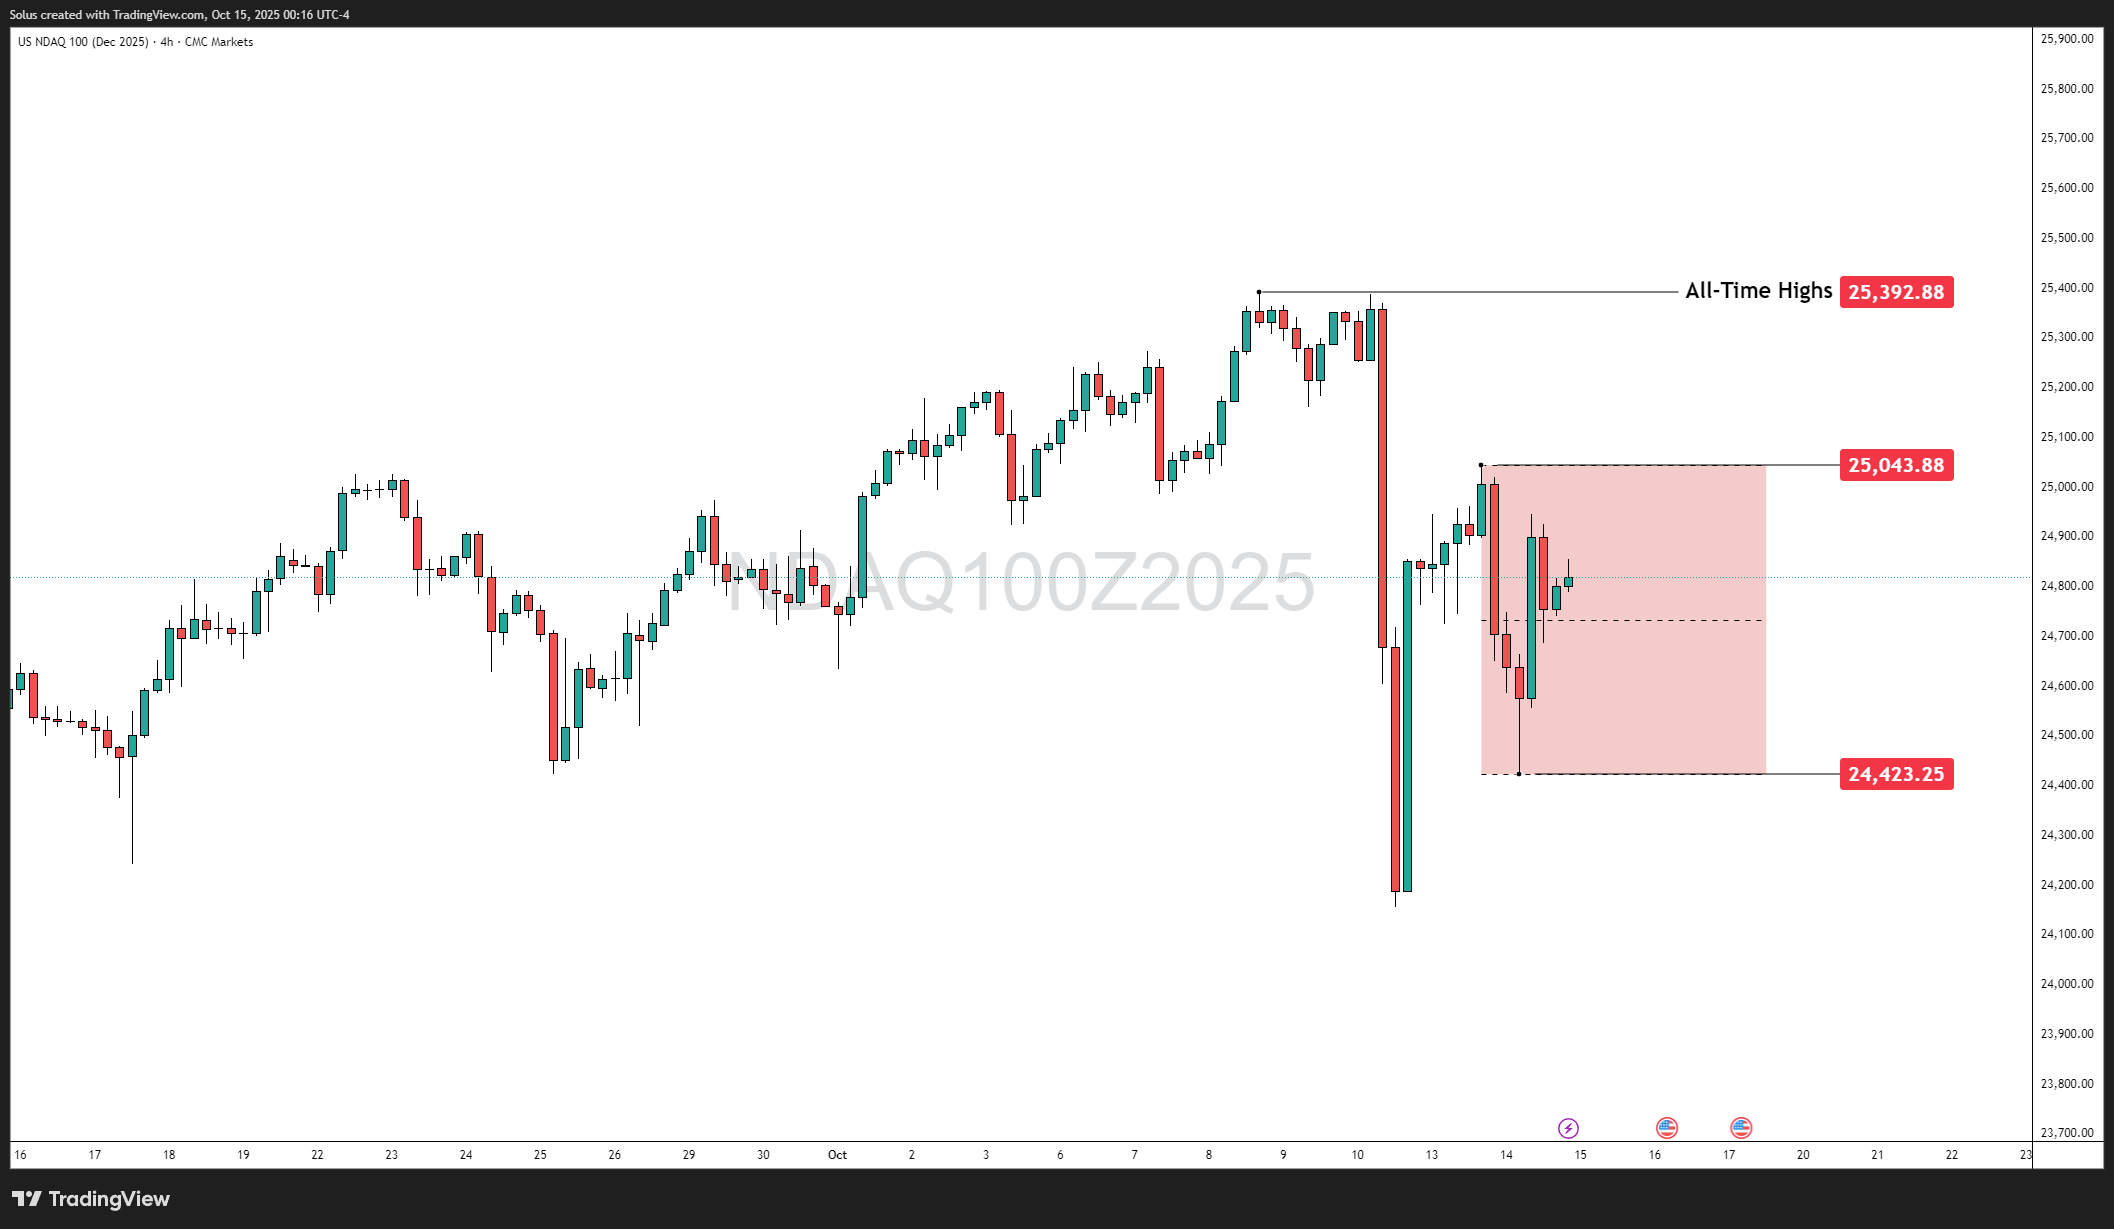
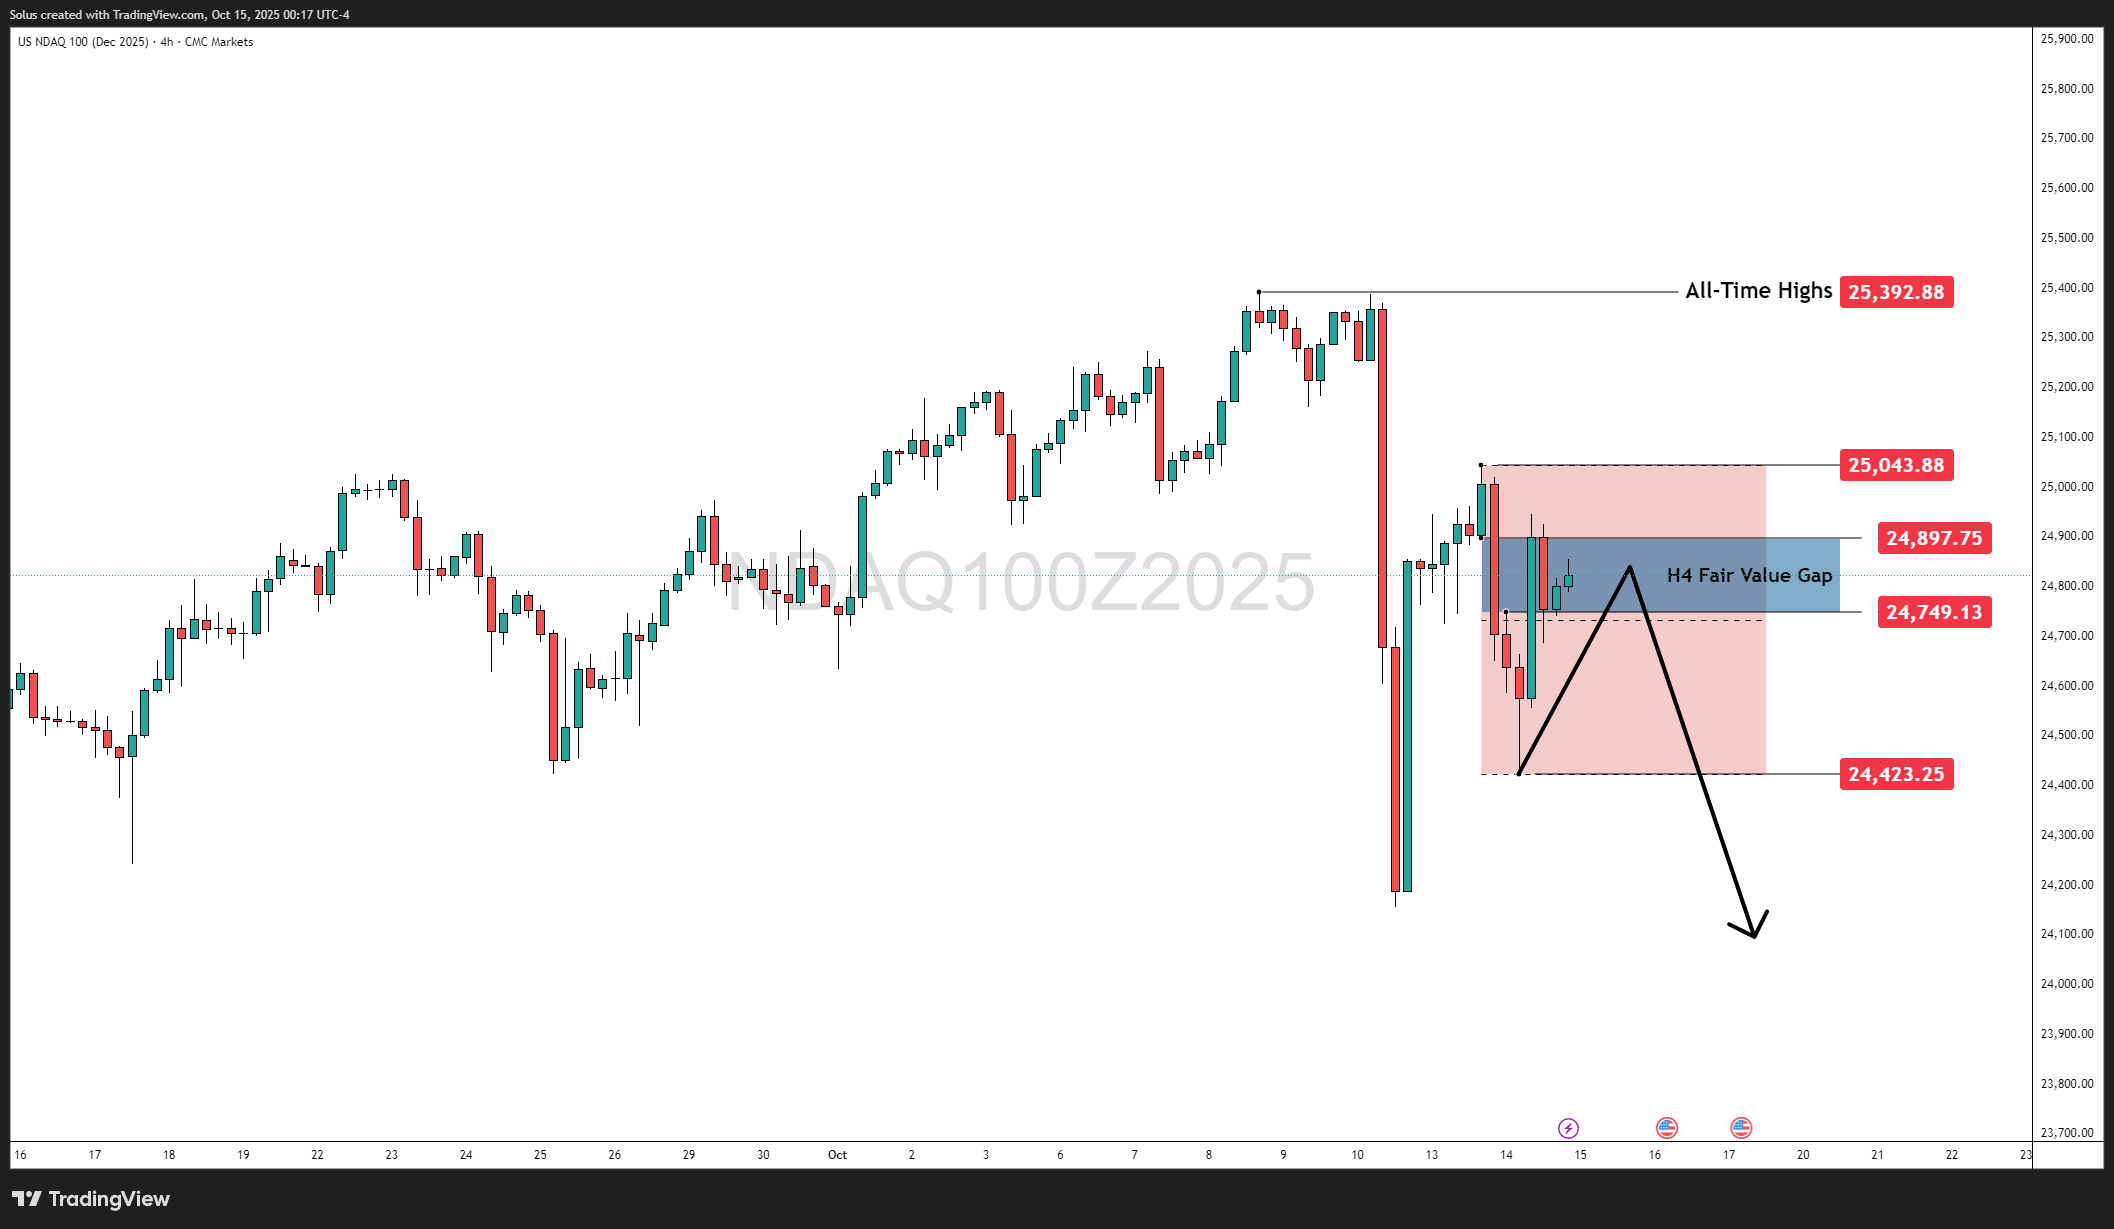
- Price action has stabilized after last week’s 4% drop, hovering around a key decision zone near 24,900, inside an H4 Fair Value Gap.
- Breakout above 25,043 could target new all-time highs; breakdown below 24,423 may reopen a sharp correction toward 24,000.
AI Investment Boom Keeps Growth Afloat - For Now
The International Monetary Fund (IMF) recently upgraded its U.S. growth outlook to ~2% for 2025, citing the AI investment boom as a crucial buffer against slowing global demand. Massive spending on chips, data centers, and digital infrastructure has kept U.S. output surprisingly resilient.
But there’s a catch: the same growth engine could also be a bubble in disguise. The IMF warned that AI-related valuations may have outpaced fundamentals, echoing the same patterns seen during the dot-com era. If sentiment flips, overextended tech stocks could unwind rapidly.
Institutions are taking notice. A Bank of America survey showed fund managers now view an “AI bubble burst” as the top tail risk for markets. And while corporate earnings have remained robust, analysts fear productivity gains may not fully justify current valuations.
Shutdown Adds a New Layer of Risk
As AI propels optimism, the ongoing U.S. government shutdown is working in the opposite direction - freezing critical economic data releases and shaking investor confidence.
With reports like CPI and retail sales on hold, traders are flying blind. The lack of transparency means the Federal Reserve’s path toward rate cuts or policy shifts has grown uncertain. For high-beta sectors like tech, this uncertainty amplifies volatility.
Institutional flows show defensive positioning ahead of earnings season, as investors brace for potentially distorted data and policy misreads. In short: the AI narrative fuels hope, but the shutdown fuels hesitation - leaving Nasdaq’s next move hanging in the balance.
Nasdaq 100 Balances on a Knife’s Edge
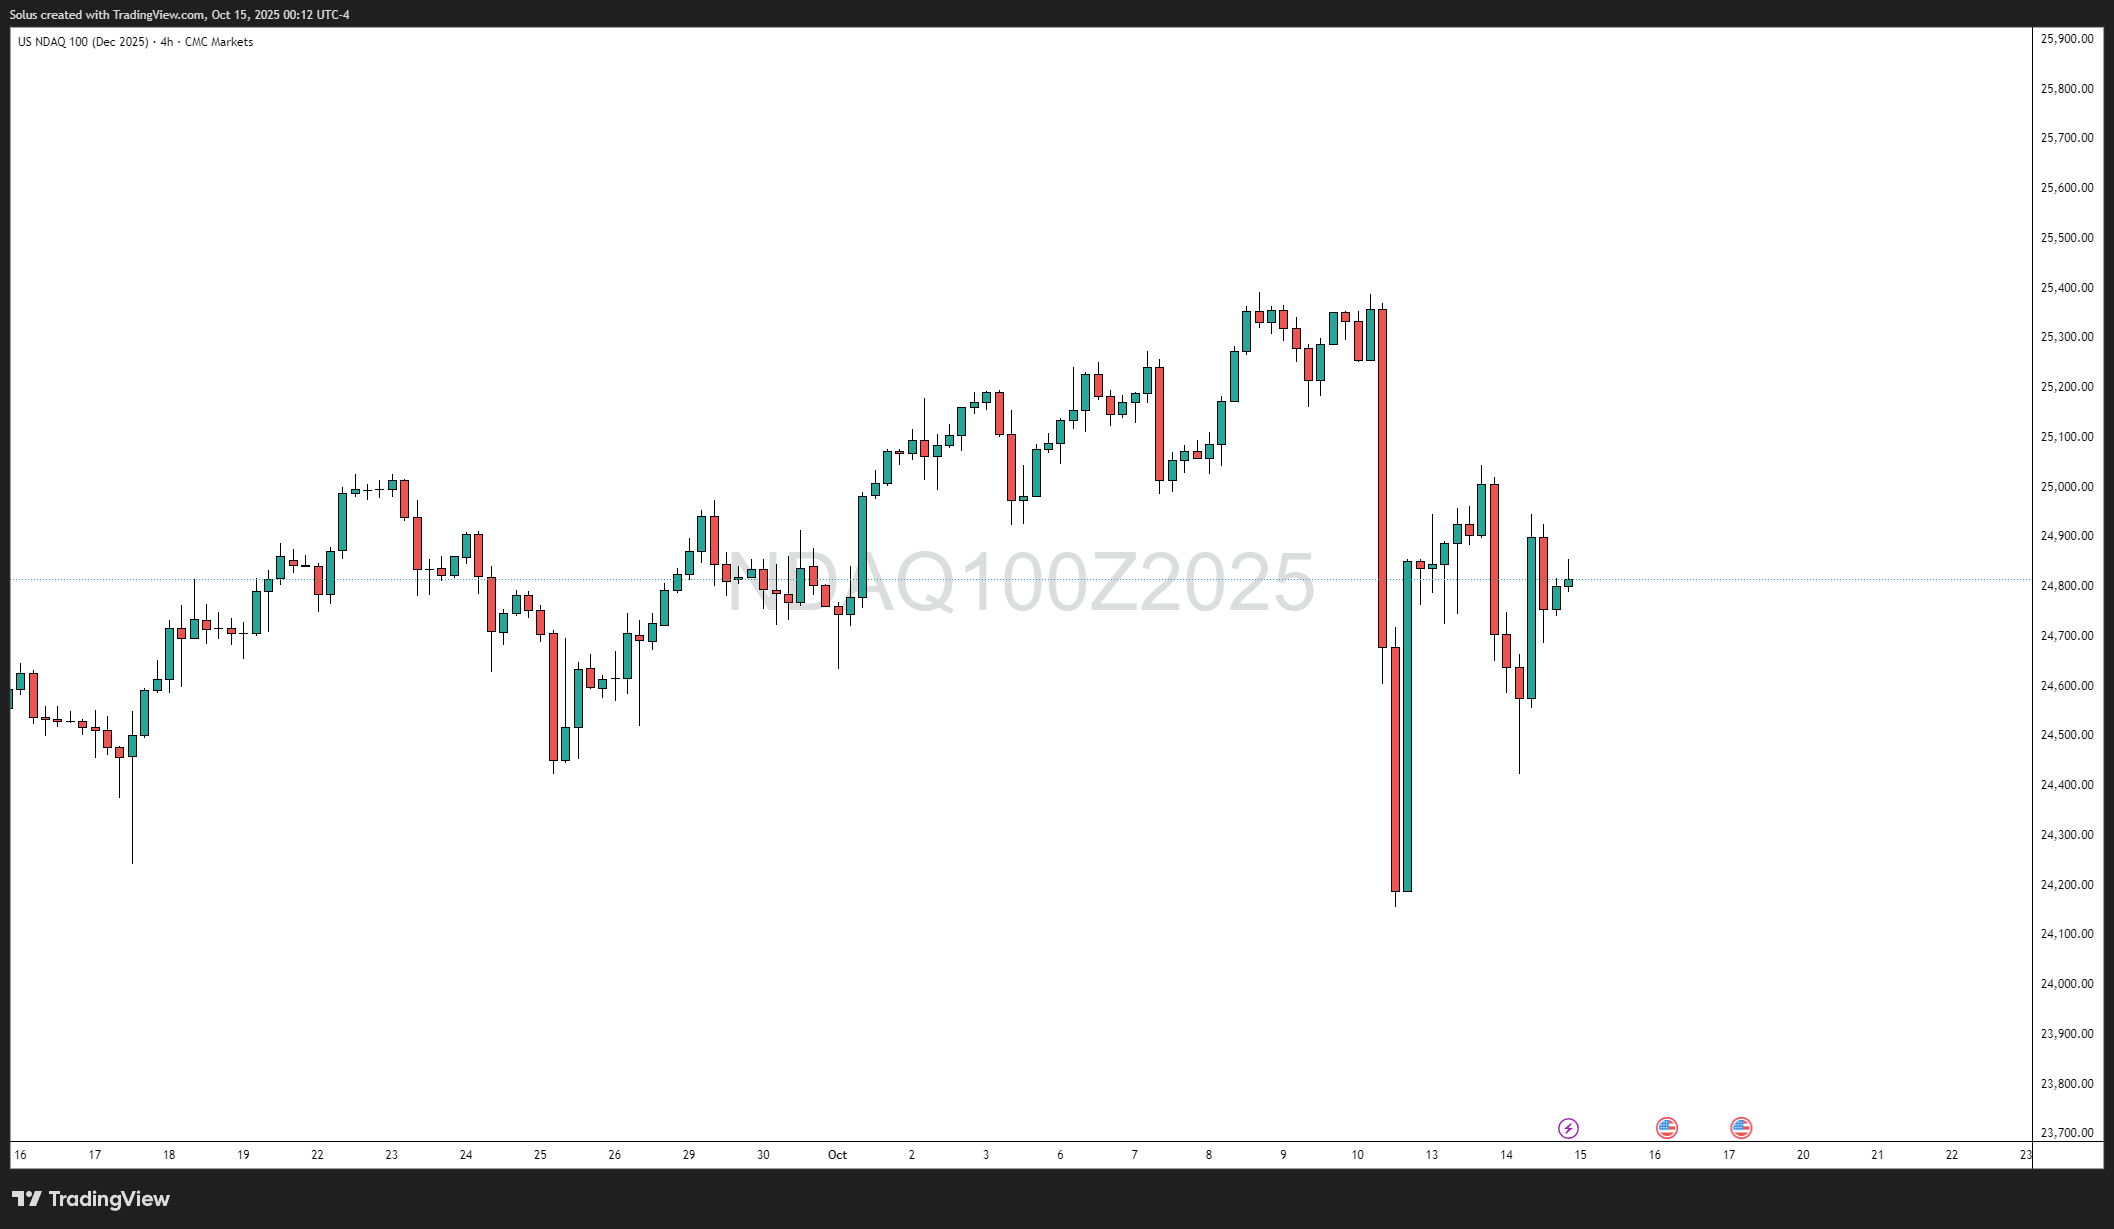
The Nasdaq 100 (Dec 2025 Futures) has been oscillating between relief rallies and corrective pullbacks after last week’s tariff-driven panic. The latest 4-hour structure highlights a tight range between 24,423 and 25,043, carved by volatility shocks from both political and economic catalysts.
Despite short-term recovery, traders remain cautious as liquidity thins and momentum slows near the H4 Fair Value Gap.
Currently, the market’s technical equilibrium mirrors the macro divide - optimism fueled by AI versus fear of a prolonged policy paralysis.
Technical Outlook - Nasdaq 100 (Dec 2025 Futures)
The 4H chart now reveals a clear Fair Value Gap (FVG) between 24,749 – 24,897, acting as the central decision zone for intraday traders.
This gap serves as the battleground where short-term bullish intent meets broader macro caution.
Price remains inside the FVG, showing early attempts at recovery but without follow-through momentum. The next breakout or rejection from this zone will likely determine whether the Nasdaq resumes its climb or extends its correction.
| Zone | Level | Bias | Description |
|---|---|---|---|
| H4 Fair Value Gap | 24,749 – 24,897 | Neutral | Short-term decision zone |
| Range High | 25,043 | Bullish target | Breakout zone for continuation |
| Range Low / Liquidity Pivot | 24,423 | Bearish target | Breakdown confirmation |
| All-Time Highs | 25,392 | Extension target | Full bullish expansion zone |
Bullish Scenario: FVG Reclaim and Expansion
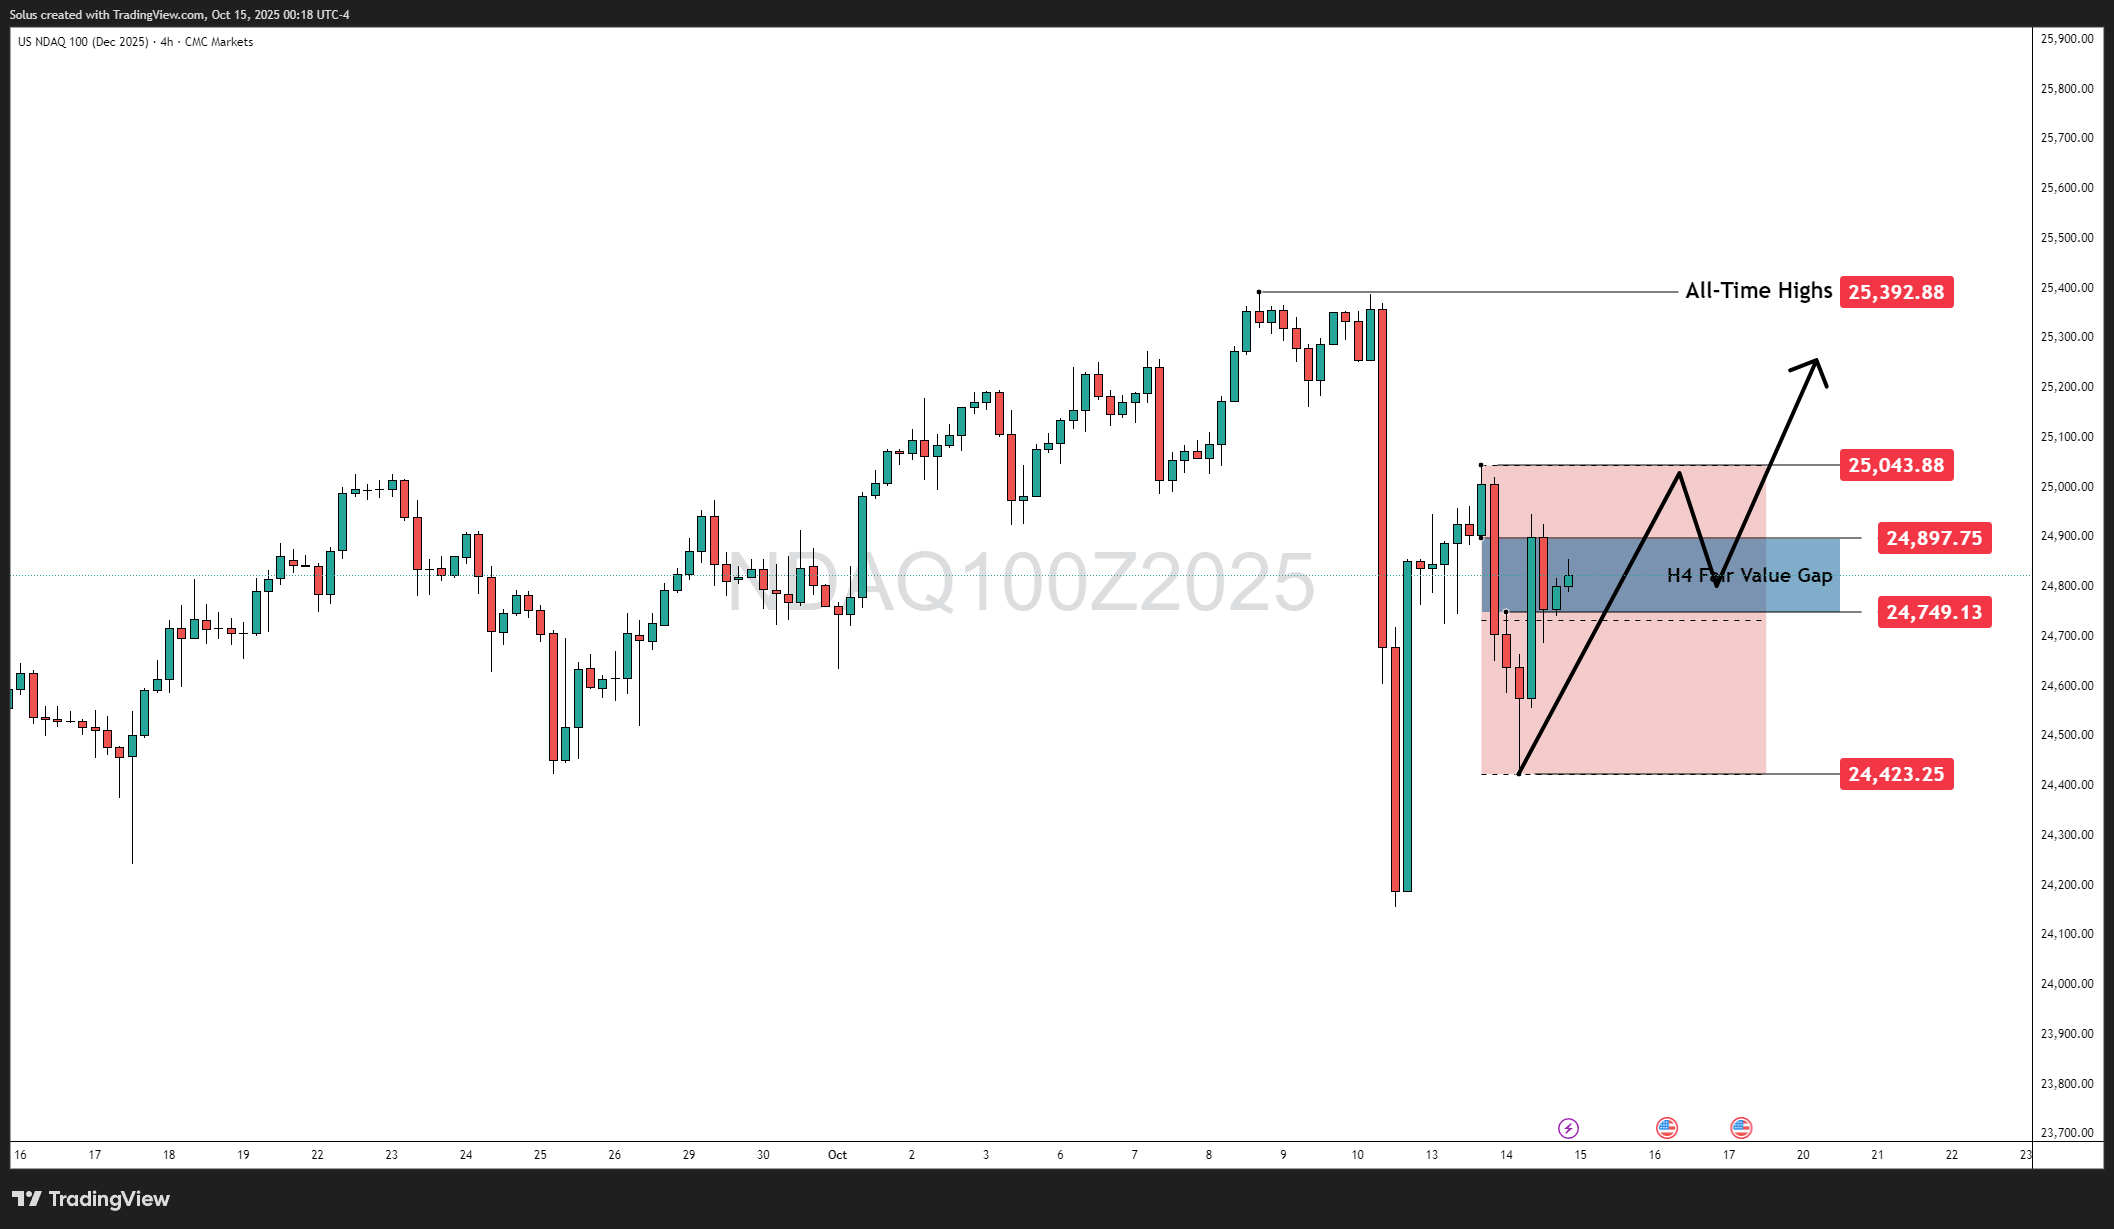
If bulls manage to defend the FVG and reclaim the upper bound at 24,900, Nasdaq could extend higher toward the 25,043 range high. A confirmed breakout may lead to further expansion toward the all-time highs at 25,392, effectively filling the prior imbalance.
Triggers for bullish continuation:
- A firm 4H close above 24,900–25,043, signaling absorption of selling pressure.
- Positive headlines on AI investment or any progress on ending the shutdown.
- Renewed dovish commentary from Fed officials stabilizing risk sentiment.
Targets: 25,043 → 25,392 → 25,600
Invalidation: 4H close below 24,749 reopens bearish control.
This path suggests traders are betting that AI’s fiscal strength will outweigh political gridlock.
Bearish Scenario: FVG Rejection and Liquidity Sweep
If the FVG fails to hold and price rejects near 24,900, bears could regain control - driving a retest of the 24,423 liquidity zone. A breakdown below that level may trigger a larger corrective leg toward 24,000–23,850.
Triggers for bearish continuation:
- Rejection candle near the upper FVG boundary (~24,900).
- Shutdown extension headlines or renewed tariff rhetoric.
- Breakdown below 24,423 confirming liquidity sweep and bearish momentum.
Targets: 24,423 → 24,000 → 23,850
Invalidation: 4H close above 24,900 nullifies bearish structure.
This scenario aligns with risk-off positioning and macro uncertainty persisting through October.
Final Thoughts: Tension Between Hope and Fear
The Nasdaq sits in a tug-of-war between structural optimism and macro fear.
The AI boom is the market’s engine - but the shutdown and inflation uncertainty are its brakes.
Price compression within the H4 Fair Value Gap signals that volatility is loading, not fading. The next clean break above 25,043 or below 24,423 could set the tone for the rest of the month.
Until then, traders should expect sharp whipsaws and reactive liquidity hunts as markets process each new headline from Washington and Wall Street alike.
Start Practicing with Confidence - Risk-Free!
- Trade forex, indices, gold, and more
- Access ACY, MT4, MT5, & Copy Trading Platforms
- Practice with zero risk
It’s time to go from theory to execution - risk-free.
Create an Account. Start Your Free Demo!
Check Out My Contents:
Strategies That You Can Use
Looking for step-by-step approaches you can plug straight into the charts? Start here:
- How To Trade & Scalp Indices at the Open Using Smart Money Concepts (SMC)
- How to Trade Breakouts Effectively in Day Trading with Smart Money Concepts
- Complete Step-by-Step Guide to Day Trading Gold (XAU/USD) with Smart Money Concepts (SMC)
- The Power of Multi-Timeframe Analysis in Smart Money Concepts (SMC)
- Forex Trading Strategy for Beginners
- Mastering Candlestick Pattern Analysis with the SMC Strategy for Day Trading
- How to Use Fibonacci to Set Targets & Stops (Complete Guide)
- RSI Divergence Trading Strategy for Gold: How to Identify and Trade Trend Reversals
- Stochastics Trading Secrets: How to Time Entries in Trending Markets using Stochastics
- Gold Trading Stochastics Strategy: How to Trade Gold with 2R - 3R Targets
- RSI Hidden Divergence Explained: How to Spot Trend Continuations Like a Pro
- Moving Averages Trading Strategy Playbook
- Mastering Fibonacci Trading Psychology - Trusting the Levels, Managing the Mind
- Mastering Price Action at Key Levels - How to Spot, Trade, and Win at the Most Crucial Zones
- Mastering Retests: How to Enter with Confirmation After a Breakout
Indicators / Tools for Trading
Sharpen your edge with proven tools and frameworks:
- The Ultimate Guide to Risk Management in Trading - A Complete Compilation for 2026
- Moving Averages Trading Strategy Playbook
- How to Think Like a Price Action Trader
- Mastering Fibonacci Trading Psychology - Trusting the Levels, Managing the Mind
How To Trade News
News moves markets fast. Learn how to keep pace with SMC-based playbooks:
- Why Smart Money Concepts Work in News-Driven Markets - CPI, NFP, and More
- How to Trade NFP Using Smart Money Concepts (SMC)-A Proven Strategy for Forex Traders
- How to Trade CPI Like Smart Money - A Step-by-Step Guide Using SMC
Learn How to Trade US Indices
From NASDAQ opens to DAX trends, here’s how to approach indices like a pro:
- How to Start Trading Indices and Get into the Stock Market with Low Capital (2026 Guide)
- Best Indices to Trade for Day Traders | NASDAQ, S&P 500, DAX + Best Times to Trade Them
- How To Trade & Scalp Indices at the Open Using Smart Money Concepts (SMC)
- NAS100 - How to Trade the Nasdaq Like a Pro (Smart Money Edition)
How to Start Trading Gold
Gold remains one of the most traded assets - - here’s how to approach it with confidence:
- How to Swing Trade Gold (XAU/USD) Using Smart Money Concepts: A Simple Guide for Traders
- Complete Step-by-Step Guide to Day Trading Gold (XAU/USD) with Smart Money Concepts (SMC)
- The Ultimate Guide to Backtesting and Trading Gold (XAU/USD) Using Smart Money Concepts (SMC)
- Why Gold Remains the Ultimate Security in a Shifting World
- How to Exit & Take Profits in Trading Gold Like a Pro: Using RSI, Range Breakdowns, and MAs as Your Confluence
How to Trade Japanese Candlesticks
Candlesticks are the building blocks of price action. Master the most powerful ones:
- Mastering the Top Japanese Candlesticks: The Top 5 Candlesticks To Trade + Top SMC Candlestick Pattern
- How to Trade Candlestick Patterns with High Probability: A Complete Guide for Beginners
- The Top Japanese Candlestick Guide: What is an Engulfing Pattern and How to Trade It?
- Piercing Pattern Candlestick Explained: How to Trade It - Step-By-Step Guide
- Morning & Evening Star Candlestick Patterns - How to Trade Market Reversals with Confidence
How to Start Day Trading
Ready to go intraday? Here’s how to build consistency step by step:
- 5 Steps to Start Day Trading: A Strategic Guide for Beginners
- 8 Steps How to Start Forex Day Trading in 2026: A Beginner’s Step-by-Step Guide
- 3 Steps to Build a Trading Routine for Consistency and Discipline - Day Trading Edition
- The Ultimate Guide to Understanding Market Trends and Price Action
- Trading with Momentum: The Best Trading Session to Trade Forex, Gold and Indices
Learn how to navigate yourself in times of turmoil
Markets swing between calm and chaos. Learn to read risk-on vs risk-off like a pro:
- How to Identify Risk-On and Risk-Off Market Sentiment: A Complete Trader’s Guide
- How to Trade Risk-On and Risk-Off Sentiment - With Technical Confirmation
- The Ultimate Guide to Understanding Market Trends and Price Action
Want to learn how to trade like the Smart Money?
Step inside the playbook of institutional traders with SMC concepts explained:
- Why Smart Money Concepts Work: The Truth Behind Liquidity and Price Action
- Mastering the Market with Smart Money Concepts: 5 Strategic Approaches
- Understanding Liquidity Sweep: How Smart Money Trades Liquidity Zones in Forex, Gold, US Indices
- The SMC Playbook Series Part 1: What Moves the Markets? Key Drivers Behind Forex, Gold & Stock Indices
- The SMC Playbook Series Part 2: How to Spot Liquidity Pools in Trading-Internal vs External Liquidity Explained
- Fair Value Gaps Explained: How Smart Money Leaves Footprints in the Market
- Accumulation, Manipulation, Distribution: The Hidden Cycle That Runs Every Market
- Institutional Order Flow - Reading the Market Through the Eyes of the Big Players
- London Session Trading Secrets: How Smart Money Sets the High & Low of the Day
- Mastering the New York Session - Smart Money Concepts Guide
Master the World’s Most Popular Forex Pairs
Forex pairs aren’t created equal - - some are stable, some are volatile, others tied to commodities or sessions.
- The Top 5 All-Time Best Forex Pairs to Trade
- Top Forex Pairs Beyond the Big Five
- EUR/USD: The King of Forex
- USD/JPY: The Fast Mover
- GBP/USD: The Volatile Cable
- AUD/USD: The Commodity Currency
- USD/CAD: The Oil-Backed Pair
- GBP/JPY: How to Trade The Beast
- Asian & London Session Secrets
- Mastering the New York Session
Stop Hunting 101
If you’ve ever been stopped out right before the market reverses - - this is why:
- Stop Hunting 101: How Swing Highs and Lows Become Liquidity Traps
- Outsmarting Stop Hunts: The Psychology Behind the Trap
- How to Lessen Risk From Stop Hunts in Trading
- How Stop Hunts Trigger Revenge Trading - Breaking the Pain Cycle
- How to Accept Stop Hunts Without Losing Discipline - Shifting From Frustration to Focus
Trading Psychology
Mindset is the deciding factor between growth and blowups. Explore these essentials:
- The Mental Game of Execution - Debunking the Common Trading Psychology
- Managing Trading Losses: Why You Can Be Wrong and Still Win Big in Trading
- The Hidden Threat in Trading: How Performance Anxiety Sabotages Your Edge
- Why 90% of Retail Traders Fail Even with Profitable Trading Strategies
- Top 10 Habits Profitable Traders Follow Daily to Stay Consistent
- Top 10 Trading Rules of the Most Successful Traders
- Top 10 Ways to Prevent Emotional Trading and Stay Disciplined in the Markets
- Why Most Traders Fail - Trading Psychology & The Hidden Mental Game
- Emotional Awareness in Trading - Naming Your Triggers
- Discipline vs. Impulse in Trading - Step-by Step Guide How to Build Control
- Trading Journal & Reflection - The Trader’s Mirror
- Overcoming FOMO & Revenge Trading in Forex - Why Patience Pays
- Risk of Ruin in Trading - Respect the Math of Survival
- Identity-Based Trading: Become Your Trading System for Consistency
- Trading Psychology: Aligning Emotions with Your System
- Mastering Fear in Trading: Turn Doubt into a Protective Signal
- Mastering Greed in Trading: Turn Ambition into Controlled Growth
- Mastering Boredom in Trading: From Restless Clicking to Patient Precision
- Mastering Doubt in Trading: Building Confidence Through Backtesting and Pattern Recognition
- Mastering Impatience in Trading: Turn Patience Into Profit
- Mastering Frustration in Trading: Turning Losses Into Lessons
- Mastering Hope in Trading: Replacing Denial With Discipline
- When to Quit on Trading - Read This!
- The Math of Compounding in Trading
- Why Daily Wins Matter More Than Big Wins
- Scaling in Trading: When & How to Increase Lot Sizes
- Why Patience in Trading Fuels the Compounding Growth
- Step-by-Step Guide on How to Manage Losses for Compounding Growth
- The Daily Habits of Profitable Traders: Building Your Compounding Routine
- Trading Edge: Definition, Misconceptions & Casino Analogy
- Finding Your Edge: From Chaos to Clarity
- Proving Your Edge: Backtesting Without Bias
- Forward Testing in Trading: How to Prove Your Edge Live
- Measuring Your Edge: Metrics That Matter
- Refining Your Edge: Iteration Without Overfitting
- The EDGE Framework: Knowing When and How to Evolve as a Trader
- Scaling Your Edge: From Small Account to Consistency
Market Drivers
- Central Banks and Interest Rates: How They Move Your Trades
- Inflation & Economic Data: CPI Trading Strategy and PPI Indicator Guide
- Geopolitical Risks & Safe Havens in Trading (Gold, USD, JPY, CHF)
- Jobs, Growth & Recession Fears: NFP, GDP & Unemployment in Trading
- Commodities & Global Trade: Oil, Gold, and Forex Explained
- Market Correlations & Intermarket Analysis for Traders
Swing Trading 101
- Introduction to Swing Trading
- The Market Basics for Swing Trading
- Core Principles of Swing Trading
- The Technical Foundations Every Swing Trader Must Master
- Swing Trader’s Toolkit: Multi-Timeframe & Institutional Confluence
- The Psychology of Risk Management in Swing Trading
- Swing Trading Concepts To Know In Trading with Smart Money Concepts
Risk Management
The real edge in trading isn’t strategy - it’s how you protect your capital:
- Mastering Risk Management: Stop Loss, Take Profit, and Position Sizing
- Why Risk Management Is the Only Edge That Lasts
- How Much Should You Risk per Trade? (1%, 2%, or Less?)
- The Ultimate Risk Management Plan for Prop Firm Traders - Updated 2026
- Mastering Position Sizing: Automate or Calculate Your Risk Like a Pro
- Martingale Strategy in Trading: Compounding Power or Double-Edged Sword?
- How to Add to Winners Using Cost Averaging and Martingale Principle with Price Confirmation
Suggested Learning Path
If you’re not sure where to start, follow this roadmap:
- Start with Trading Psychology → Build the mindset first.
- Move into Risk Management → Learn how to protect capital.
- Explore Strategies & Tools → Candlesticks, Fibonacci, MAs, Indicators.
- Apply to Assets → Gold, Indices, Forex sessions.
- Advance to Smart Money Concepts (SMC) → Learn how institutions trade.
- Specialize → Stop Hunts, News Trading, Turmoil Navigation.
This way, you’ll grow from foundation → application → mastery, instead of jumping around randomly.
Follow me for more daily market insights!
Jasper Osita - LinkedIn - FXStreet - YouTube
This content may have been written by a third party. ACY makes no representation or warranty and assumes no liability as to the accuracy or completeness of the information provided, nor any loss arising from any investment based on a recommendation, forecast or other information supplies by any third-party. This content is information only, and does not constitute financial, investment or other advice on which you can rely.
Try These Next

