Price Action Analysis for GBPCAD Trade: A Potential Trade for This Week or Next Week?
2026-04-01 11:20:34


Key Takeaways:
- Current Momentum: The pair shows a strong bearish market structure near 1.115114.
- Weekly Resistance: Prices are heavily respecting the 1.15135 to 1.15528 zone.
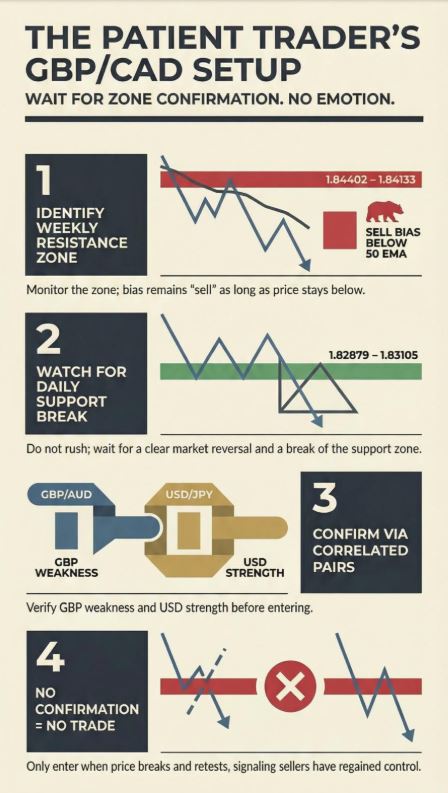
- Action Plan: Wait for a confirmed rejection at weekly resistance before entering a position.
- Trade Target: A successful daily retest could push the price just above 1.14168.
What is the Best Strategy for a GBP/USD Day Trade?

When I look at the charts right now… it’s clear.
The market structure? Bearish.
Sellers? They’re in full control… driving the price down.
So, here’s the deal… don’t just jump in.
Wait for the price to break…
Then retest a key daily resistance zone.
That’s your sweet spot.
This Simple price analysis on GBP/CAD day trade setup this weekly or next week? Honestly… it works like magic.
It stops you from making impulsive trades… from trading on pure emotion.
Stick to the rules…
Trade with real market structure…
And over time, the market proves itself.
No guessing. No hoping. Just following the rules worth to follow before entering a trade.
How Does the Weekly Chart Look for GBP/CAD Price Action?
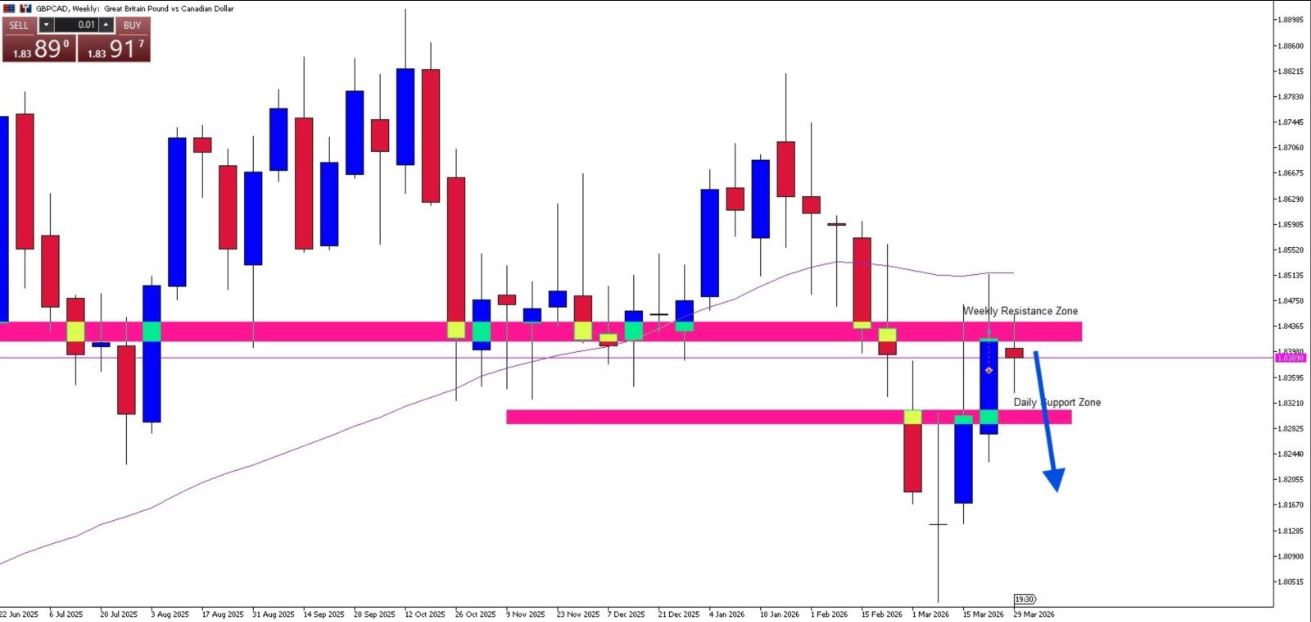
When I look at GBP/CAD on the weekly timeframe, the story is pretty straightforward; the market is still clearly bearish.
Overall, the price is just moving down, and sellers are still in control.
Right now, we’re seeing what looks like a final push up, potentially forming a lower high. Based on simple price action, this could be set up for a retest and possible rejection of that weekly resistance zone 1.84402 - 1.84133.
As long as price stays below that strong resistance area; and also below the 50 EMA indicator; nothing really changes. The bias is still clean: we’re looking for sells.
What is GBP/CAD Daily Support Zone Showing Us Right Now?
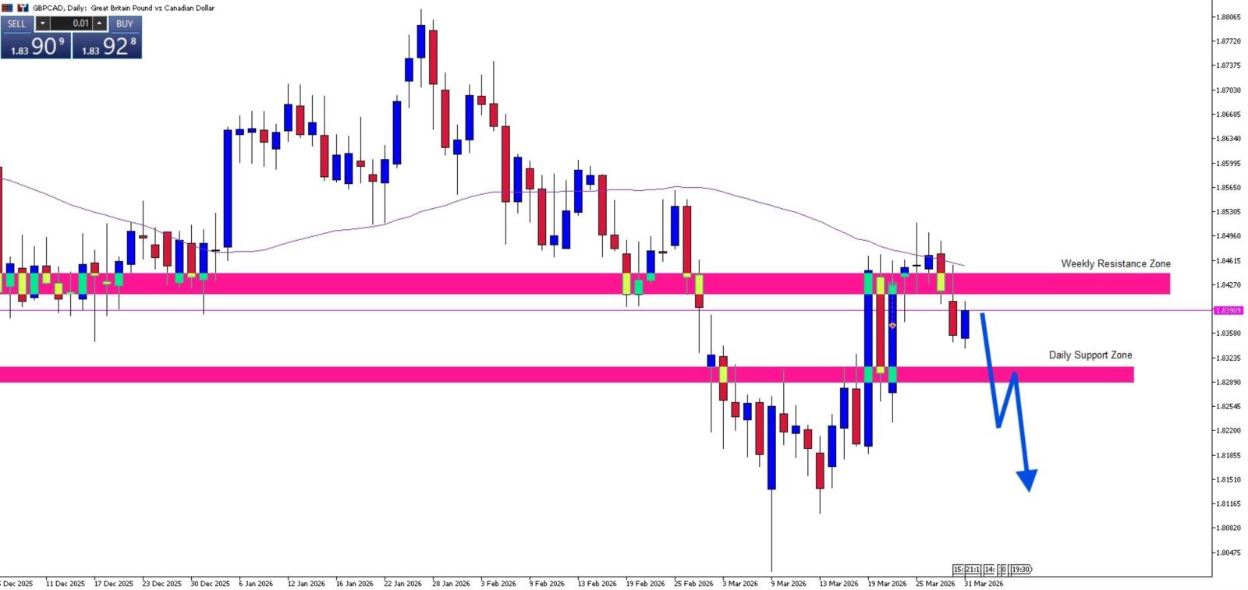
On the Daily chart, the market is still clearly bullish, meaning buyers are in control.
However, don’t rush into trade.
Only consider entering if:
Price break and retest on the daily support zone and make it as a daily resistance zone (1.82879 - 1.83105); If the current price action on the daily chart shows a potential clear break of daily support zone (strong sign that sellers are in control).
No confirmation = no trade.
How Should We Anticipate GBP/CAD Price Moves in Using Simple View?
To map out this setup, you need to track a few critical levels. The key zones define your boundaries. Here is a breakdown of the exact areas you must monitor for this GBP/CAD Intra day trade. Memorize these vital numbers.
Key Levels to Watch
Resistance Zone (Retest):
Weekly Resistance: (1.84402 - 1.84133) Target Price: 1.83204
Support Zone (Break & Retest):
Daily Support: (1.82879 - 1.83105) Target Price: 1.82050
Potential Anticipation
Retest Anticipation: If the price retest the weekly resistance zone, the trade can be positioned with a target slightly above the daily support zone.
Break & Retest Anticipation: if bearish momentum breaks daily support zone, potentially it could break and retest and make it as resistance and could potentially continue to fall at our target zone 1.31331
Adjacent Pair Analysis: GBP/USD
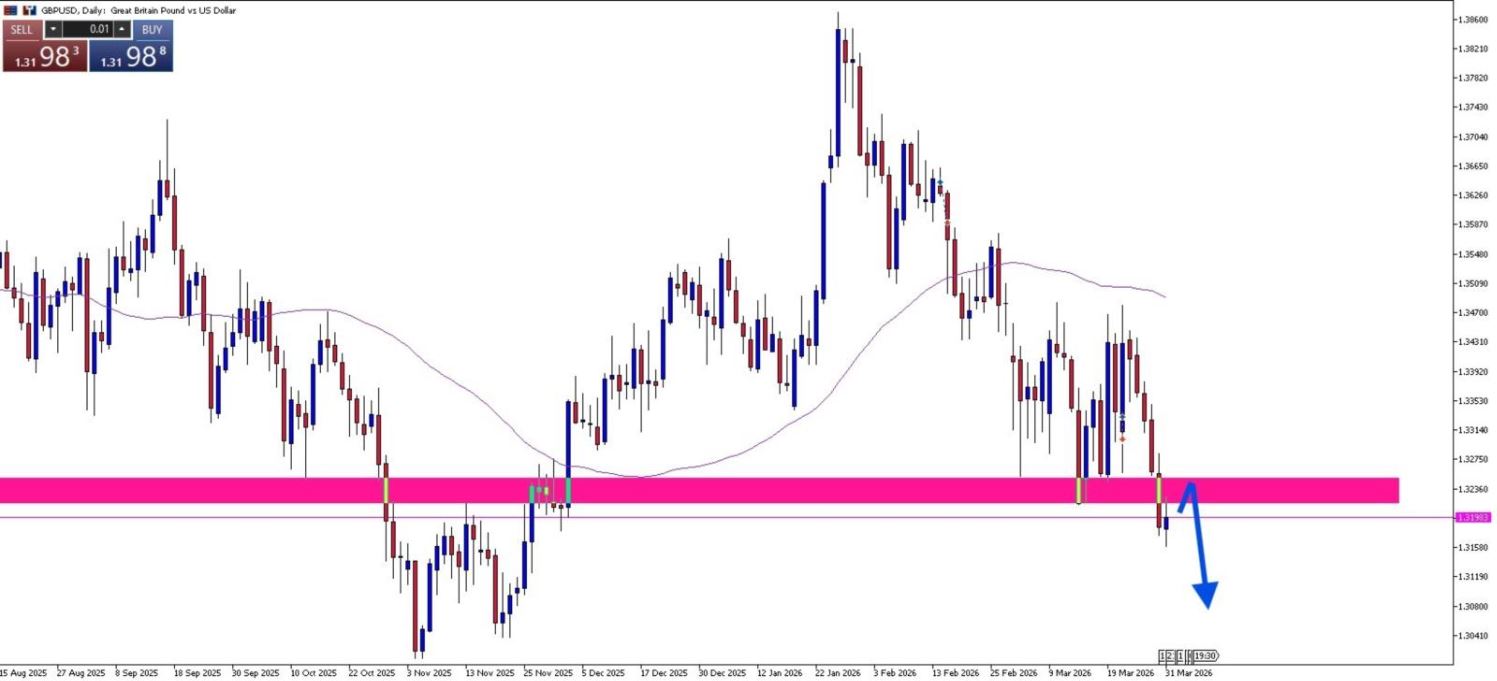
Market Structure
GBP/USD is showing a developing bearish structure, with sellers slowly regaining control.
Insight
If GBP/USD drops, it strengthens the bearish pound bias, supporting your GBP/CAD trade.
Adjacent Pair Analysis: GBP/JPY
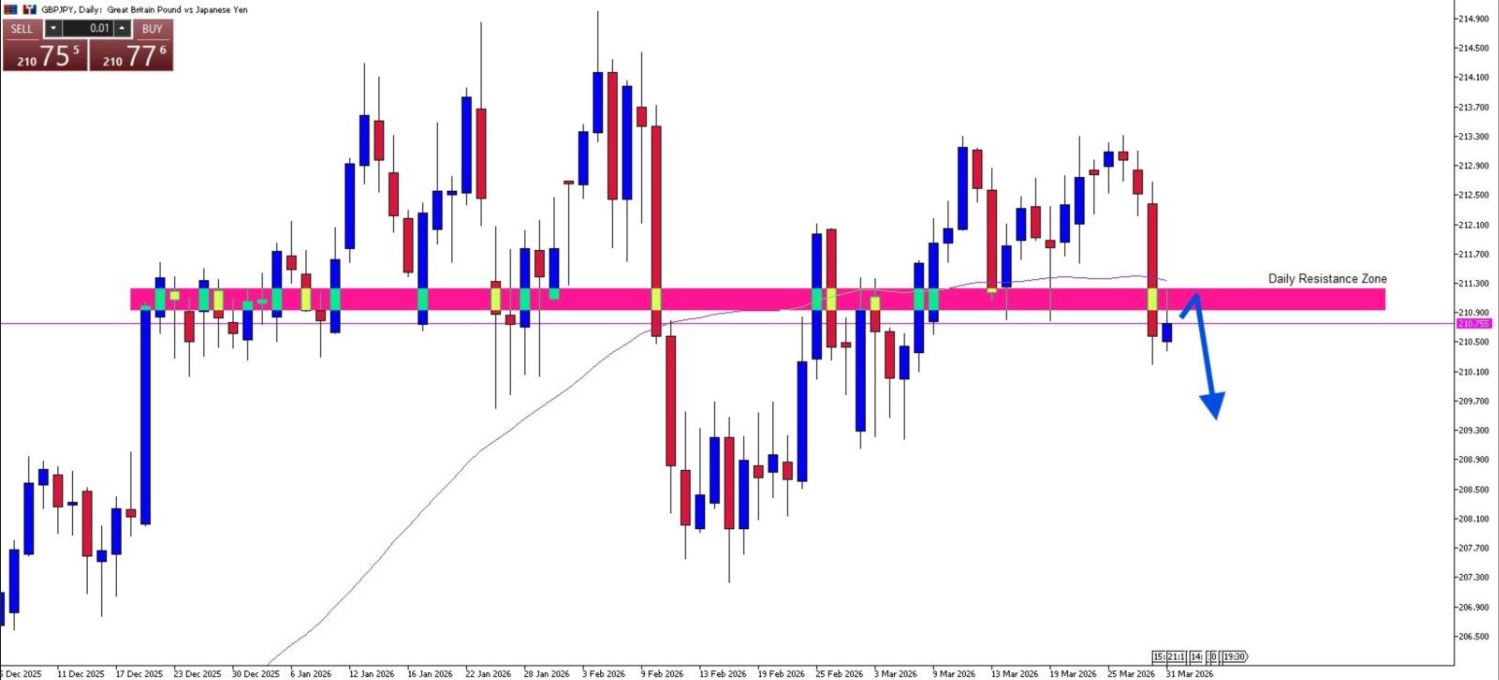
Market Structure
GBP/JPY is highly volatile but currently showing signs of distribution near resistance, hinting at a possible bearish shift.
Insight
A drop in GBP/JPY often signals strong GBP weakness, adding confidence to sell setups.
Adjacent Pair Analysis: EUR/GBP
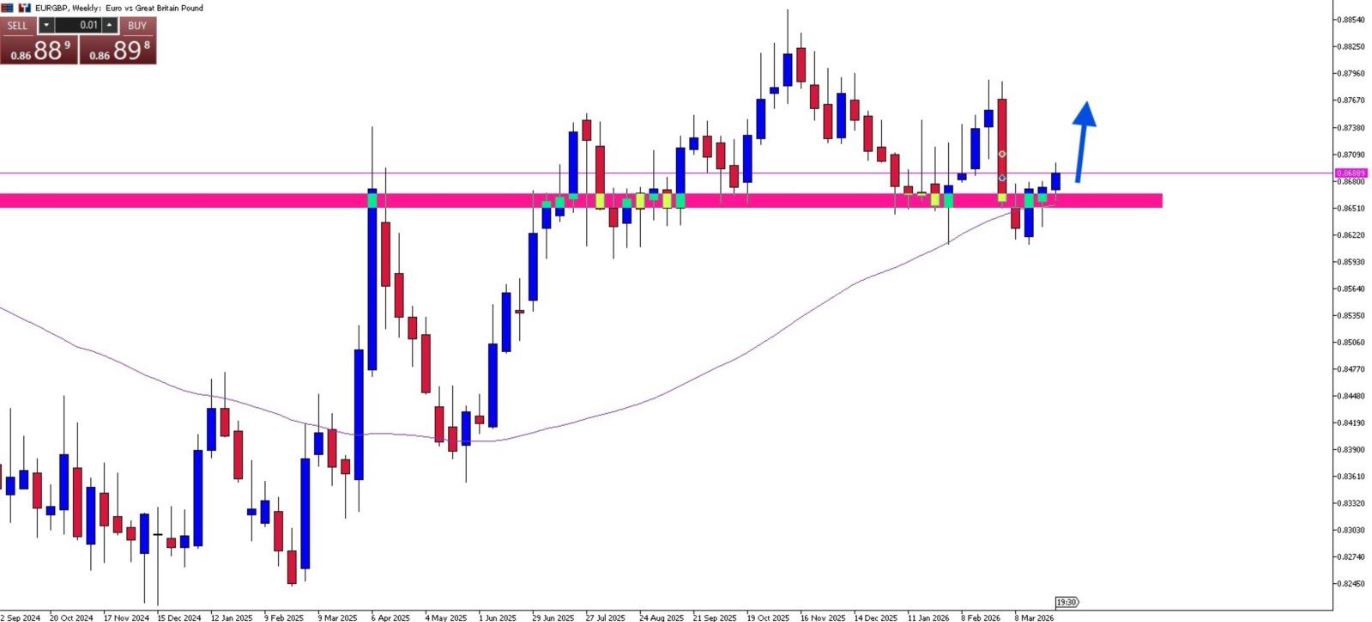
Market Structure
EUR/GBP moves inversely to GBP pairs. Right now, it shows bullish potential, meaning GBP could weaken.
Insight
If EUR/GBP rises, it confirms GBP weakness, supporting bearish GBP/CAD bias.
Adjacent Pair Analysis: GBP/AUD
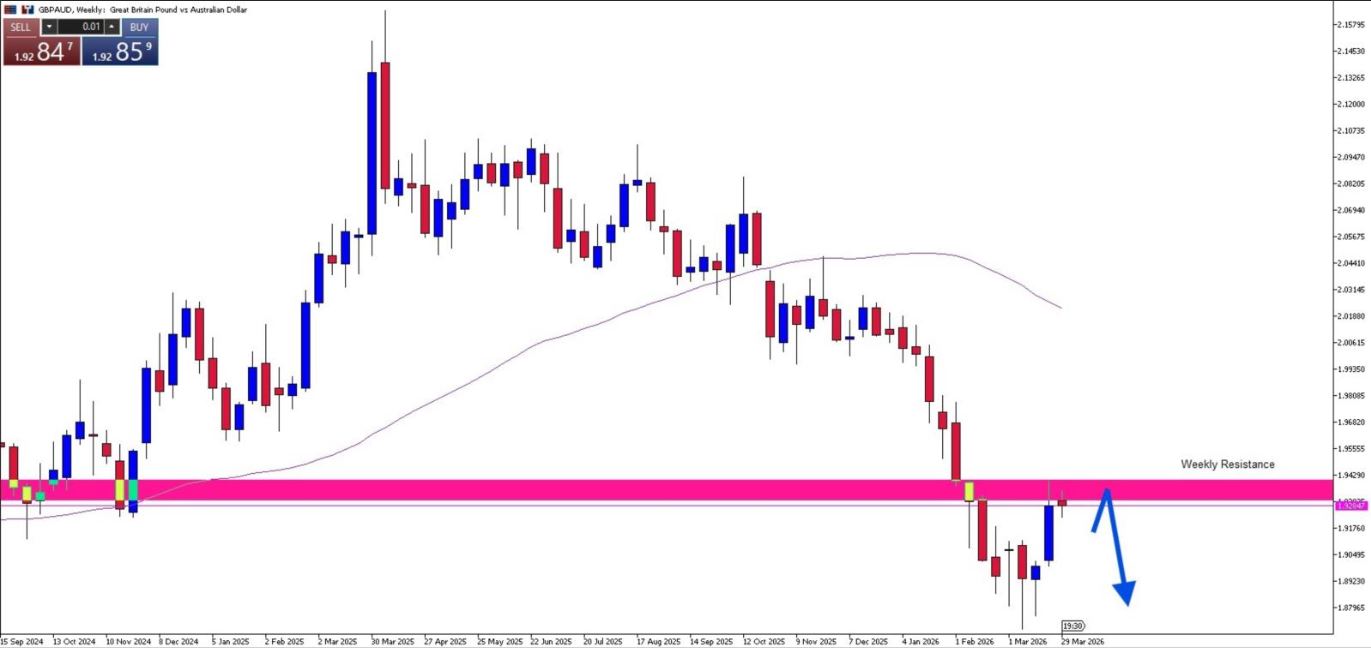
Market Structure
GBP/AUD shows early signs of a bearish reversal after rejecting higher levels a strong weekly resistance.
Insight
A bearish GBP/AUD strengthens the case for multi-pair GBP selling pressure.
Adjacent Pair Analysis: GBP/NZD
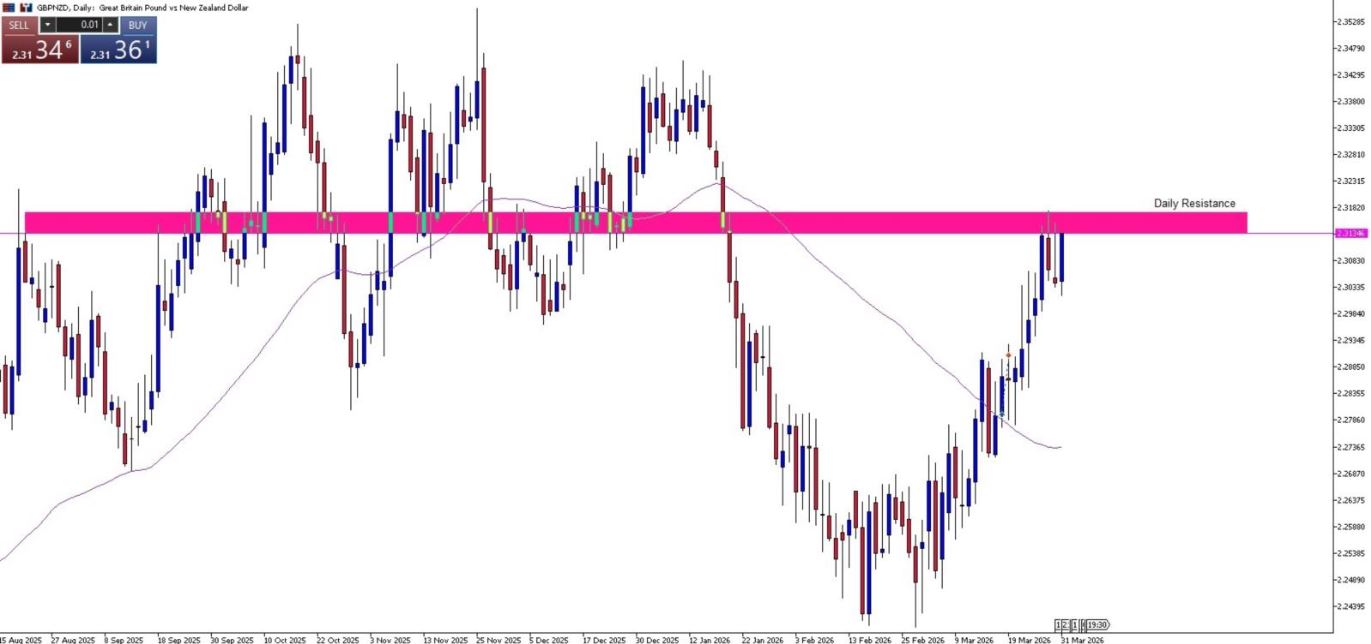
Market Structure
GBP/NZD is beginning to lose bullish momentum and may transition into a bearish phase.
Insight
If GBP/NZD breaks down, it confirms broad GBP weakness across pairs.
Final Take & The ACY Edge

This GBP/CAD setup is not about forcing the market for it to happen; it’s about waiting.
Let price come to your level.
Let the market confirm your idea.
Then execute with confidence.
Start your live trading journey today!
• Trade Forex, indices, gold, and other global markets
• Access powerful platforms including ACY, MT4, MT5, and Copy Trading tools
Move from learning to a real simple market price action to market execution with confidence and a simple, beginner-friendly setup.
Create an Account. Start Your Live Trading Now!
Disclaimer:
Trading forex and derivative instruments involves substantial risk and may not be suitable for all individuals. Only use funds that you are prepared to lose. It is important to understand how these markets work and the risks involved before trading, and to seek independent financial advice if needed. All market analysis and insights shared are intended for educational and informational purposes only and should not be considered financial or investment advice. March 30, 2026
Try These Next

