The SMC Playbook Series Part 2: How to Spot Liquidity Pools in Trading – Internal vs External Liquidity Explained
2025-04-08 10:33:26


The SMC Playbook Series Part 2: How to Spot Liquidity Pools in Trading – Internal vs External Liquidity Explained
Goal of This Lesson:

To teach you exactly where liquidity hides on your chart, and how to distinguish between External Range Liquidity (ERL) and Internal Range Liquidity (IRL). These two zones work together like offense and defense in a game—you hunt in one, and you enter in the other.
By the End of This Lesson, You Should Be Able To:
- Draw IRL and ERL zones on any timeframe (PDH, PDL, Session Highs/Lows)
- Understand why price targets these levels
- Begin planning trades using liquidity sweeps → confirmation → entries
Let’s Start With a Question:

Where do most traders put their stop-losses?
- Below recent swing highs & lows
- Above obvious highs & below obvious lows
- Just outside consolidation ranges
And where do most breakout traders enter?
- Right after price breaches a high
- As soon as price touches a new low
That’s where liquidity pools form.
There are 2 Types of Liquidity in the Market:

- External Range Liquidity (ERL)
- This the most common one.
- Found at the previous highs and lows.
- Internal Range Liquidity (IRL)
- These are orders that reside inside a range.
- Are usually formed after a momentum move.
What is External Range Liquidity (ERL)?
Think of ERL as the bait smart money uses to trap retail traders.
These are levels outside the current price range where:
- Stop-losses sit
- Breakout orders stack
- Traders get emotionally triggered
ERL Levels:
- Previous Week High (PWH) / Previous Week Low (PWL)
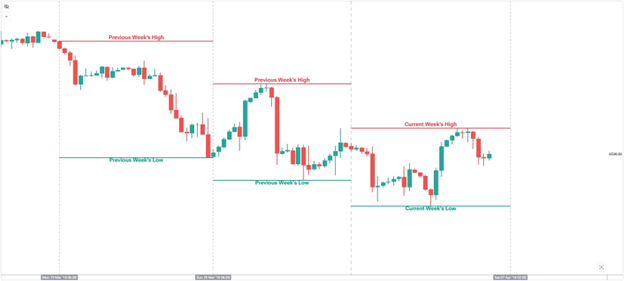
This is the highest high and lowest low that price traded to during the span of the week.
This is usually targeted to be reached at the end or during the week.
The key here is analyzing price and anticipating a draw on the previous highs / lows given that we have a direction in mind.
2. Previous Day High (PDH) / Previous Day Low (PDL)

This is the highest high and lowest low that occurred during the day.
Unlike the weekly, the daily highs and lows are used by day traders or scalpers as target for the day and potential continuation to the direction of the previous day’s candle.
3. Previous Session High/Low

These levels are based on time:
- Asian Session High & Low - 18:00 - 00:00 UTC -4
- London Session High & Low - 00:00 - 06:00 UTC -4
- New York AM Session High & Low - 06:00 - 12:00 UTC -4
Reversals often occur on these levels.
Smart money targets these levels to:
- Induce retail entries
- Fill large positions
- Sweep liquidity and reverse
In short, smart money institutions target these levels for the sake of filling orders. Remember, institutions need a large number of resting orders so they could get in in the market.
Real-Life Analogy:

Imagine a lion hunting a herd of deer. The lion doesn’t chase the deer into the open field. Instead, it waits near the waterhole—the predictable place where deer always gather.
ERL = The Waterhole.
That’s where stop-losses gather. That’s where price will be lured.
Price will always move to a level where there is a resting order, whether it is a high, a low, or even volume imbalances located inside those highs and lows.
What is Internal Range Liquidity (IRL)?
Once price sweeps external liquidity, it doesn’t just drop endlessly or fly without pullback. Institutions often re-enter, add to their positions, close their hedges during the retrace. That retrace often targets Internal Range Liquidity.

When price breaks out of a range, this usually triggers buy orders with stop-loss orders just below the breakout level. Reversal traders also get involve and most of those traders, get into short positions blindly without understanding what the current trend is. We will also discuss this in Part 4 on how to determine the trend using market structures.

The sudden move outside of the range causes a rush for traders to get in with a “FOMO” mindset. The momentum also causes price to leave Gaps, often called Fair Value Gaps or Volume Balances, which we will discuss in a while, unfilled orders they COULD return to through a pullback or retracement to fill their positions.
Theories for the retracement:
- Filling of Remaining Institutional Orders
- Stop-Loss Orders placed after the breakout
- Closing of institutional hedge positions
- Hedging is where a market participant enters with both long and short position.
- Institutions can engineer price to return to their original position to close out the other position and add more.

Institutions will fill as much as it can all the available or resting orders so they can get filled with all their positions.
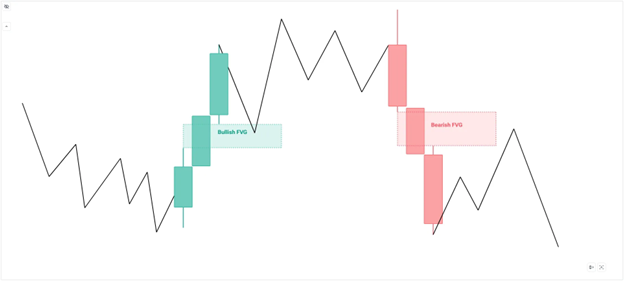
IRL is inside the price leg. It forms as a result of displacement or a sudden move of price, and the most precise tool to spot it is the Fair Value Gap (FVG).

FVG Parameters:
- 3 Candle Pattern
- Bullish - Mark the high of the 1st candle until the low of the 3rd candle
- Bearish - Mark the low of the 1st candle until the high of the 3rd candle
- Middle Candle marked as FVG
No Fair Value Gap Below
In this case, the middle candle is not considered as an FVG the momentum left no gaps for price to trade to.
The premise is, there are no more “un-filled orders”.

A good fair value gap is where price just touches it and moves away from it fast and going to the direction of the current trend.
Where IRL Shows Up:
- Inside clean trend legs

- Between strong impulsive moves

- After MSS (Market Structure Shift; more on Part 4)

Actionable Approach: How ERL and IRL Work Together
Here’s the institutional flow:
- Identify the Higher Timeframe Direction

After coming from a downtrend, we are now on a bullish sequence.
We follow the higher timeframe trend at the lower timeframes which in this case is bullish.
2. Mark your ERL levels:

- Previous Week’s High and Low
- Previous Day’s High and Low
- Previous Session’s High and Low
3. Wait for price to sweep that level → grab liquidity
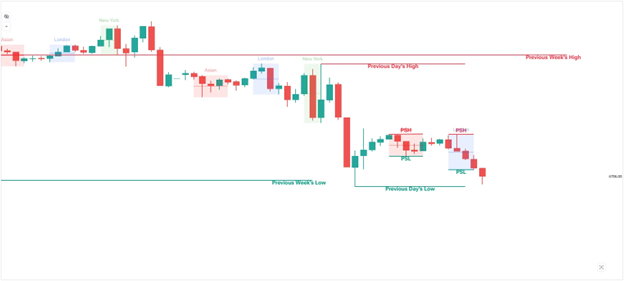
In this case, prior to our trading day, the Previous Week’s Low has already been tapped. And at the current day, the Previous Day’s Low has also been tested.
After touching the low, price reacted bullishly, taking out the sell orders, and potentially proceed to the upside.
To confirm this liquidity being grabbed:
- Price must not close below it. If it closes below there must not be a follow-through but gets quickly invalidated by a bullish candle.
- A gap must form after taking out the stops.
4. Watch for MSS (intent confirmed)

There must be a breakout on the opposing side to confirm the market has already shifted from a bearish stance to bullish.
5. Entry on IRL (FVG) during retrace with stops behind the:

- 1st candle of the 3 candle pattern FVG or;
- Behind the candle that created the sweep
6. Target the next ERL

They work like magnets and entry points.
ERL is the target. IRL is the entry.
Beginner Trap to Avoid:

Many retail traders see price hit a previous high and immediately buy the breakout. That high is ERL—it’s not an invitation to enter, it’s a warning that liquidity is about to be collected.
Once you train your mind to say:
- “Price swept that high… now I’ll wait for displacement and an IRL FVG to enter,”
you’ve officially started thinking like smart money.
Pro Tip:
Before looking for a trade, wait first for key levels or ERLs to get taken out first and observe price on a lower timeframe like 1-Hour to confirm if that level is being taken out or not.
A good sweep is where price does not trade or close beyond the level then reverses with a new FVG to trade at.
Transition to Part 3: From Identifying Liquidity to Understanding Price Behavior
Now that you know where liquidity hides—External for targets, Internal for entries—you’re beginning to see how smart money maps out its traps and setups. But there’s more to this game than just marking levels.
Liquidity doesn’t just exist in a vacuum—it works hand-in-hand with how price moves. You’ve seen how price hunts ERL and retraces to IRL. But what tells you that the move is real? That the shift in direction is valid?
This is where displacement and intent come in—and that’s exactly what we’re diving into next.
In Part 3: Understanding Displacement and Confirming Market Intent
You’ll learn how to:
- Spot true displacement candles vs fakeouts
- Confirm that smart money is now in control
- Validate that a liquidity sweep has real meaning
- Use these confirmations to prepare high-probability entries
This content may have been written by a third party. ACY makes no representation or warranty and assumes no liability as to the accuracy or completeness of the information provided, nor any loss arising from any investment based on a recommendation, forecast or other information supplies by any third-party. This content is information only, and does not constitute financial, investment or other advice on which you can rely.
Try These Next

