Key Trading Levels - AUDJPY, AUDUSD, EURJPY, EURUSD, GBPJPY, and GBPUSD
2023-01-30 08:06:02


Overview:
Watch the video for the key trading levels for the week ahead for AUDJPY, AUDUSD, EURJPY, EURUSD, GBPJPY, and GBPUSD.
Last week AUDJPY, AUDUSD, EURJPY, EURUSD, and GBPJPY finished positive for the week. GBPUSD finished down for the week. USD Index just finished positive last week as the market heads towards the US FOMC Statement this week.
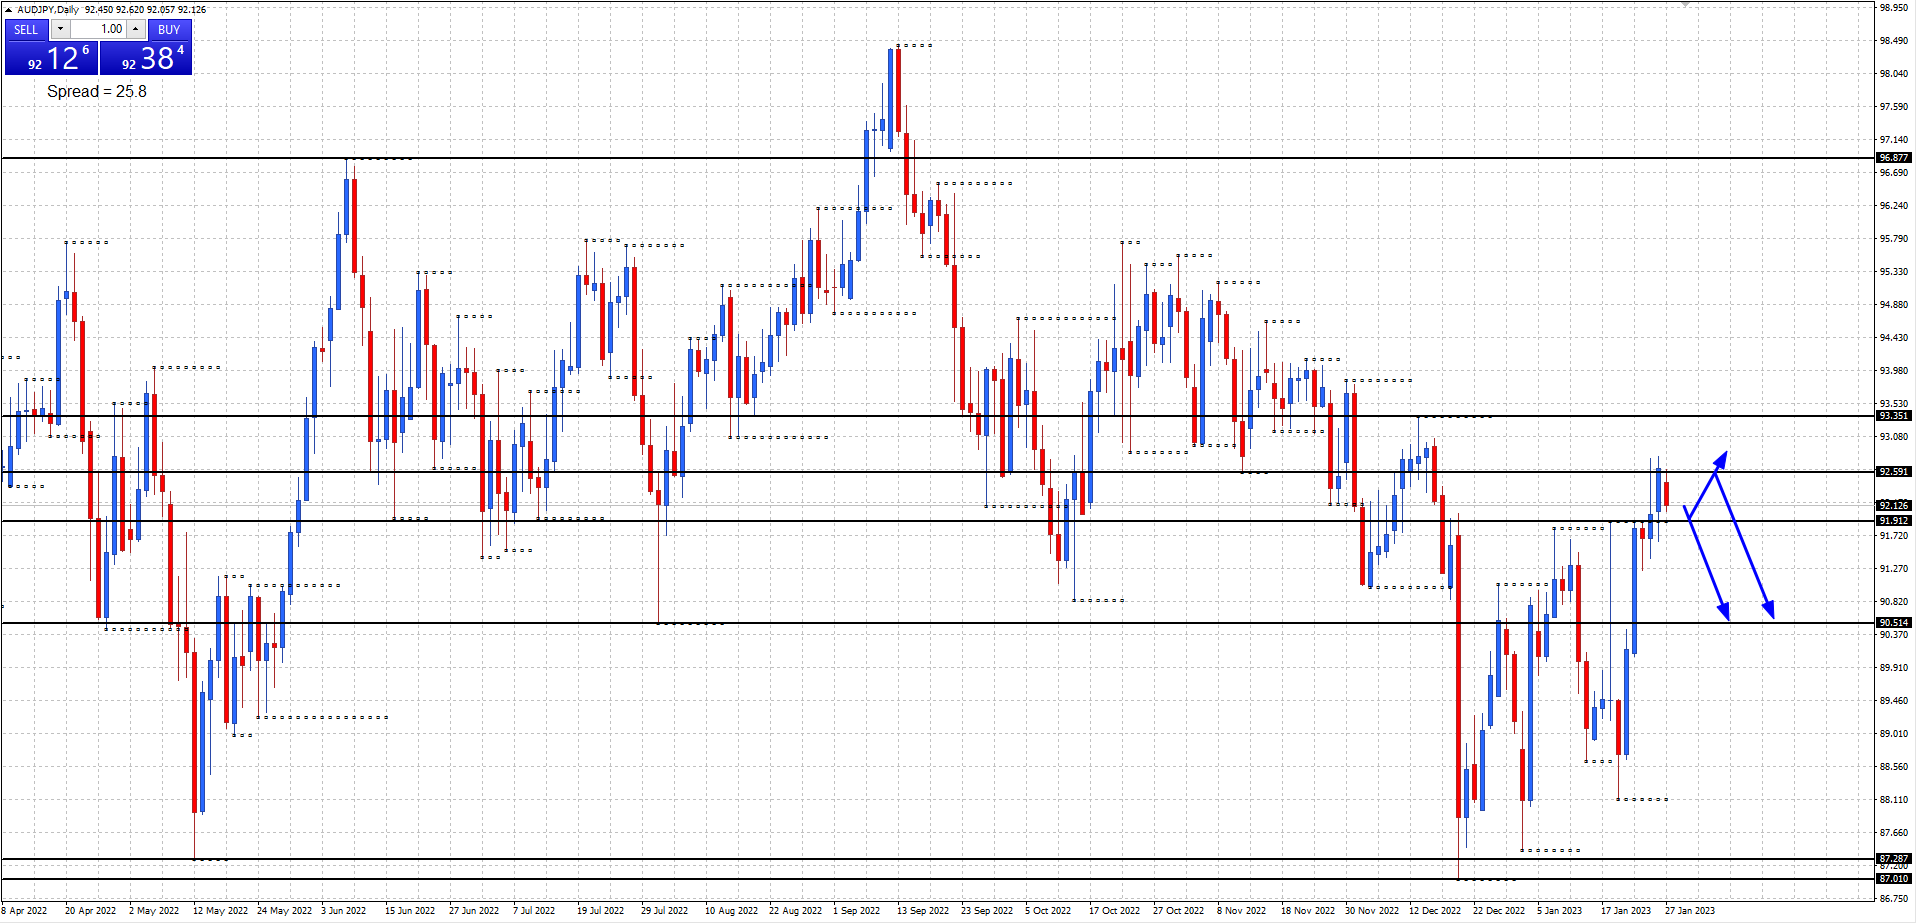
AUDJPY Daily chart:
Monthly support at 90.51, resistance at 96.87.
Weekly support at 87.28 and 87.01, resistance at 92.59.
Daily support at 91.91, resistance at 93.35.
Price advanced and tested the 92.59 weekly resistance level last week. Will price hold at the 92.59 weekly resistance level and move back below the 91.91 daily support level this week?
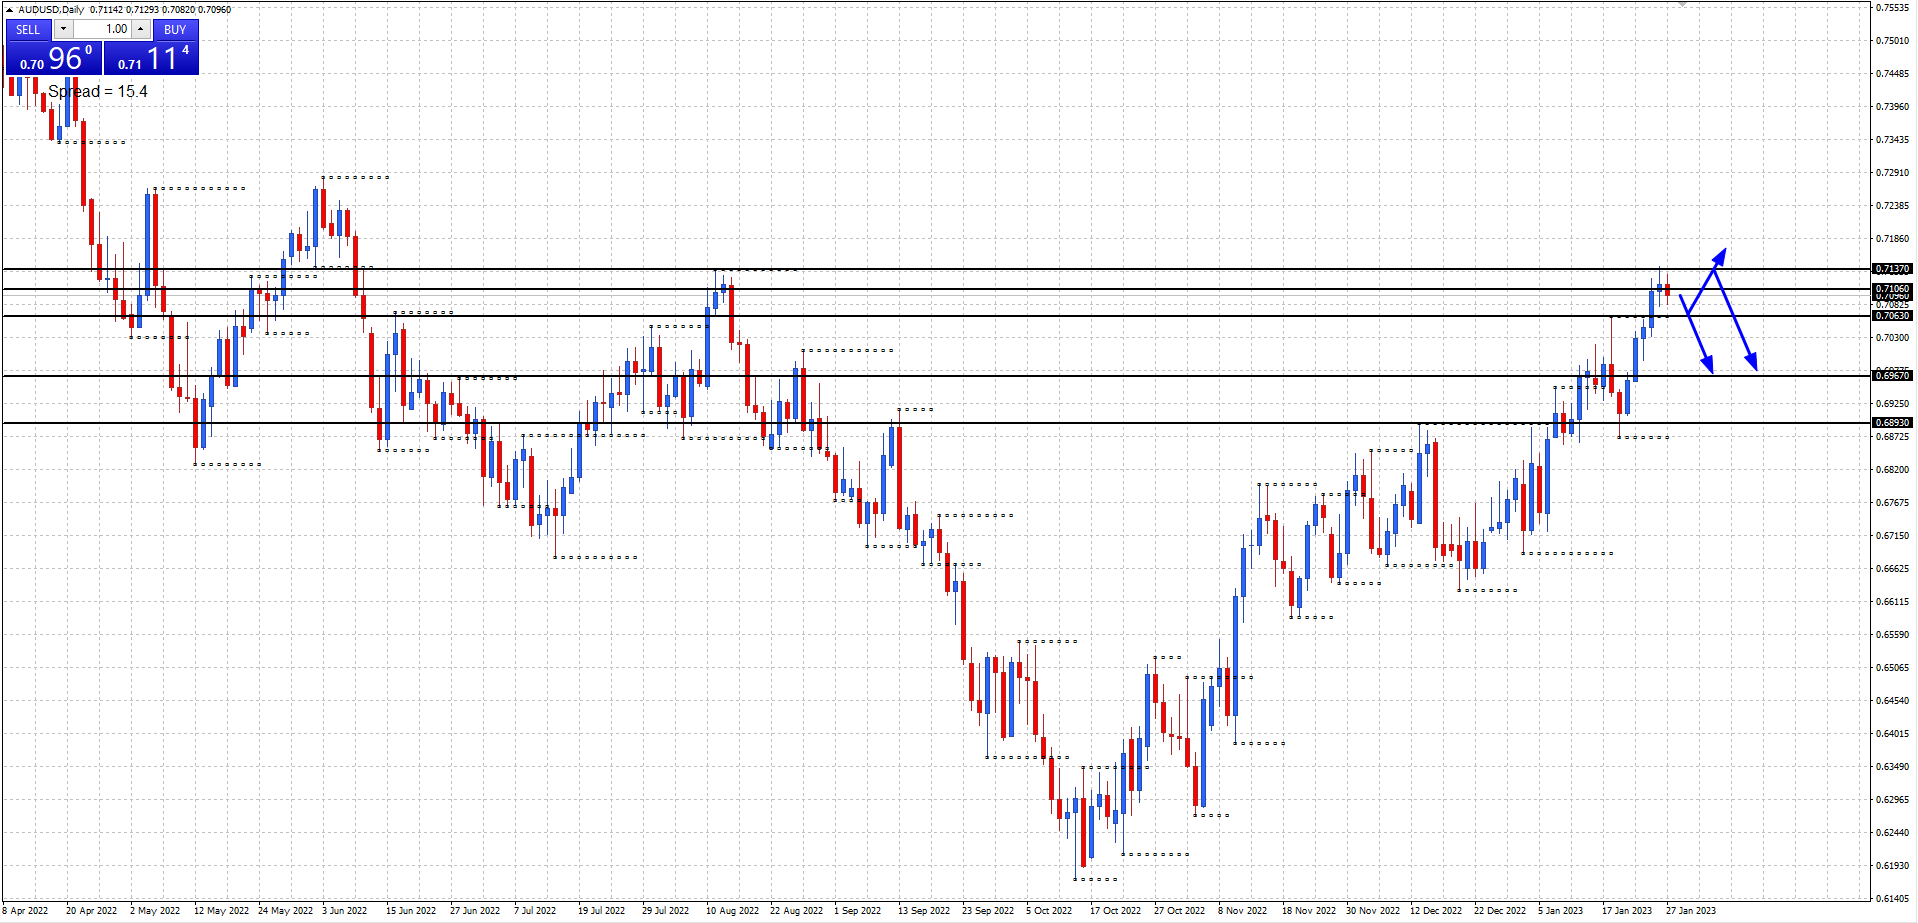
AUDUSD Daily chart:
Monthly support at 0.6967, resistance at 0.7106.
Weekly support at 0.6893, resistance at 0.7137.
Daily support at 0.7063, resistance at 0.7141.
Price advanced and tested the 0.7106-37 monthly/weekly resistance area last week. Will price hold the uptrend or form a double top at the 0.7137 weekly resistance level this week?
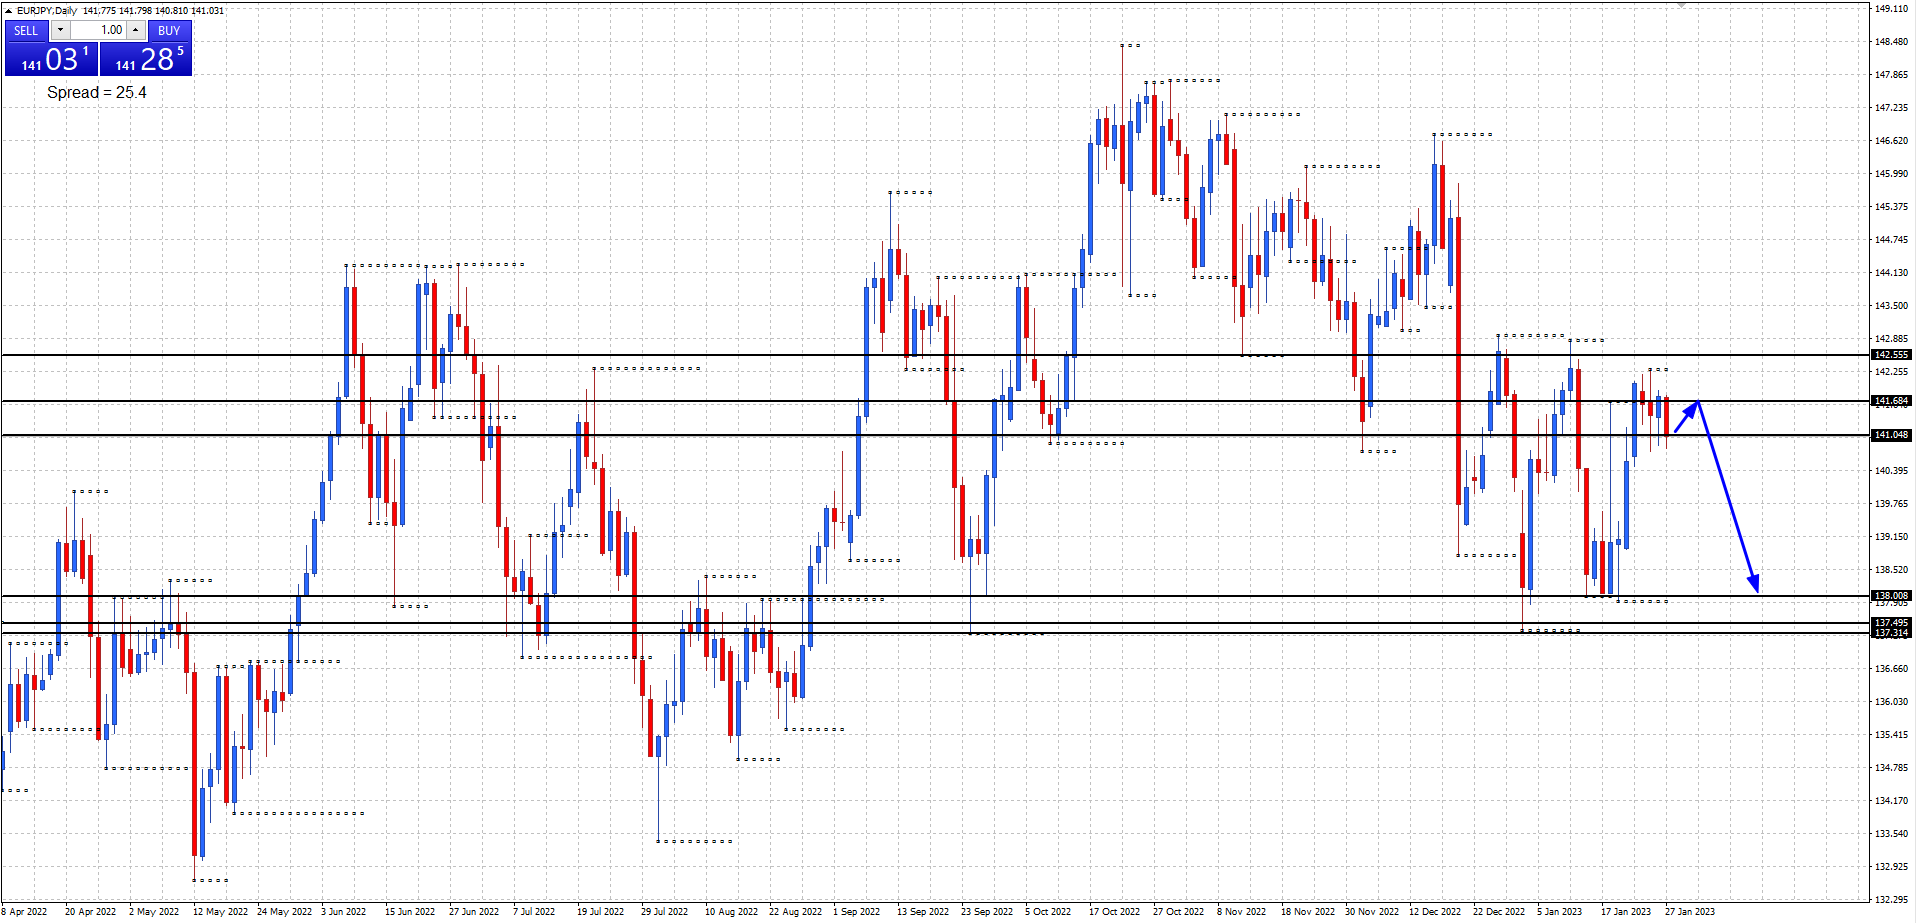
EURJPY Daily chart:
Monthly support at 137.49, resistance at 141.04.
Weekly support at 137.31, resistance at 142.55.
Daily support at 138.00, resistance at 141.68.
Price remained in consolidation holding below the 142.55 weekly resistance level last week. Will price move back down the range to retest the 138.00 daily support level this week?
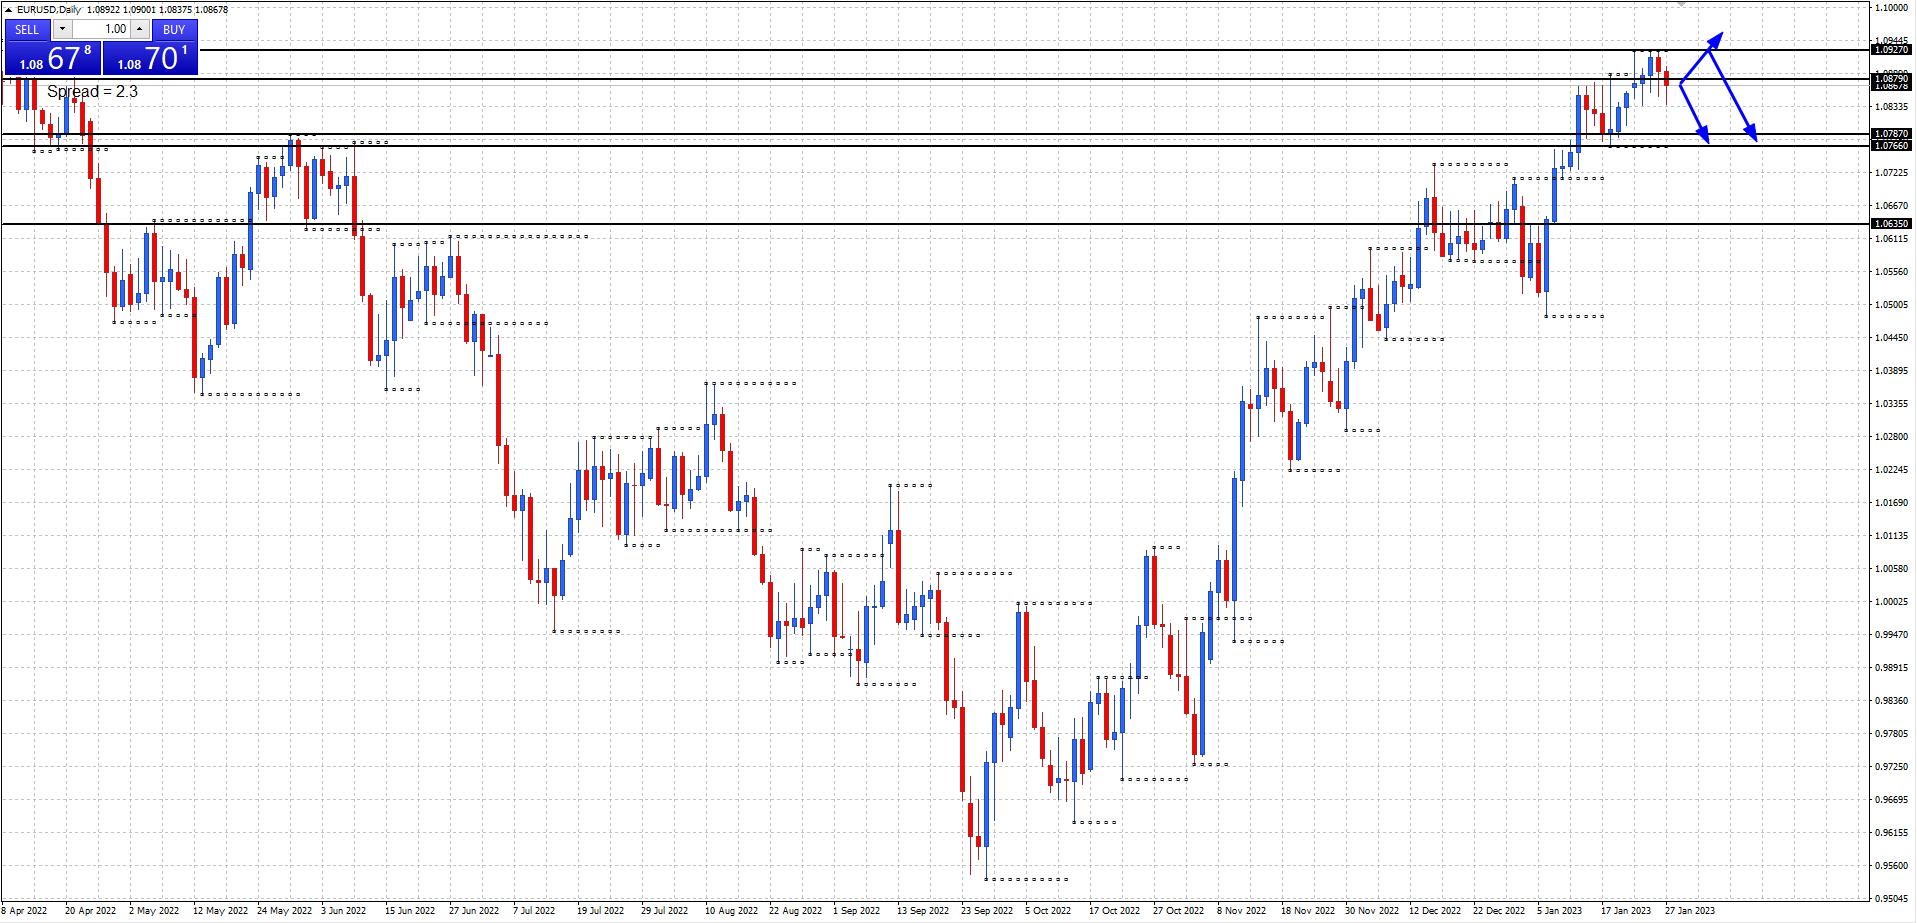
EURUSD Daily chart:
Monthly support at 1.0635, resistance at 1.0879.
Weekly support at 1.0787, resistance at 1.1121.
Daily support at 1.0766, resistance at 1.0927.
Price advanced but could not hold above the 1.0879 monthly resistance level last week. Will price hold the uptrend and move above the 1.0879 monthly resistance level this week?
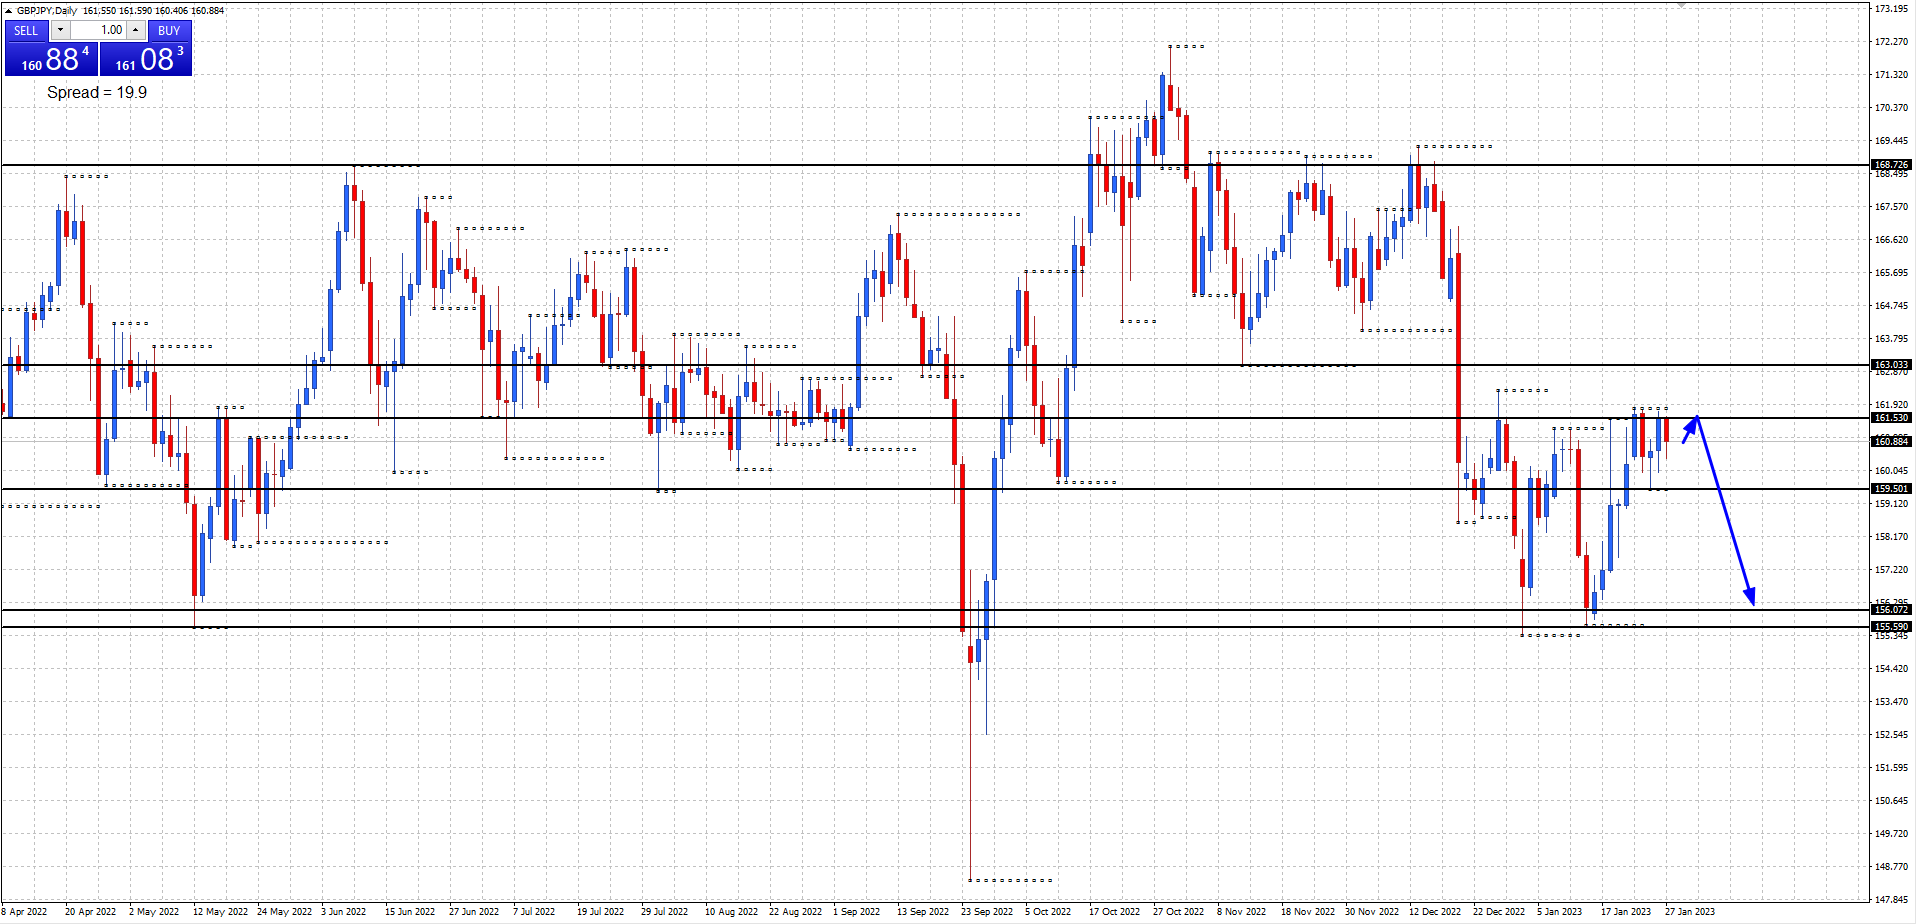
GBPJPY Daily chart:
Monthly support at 156.07, resistance at 168.72.
Weekly support at 155.59, resistance at 163.03.
Daily support at 159.50, resistance at 161.53.
Price remained in consolidation last week. Will price move back down the range to retest the 156.07 monthly support level this week?
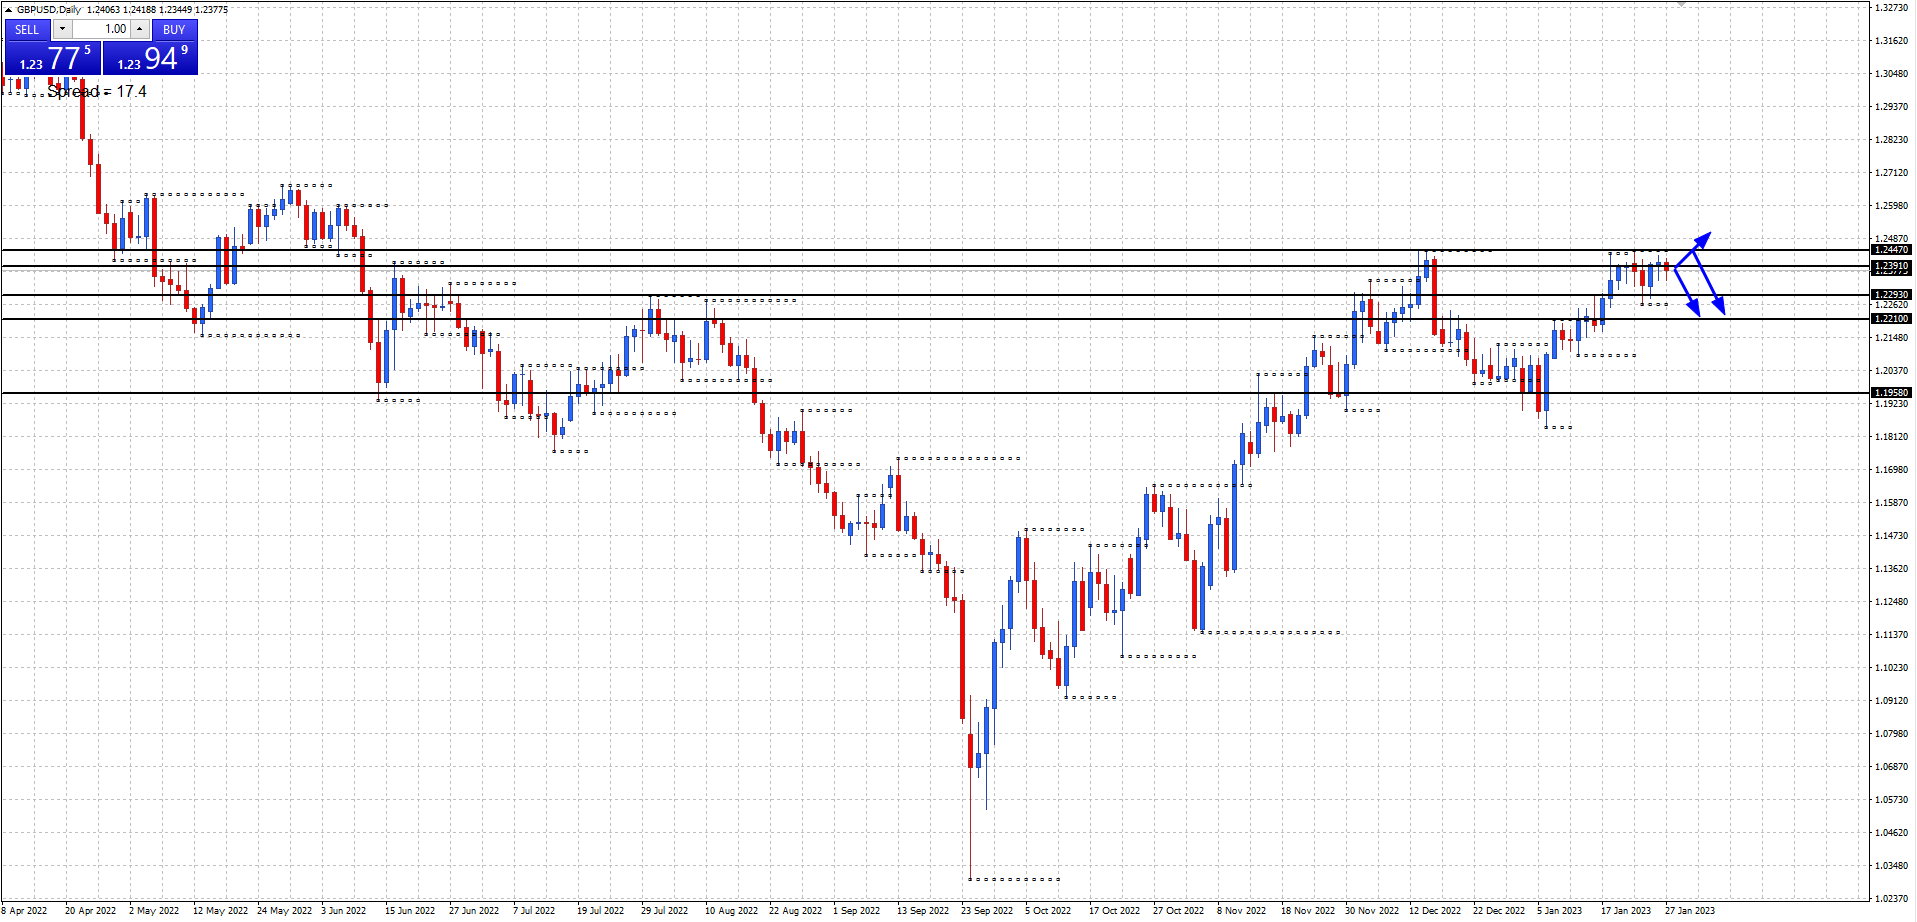
GBPUSD Daily chart:
Monthly support at 1.1958, resistance at 1.2391.
Weekly support at 1.2293, resistance at 1.2447.
Daily support at 1.2210, resistance at 1.2436.
Price advanced and tested the 1.2447 weekly resistance level last week. Will price hold the uptrend or form a double top at the 1.2447 weekly resistance level this week?
This content may have been written by a third party. ACY makes no representation or warranty and assumes no liability as to the accuracy or completeness of the information provided, nor any loss arising from any investment based on a recommendation, forecast or other information supplied by any third-party. This content is information only, and does not constitute financial, investment or other advice on which you can rely.
Try These Next

