Understanding Market Structure (The Language of Price)
2025-11-25 10:39:38


Market structure is the first real skill every trader must learn - not because it’s complicated, but because it changes everything once you finally see it.
Indicators can help. Tools can assist. Strategies can guide you.
A great complement to this is learning to think like a price action trader, where you focus on behavior, not just signals.
But nothing replaces the ability to open a chart, zoom out, and understand exactly:
- Who is in control
- What price is trying to achieve
- Where the market is likely to move next
- When a trend is weakening
- Why a reversal is forming
This module isn’t about fancy concepts or hidden tricks.
It’s about learning to read the market in its purest form - the natural rise and fall of price that reveals the entire story.
Once you understand market structure, every other skill becomes easier.
Entries make sense.
Risk management becomes logical.
Timing becomes clearer.
Your confidence grows because you’re no longer reacting - you’re reading.
Let’s break it down piece by piece.
What Market Structure Really Is
Market structure is simply the blueprint of how price moves.
Nothing more, nothing less.
Every chart - from Forex to gold to indices to crypto - is made of the same repeating patterns:
- Price pushes in one direction
- It pauses
- It pulls back
- It continues or reverses
These cycles form the “grammar” of the market.
If price makes higher highs and higher lows, the story is bullish.
If it makes lower highs and lower lows, the story is bearish.
If it goes sideways, the story is undecided.
Market structure is the simplest form of technical analysis, but it is also the foundation of every advanced concept - trends, breakouts, liquidity, order blocks, reversals, and more.
Without structure, you are trading blind.
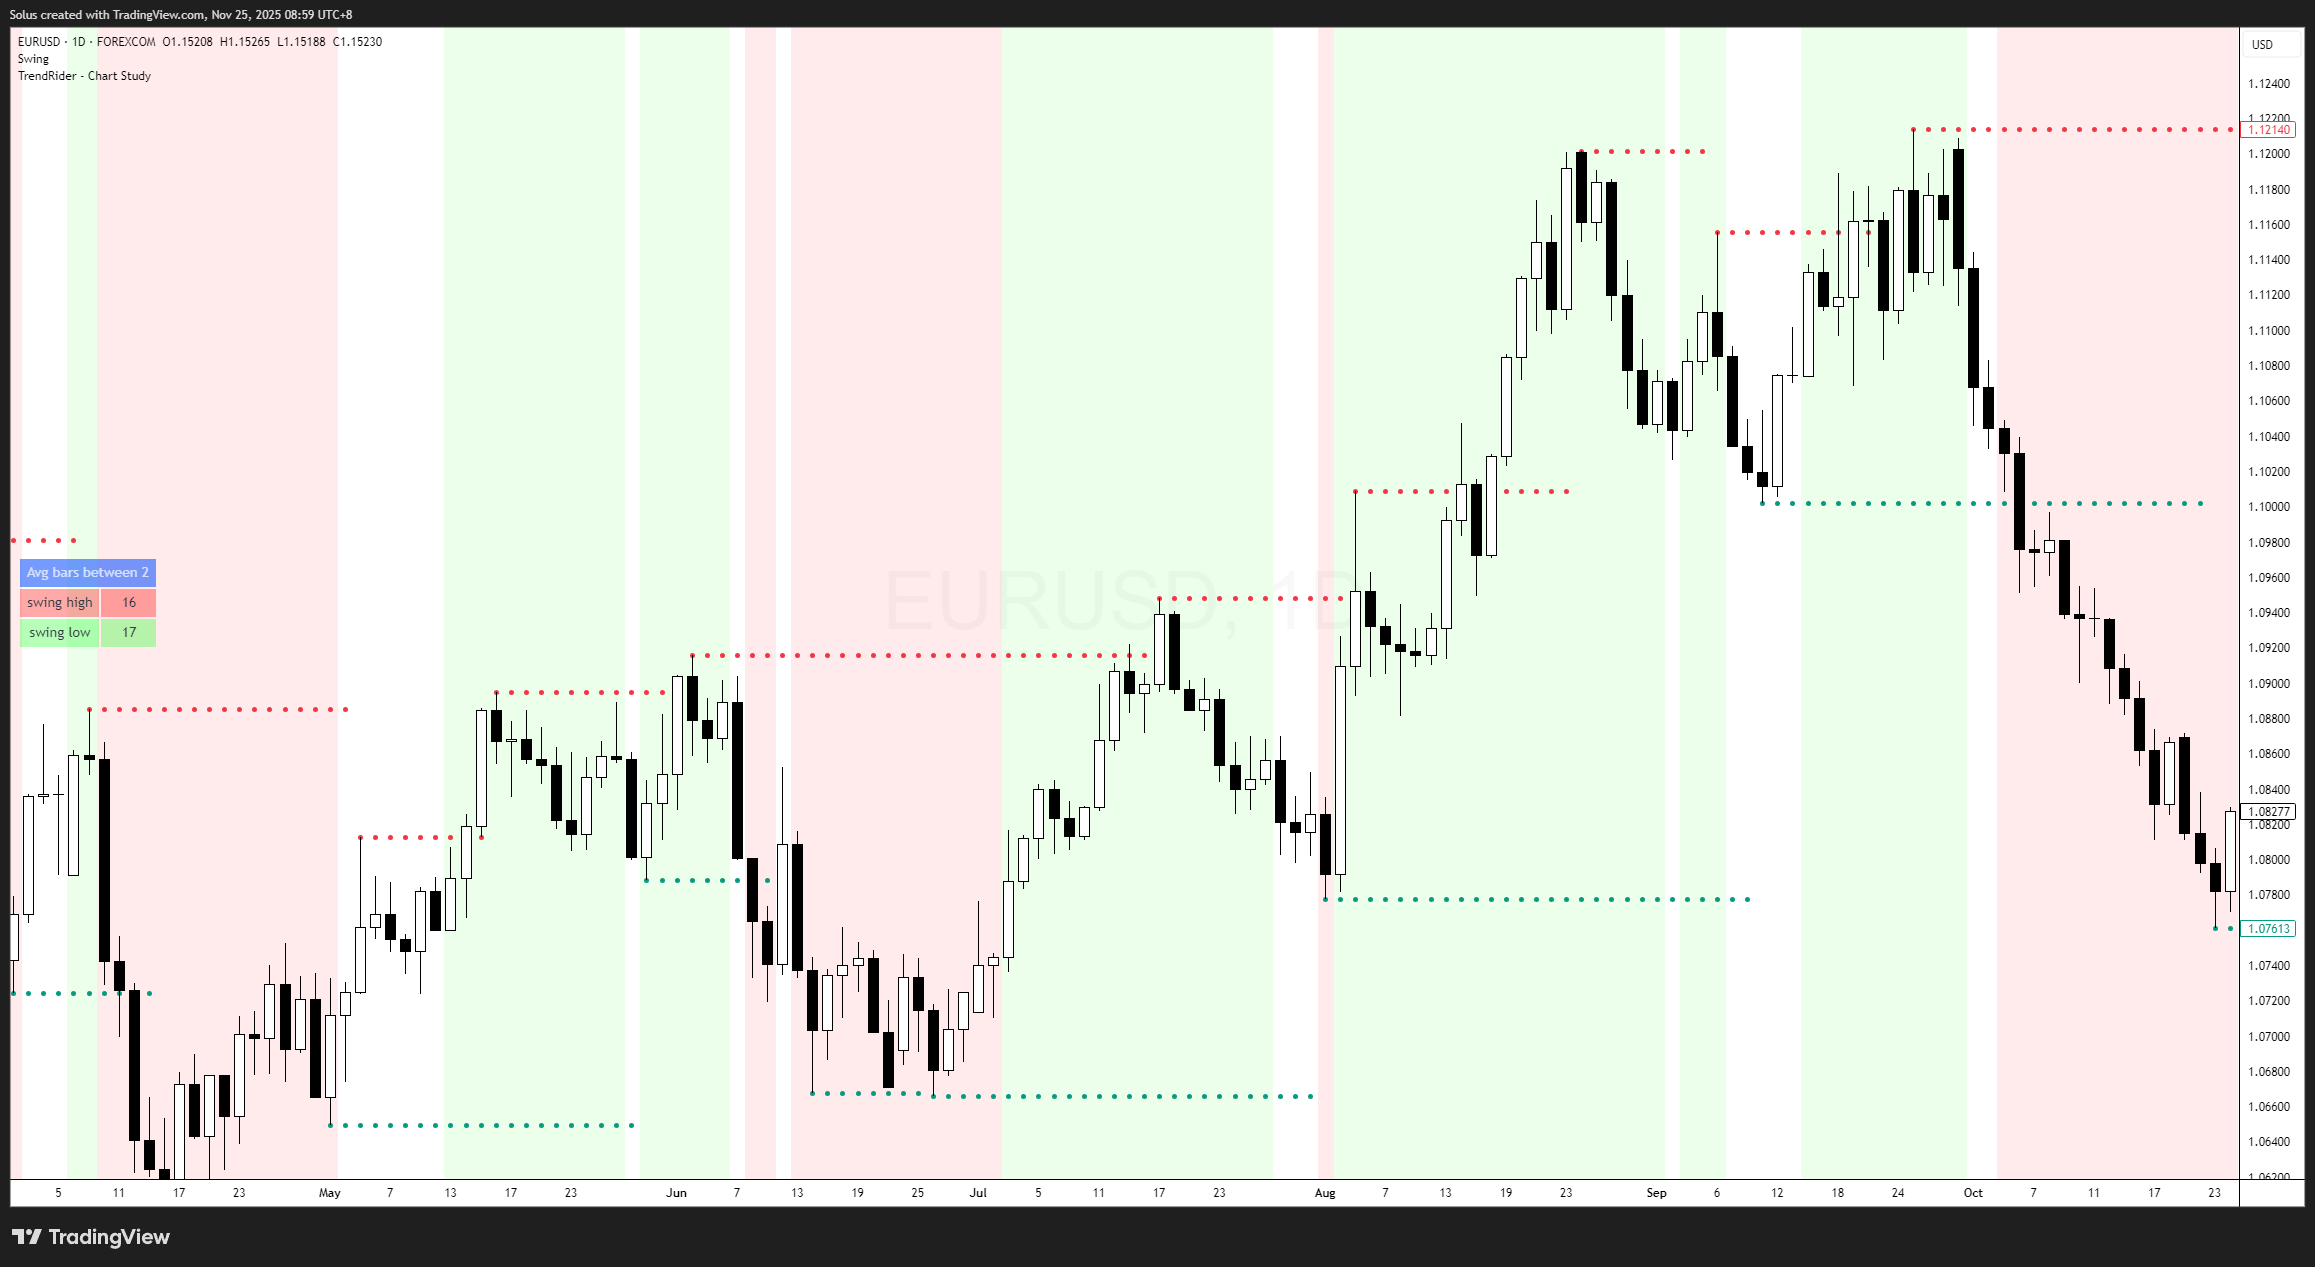
The Three Market Conditions
Every chart on every timeframe fits into one of these three categories.
1. Uptrend – Higher Highs & Higher Lows
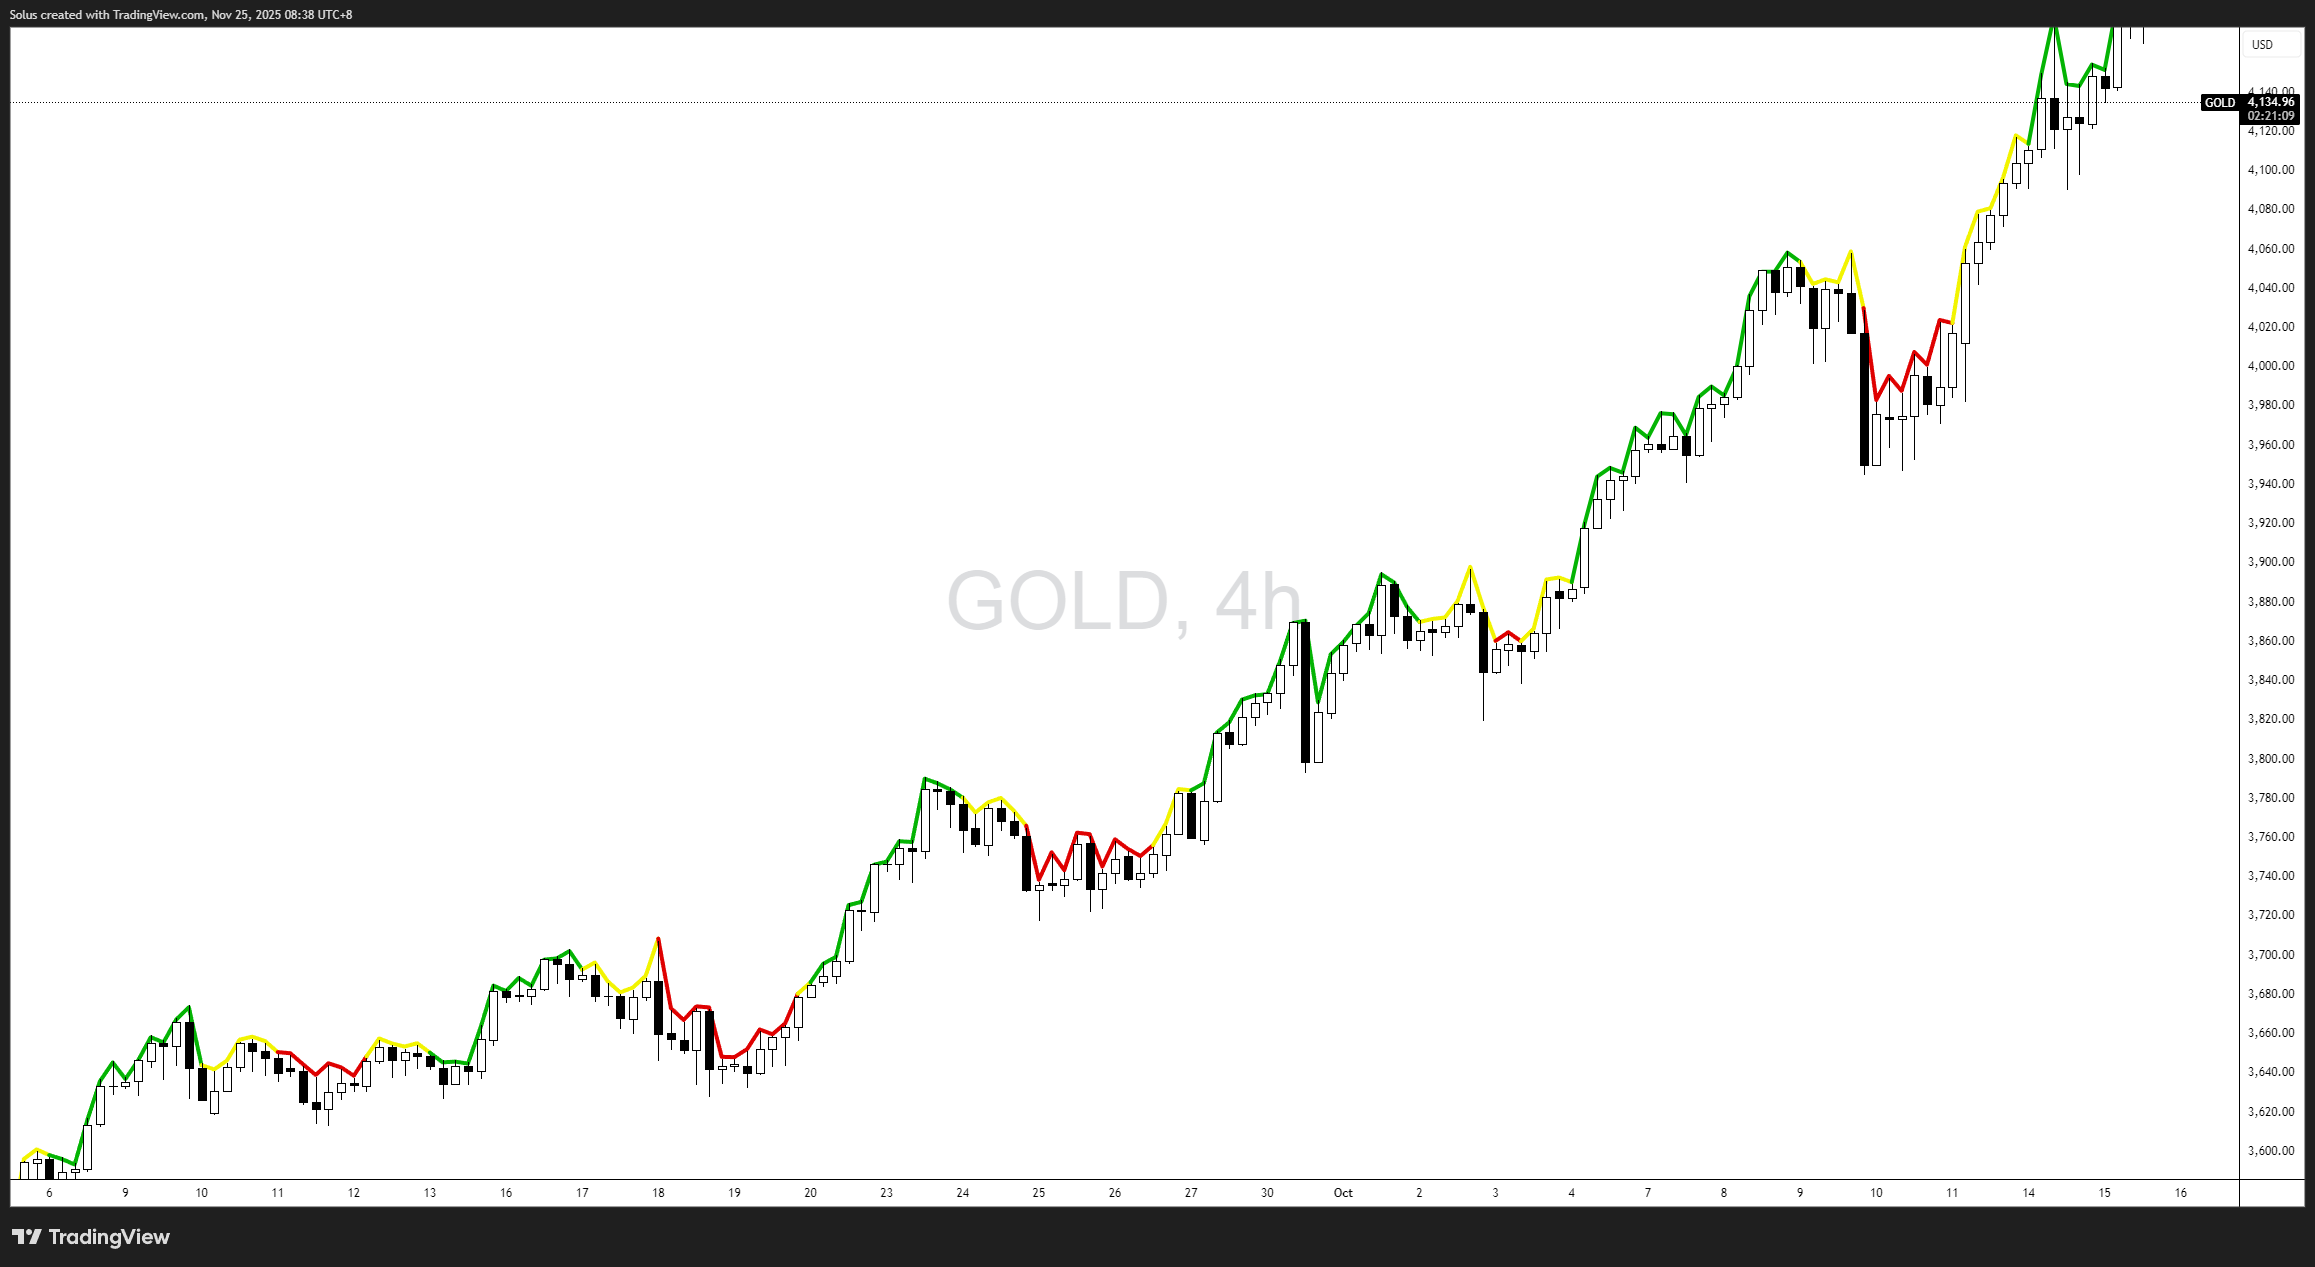
An uptrend reflects strength.
Buyers dominate, and each pullback fails to break previous lows.
This is where trend followers and SMC traders often look for continuation setups at key zones, similar to how price action at key levels is used to frame high probability trades.
Characteristics:
- New highs that exceed previous highs
- Pullbacks that remain shallow
- Rejections at swing lows
- Candle bodies expanding upward
When price respects higher lows repeatedly, the market is showing conviction.
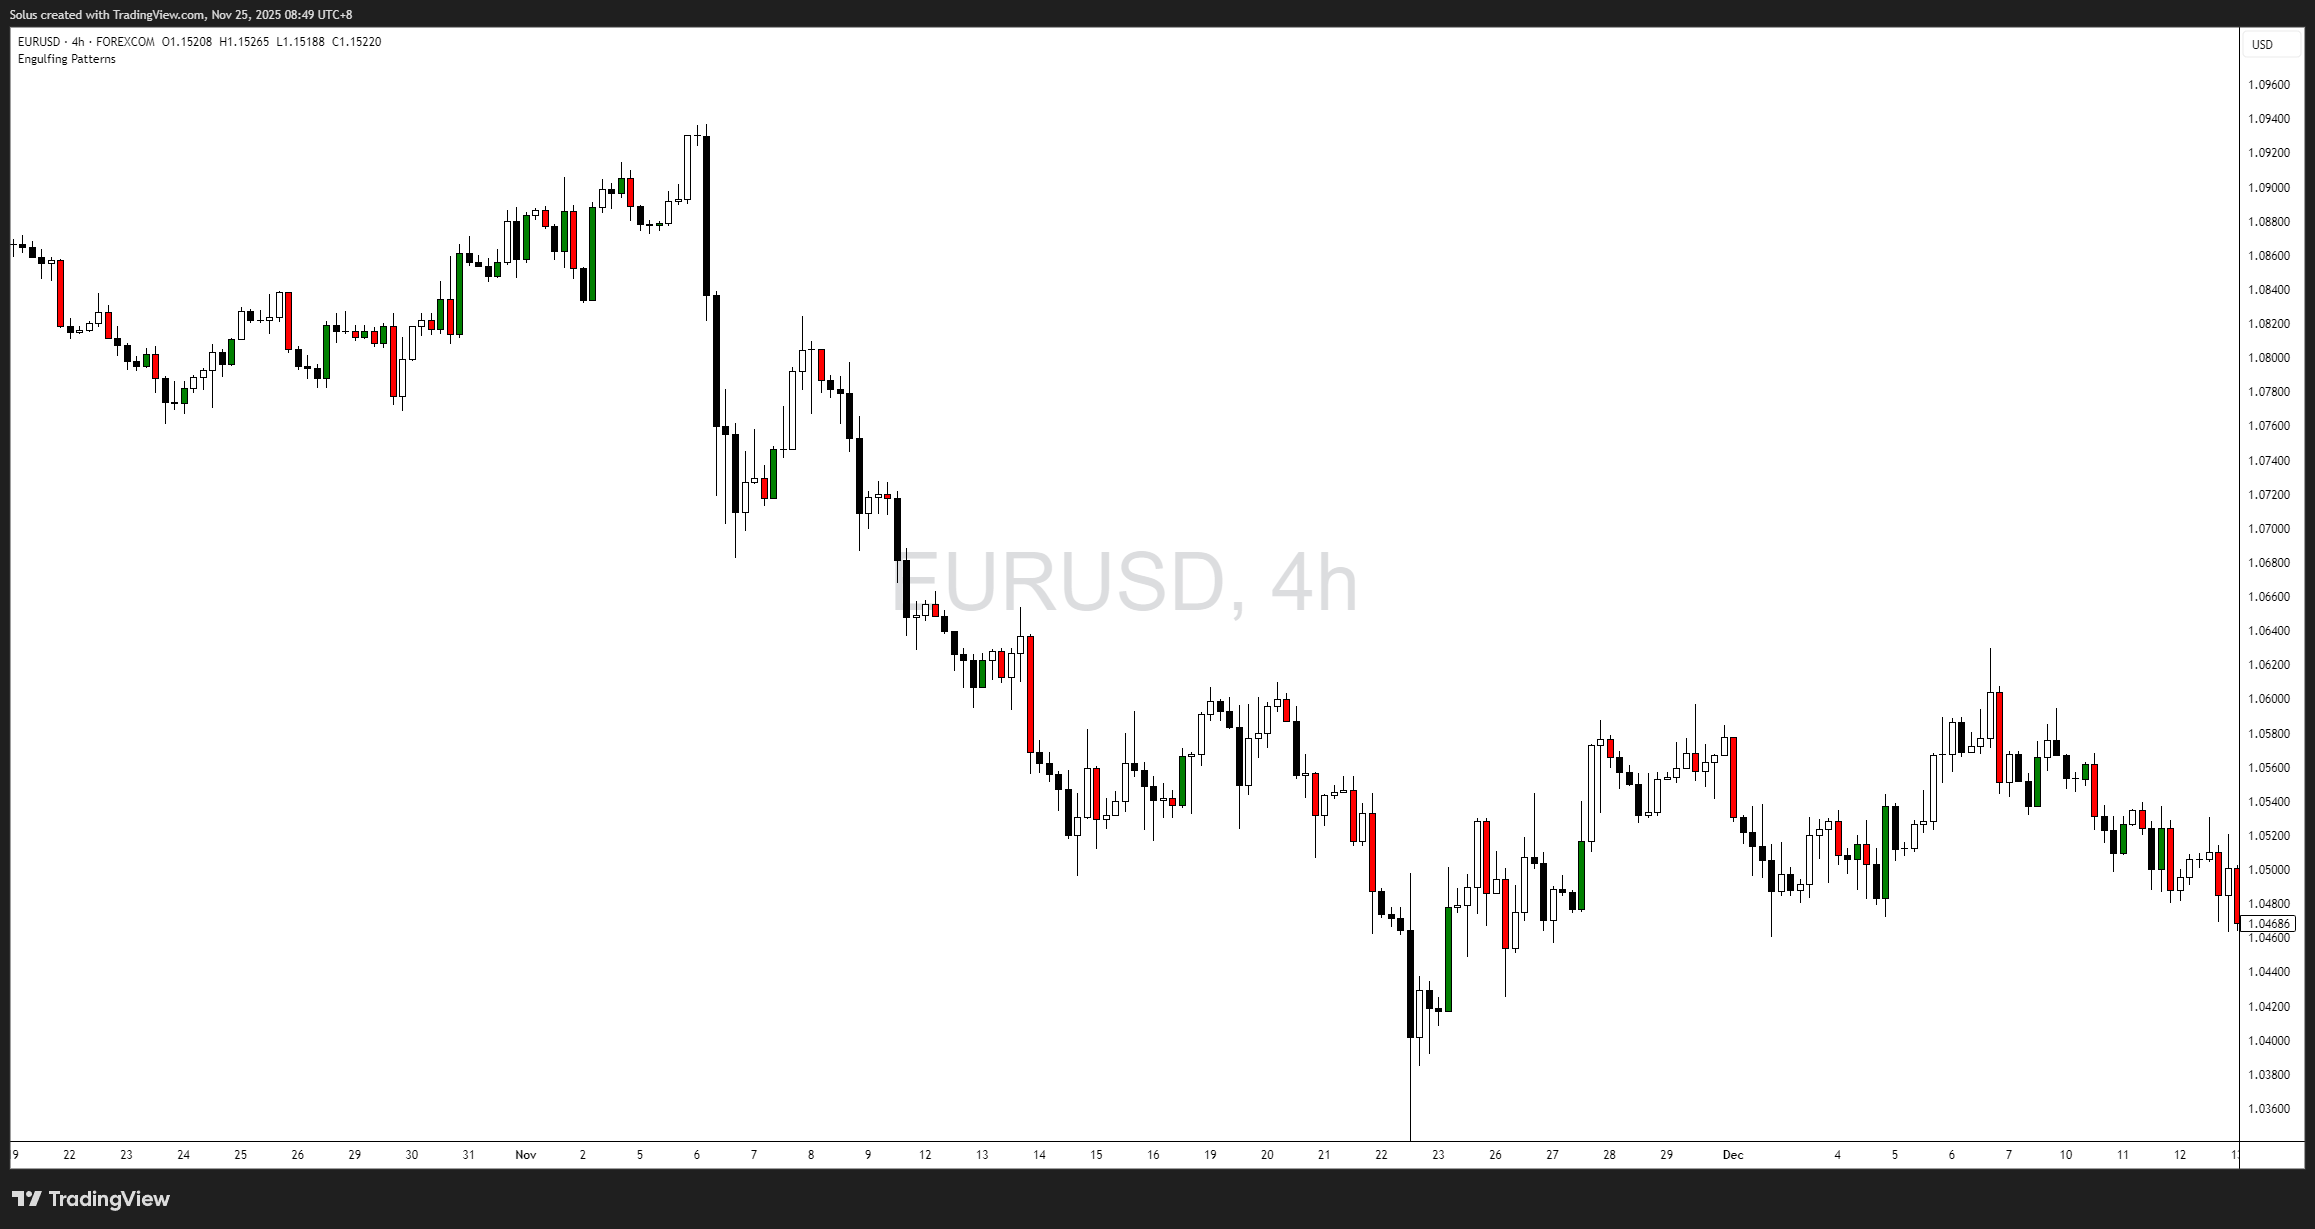
2. Downtrend – Lower Highs & Lower Lows
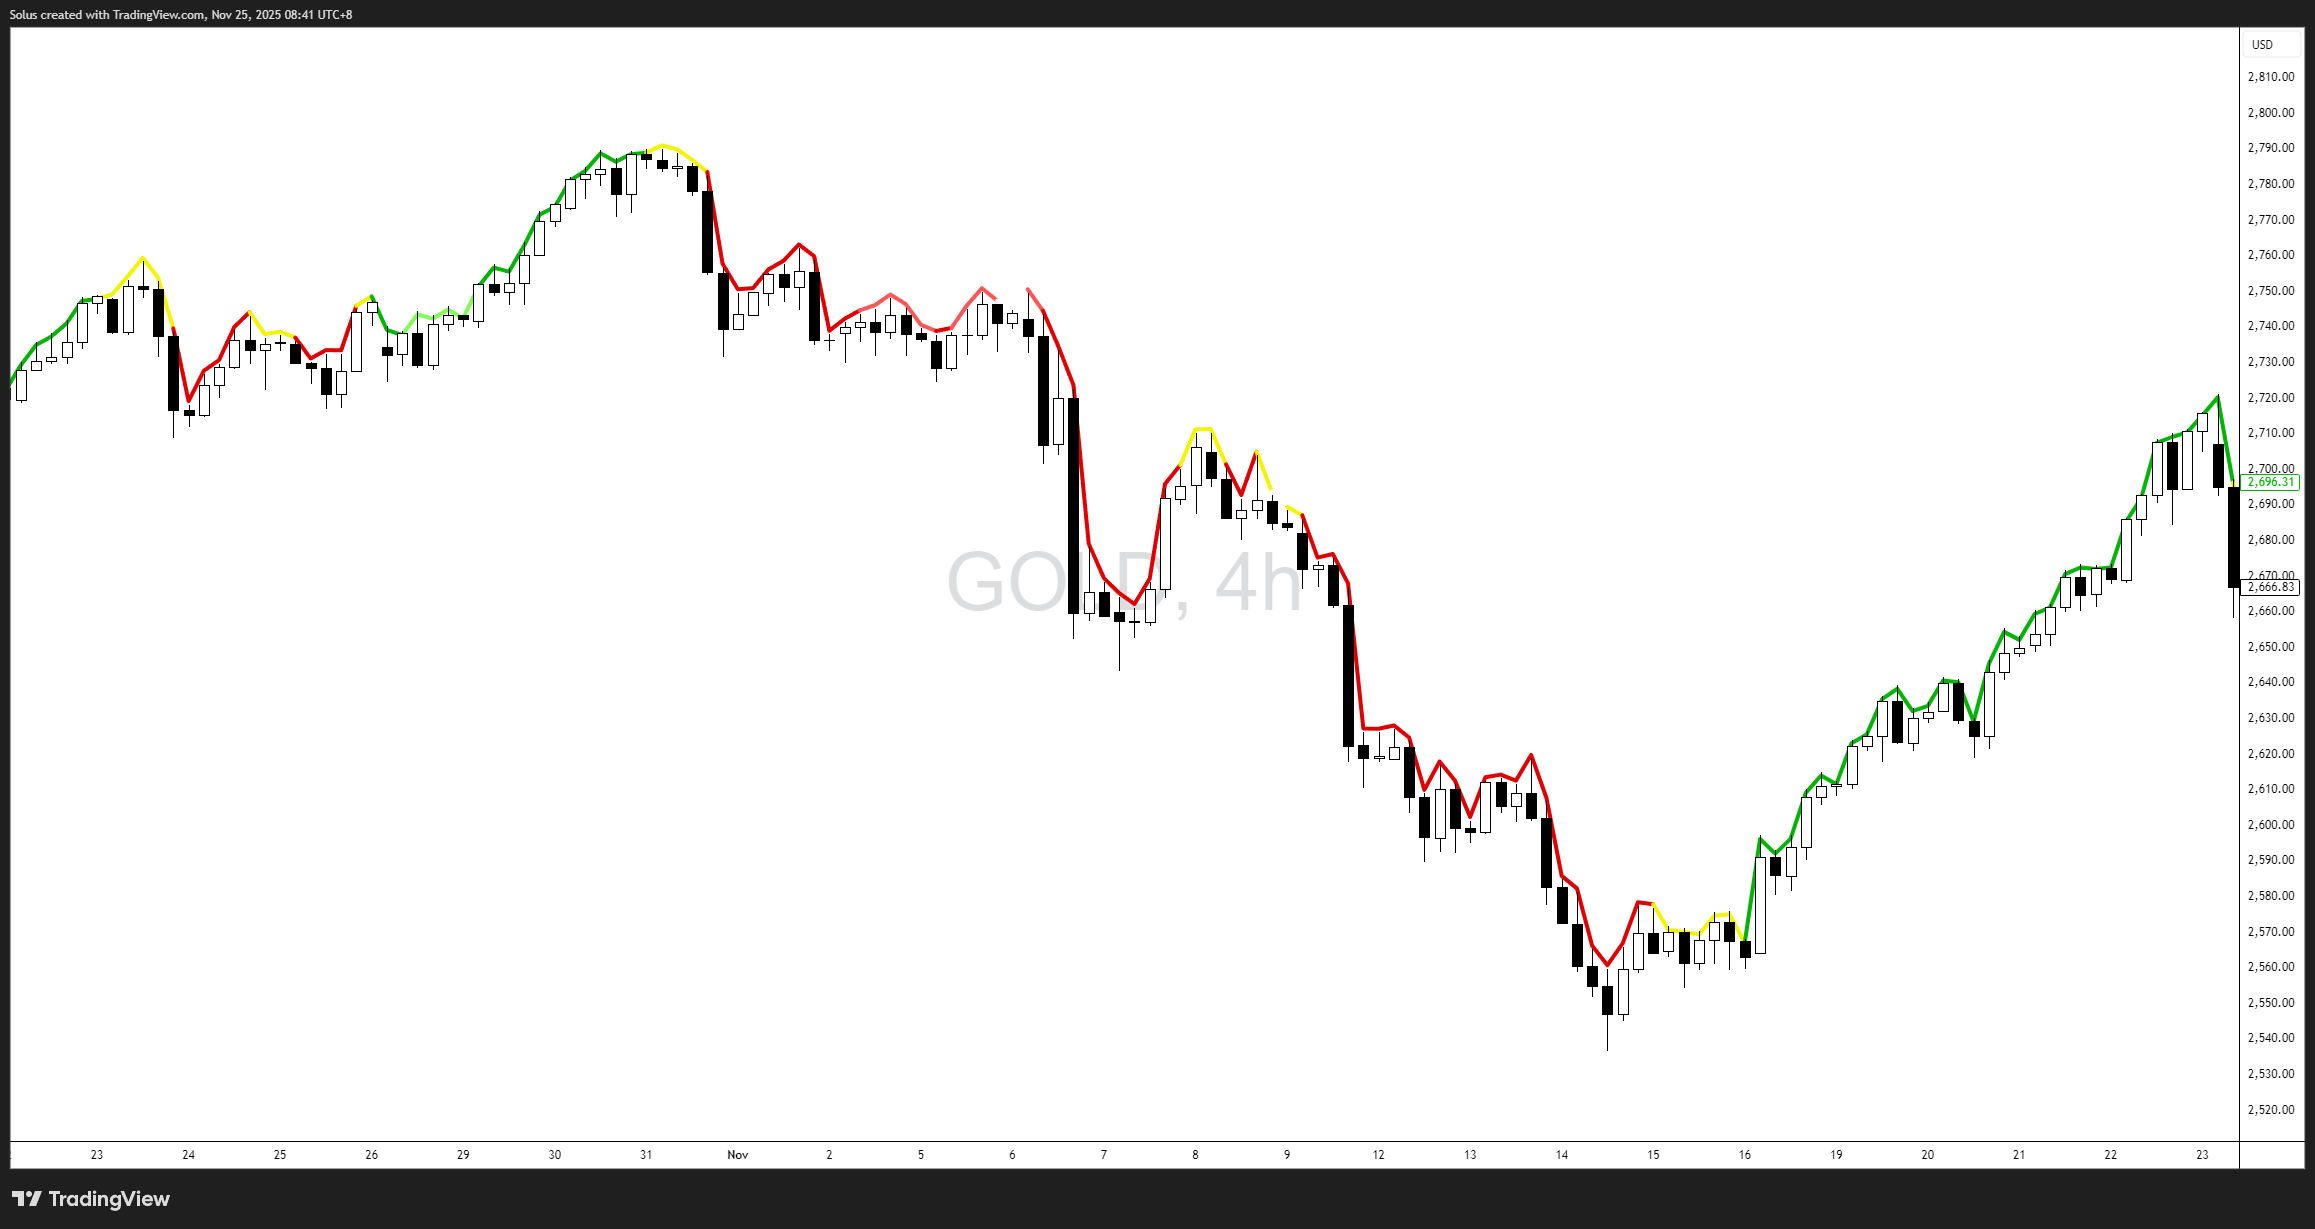
A downtrend reflects weakness.
Sellers dominate, and each rally is swallowed by stronger bearish pressure.
Characteristics:
- New lows that cut through previous lows
- Pullbacks that stall early
- Lower highs forming consistently
- Strong bearish candles during impulsive moves
Downtrends often move faster because fear and forced liquidations accelerate selling, especially around major events like NFP or CPI that you might later trade using structured news strategies such as Smart Money Concepts in news-driven markets.
3. Range – Sideways Structure
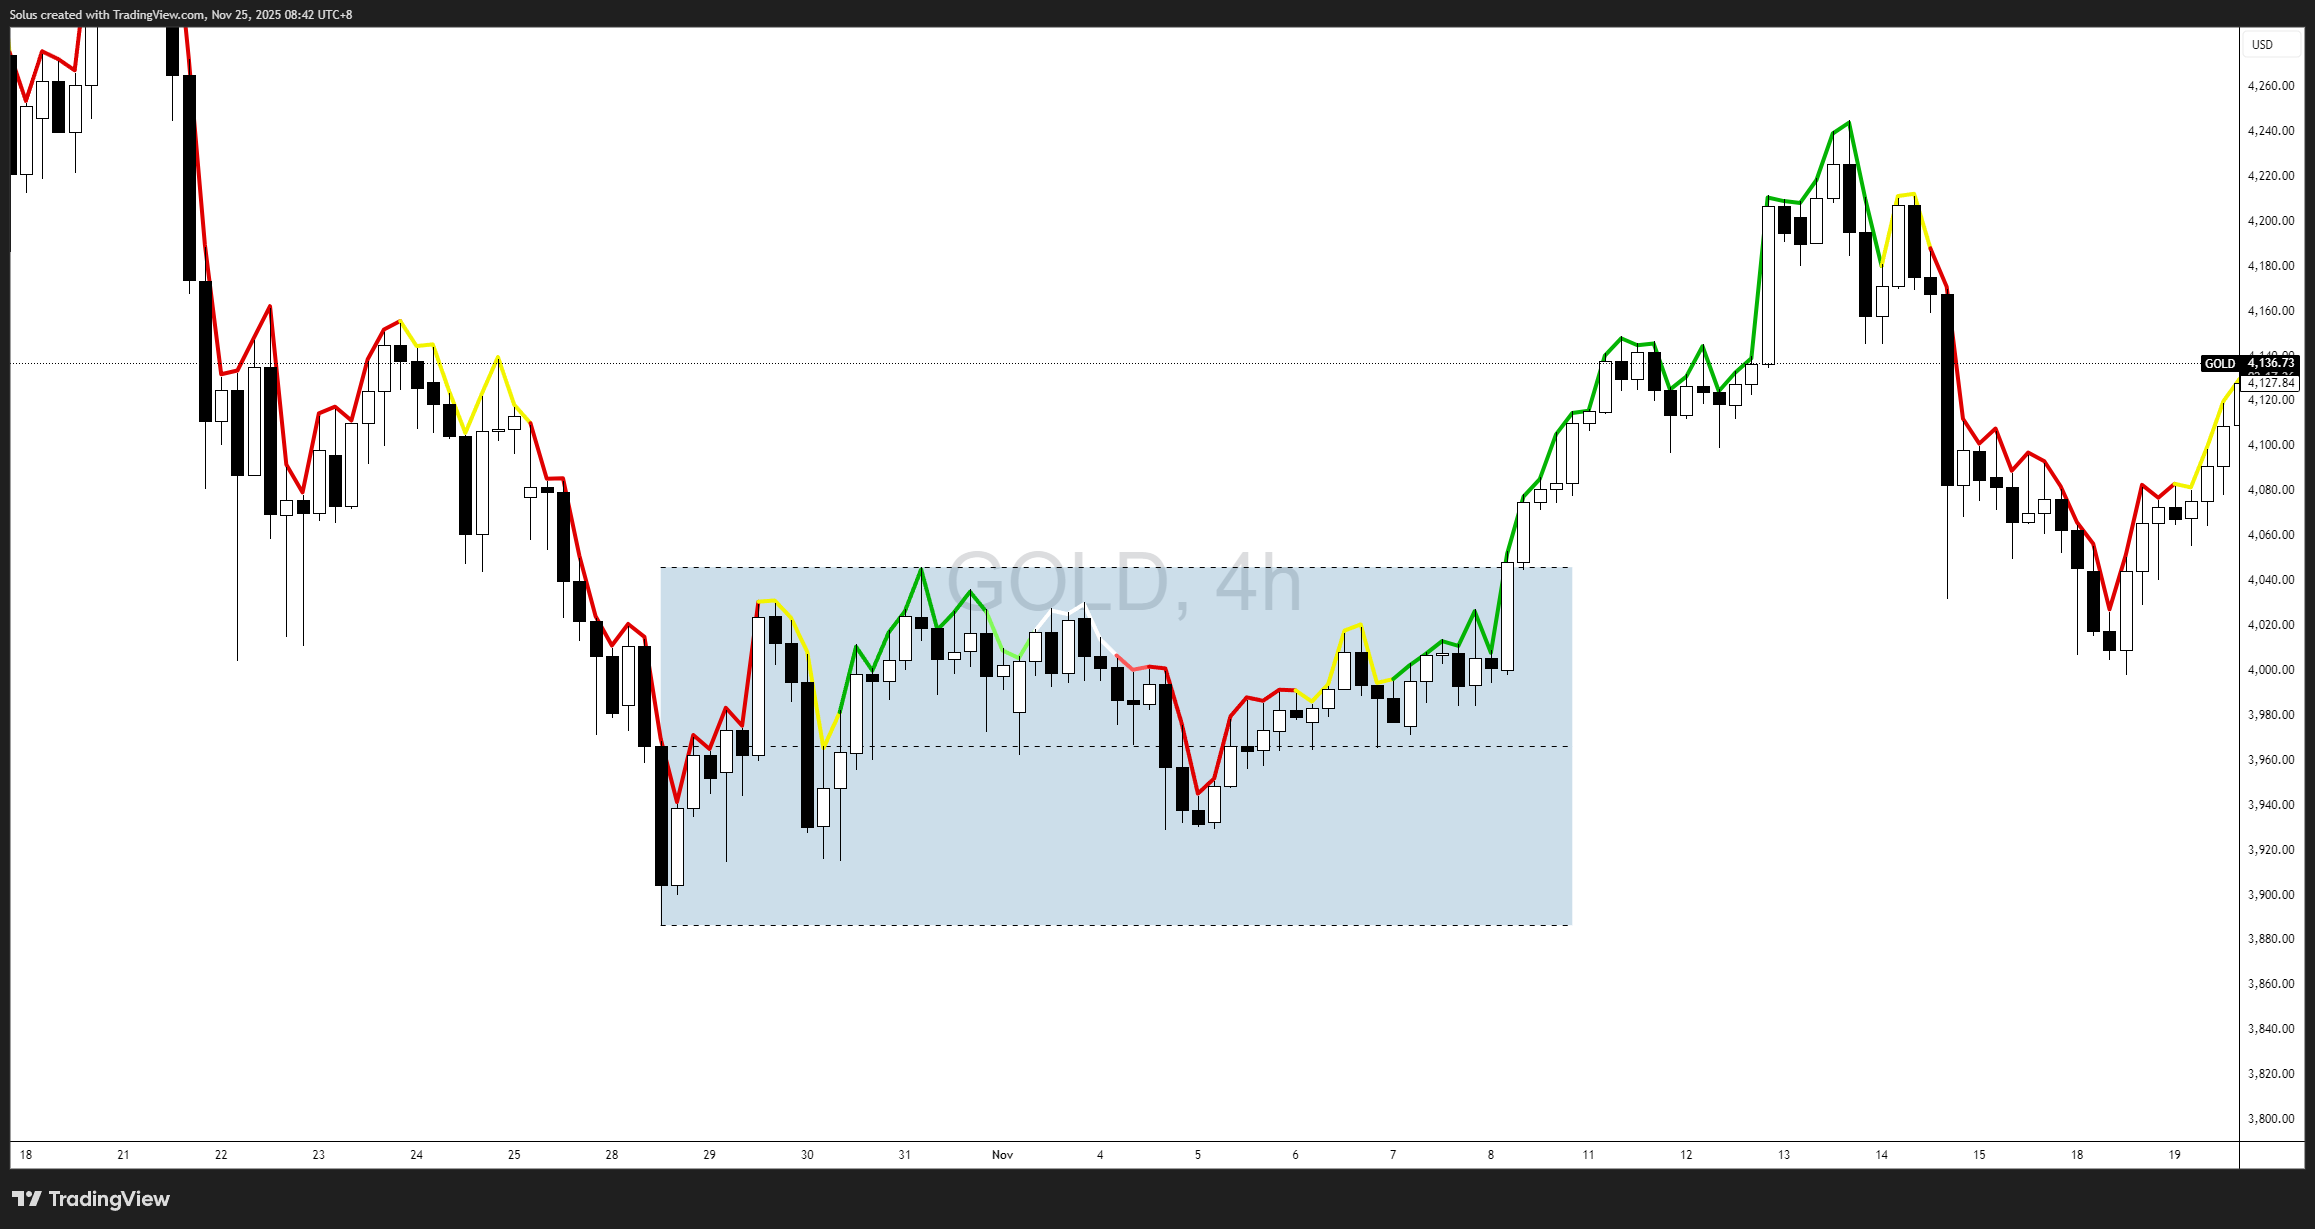
A range forms when neither buyers nor sellers have clear control. Price oscillates between support and resistance, building liquidity above and below the boundaries. Many traders swing trade these conditions, using principles similar to the ones outlined in The Market Basics for Swing Trading.
Characteristics:
- Clear top and bottom boundaries
- Price oscillates without breaking out
- Liquidity builds above and below the range
- Breakouts often follow prolonged consolidation
If you can learn to identify a range early, you cut out a large portion of low-quality trades.
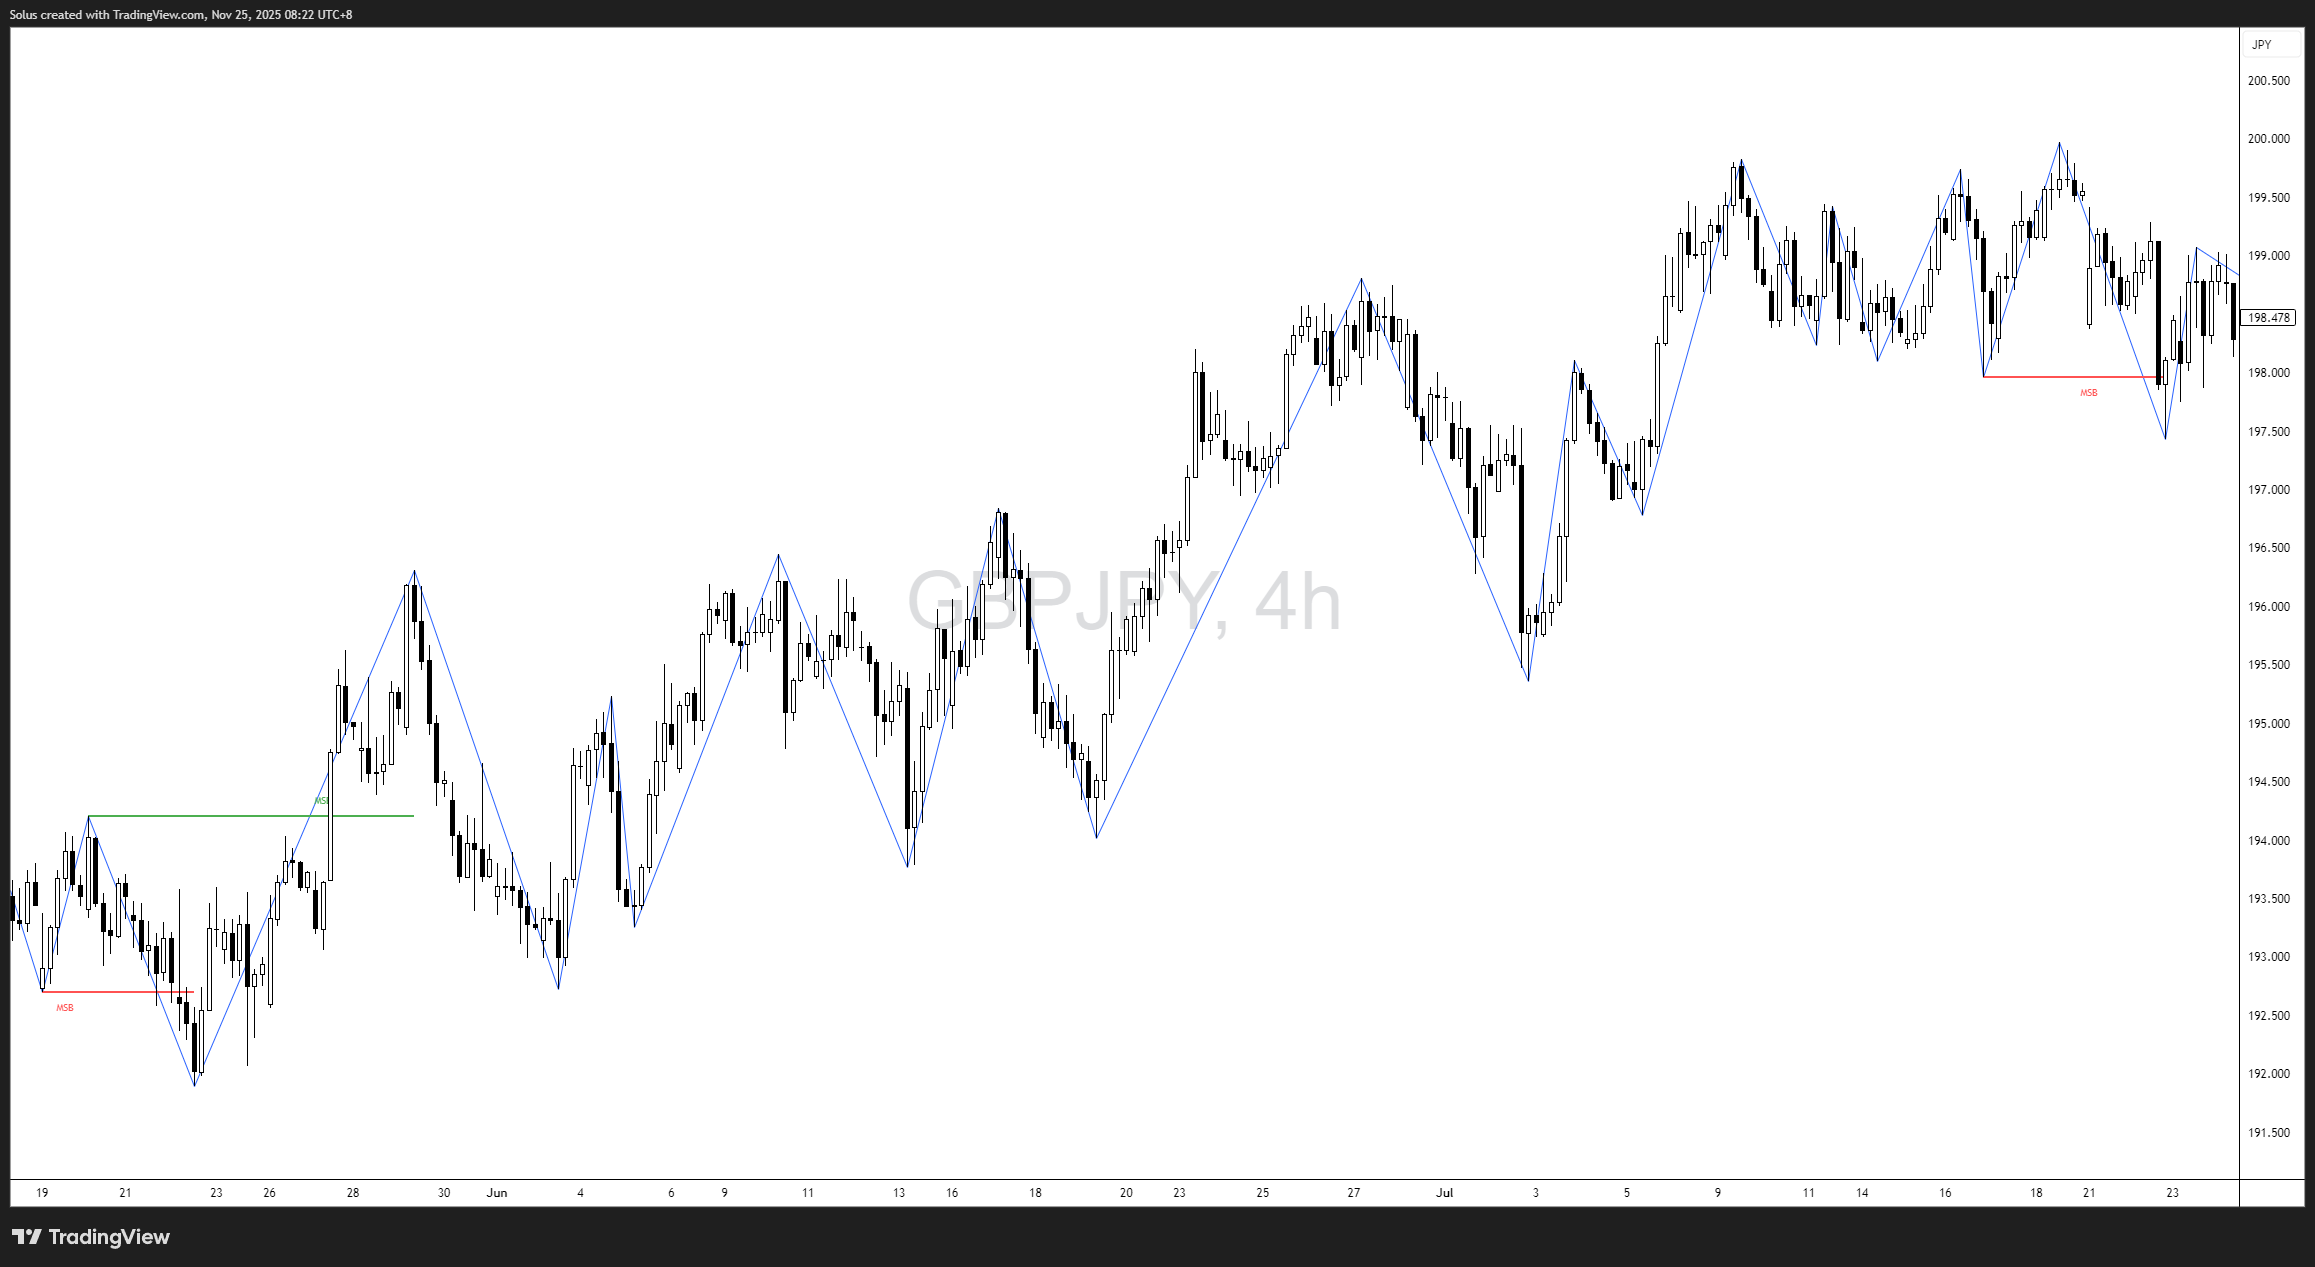
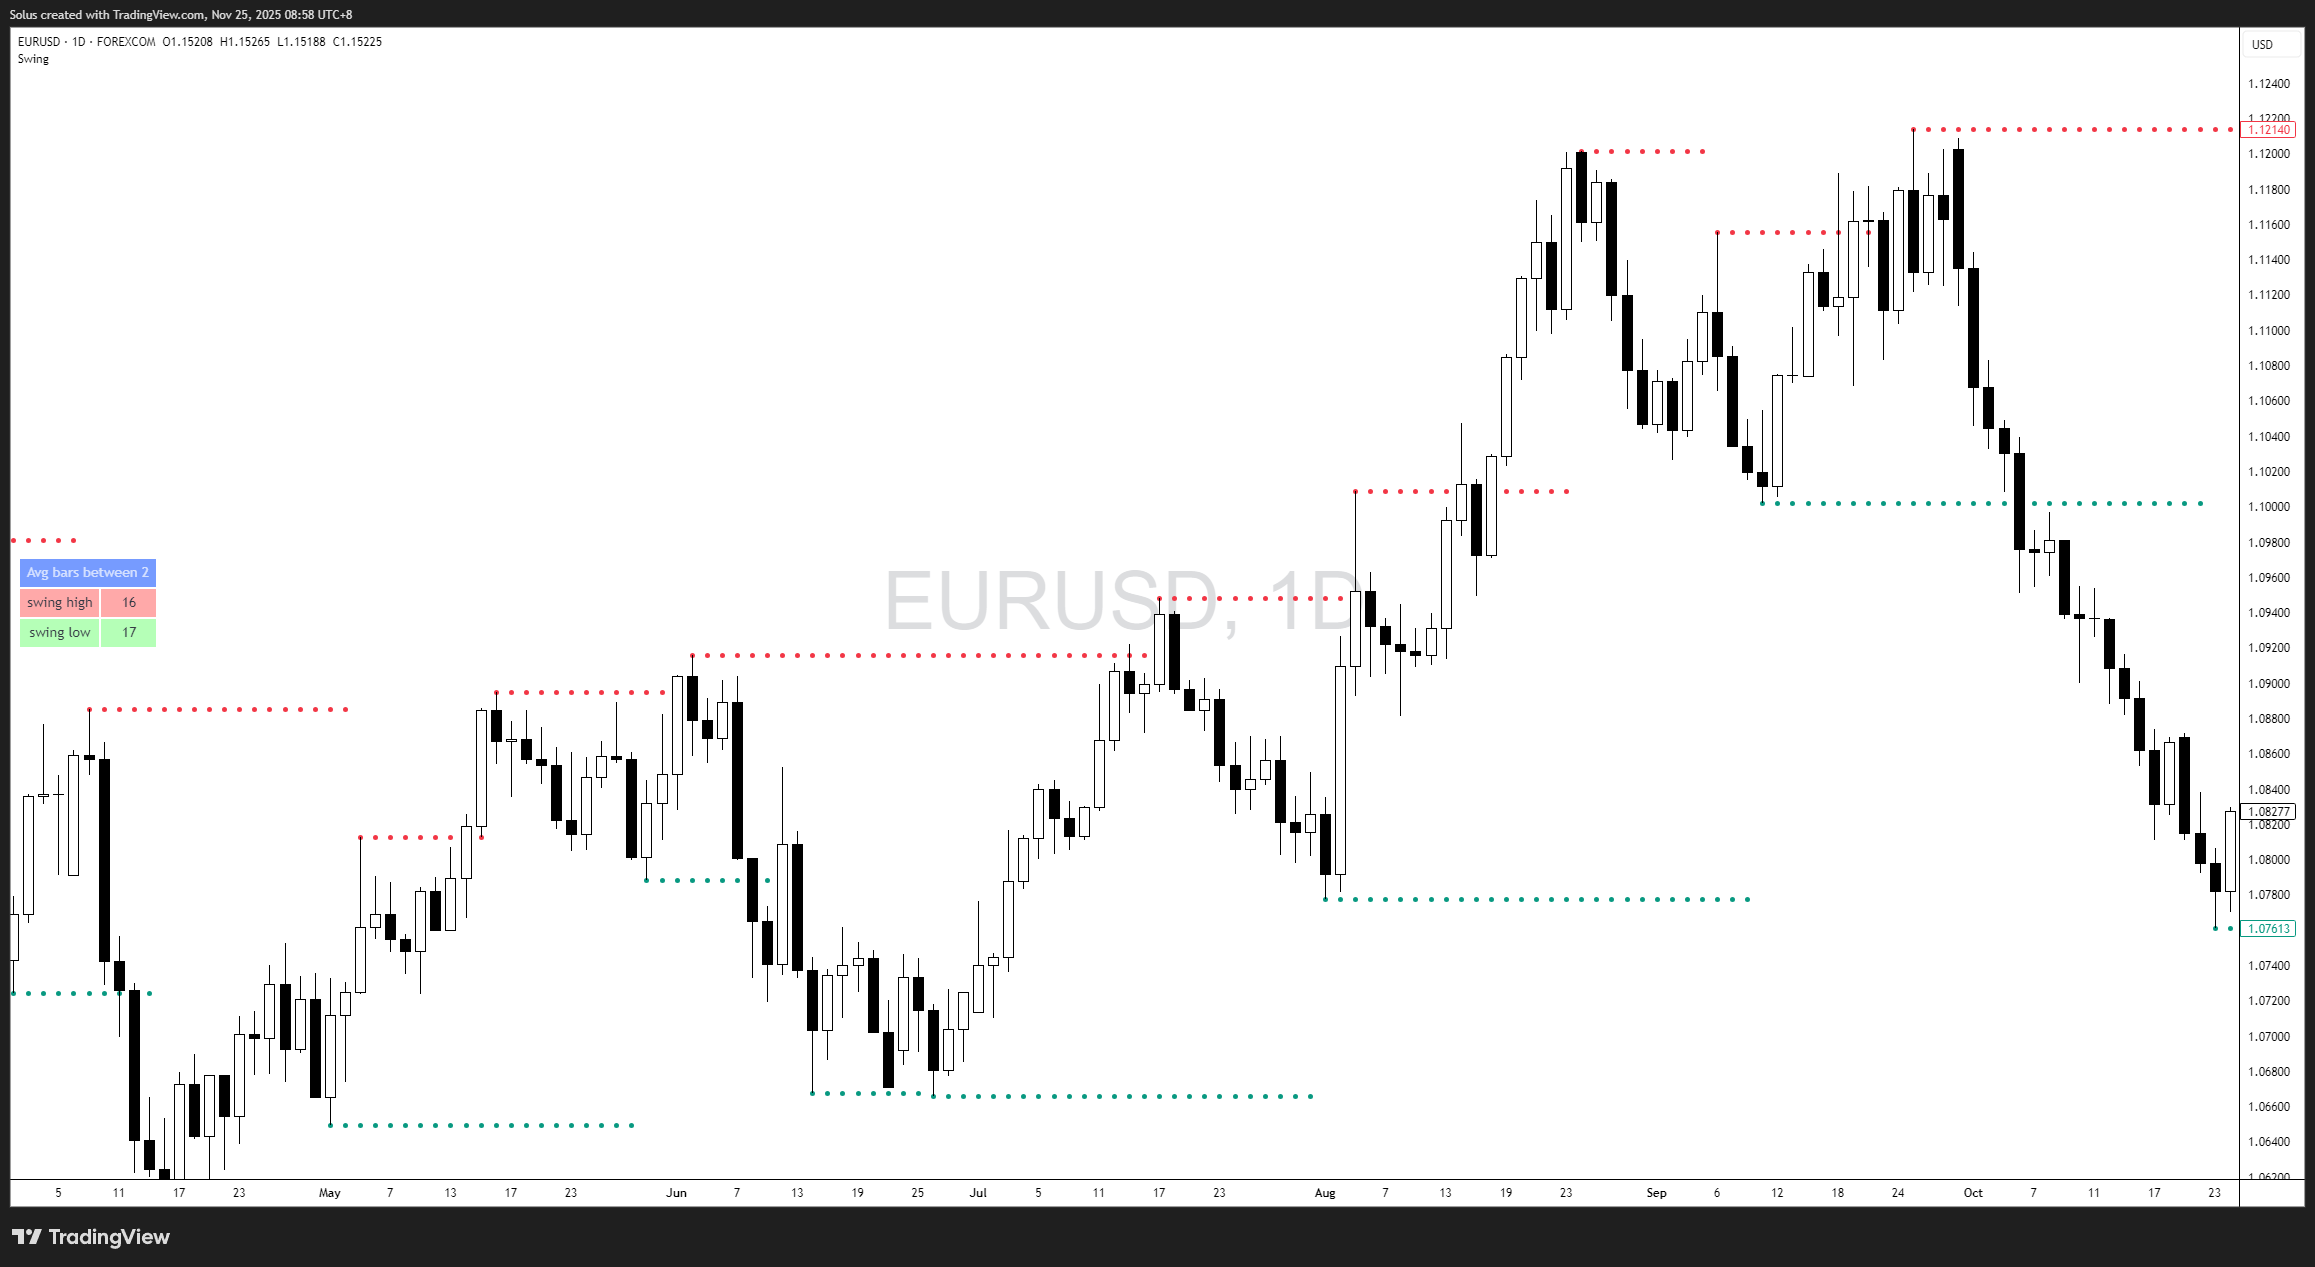
Swing Highs & Swing Lows - The Skeleton of Structure
Swing highs and swing lows are the “bones” of market structure. They show you where the market rejected price and turned in the opposite direction. Learning to see these clearly will not only help you map trend, but also protect you from classic traps like stop hunting, which is explored more in Stop Hunting 101: How Swing Highs and Lows Become Liquidity Traps.
Swing High
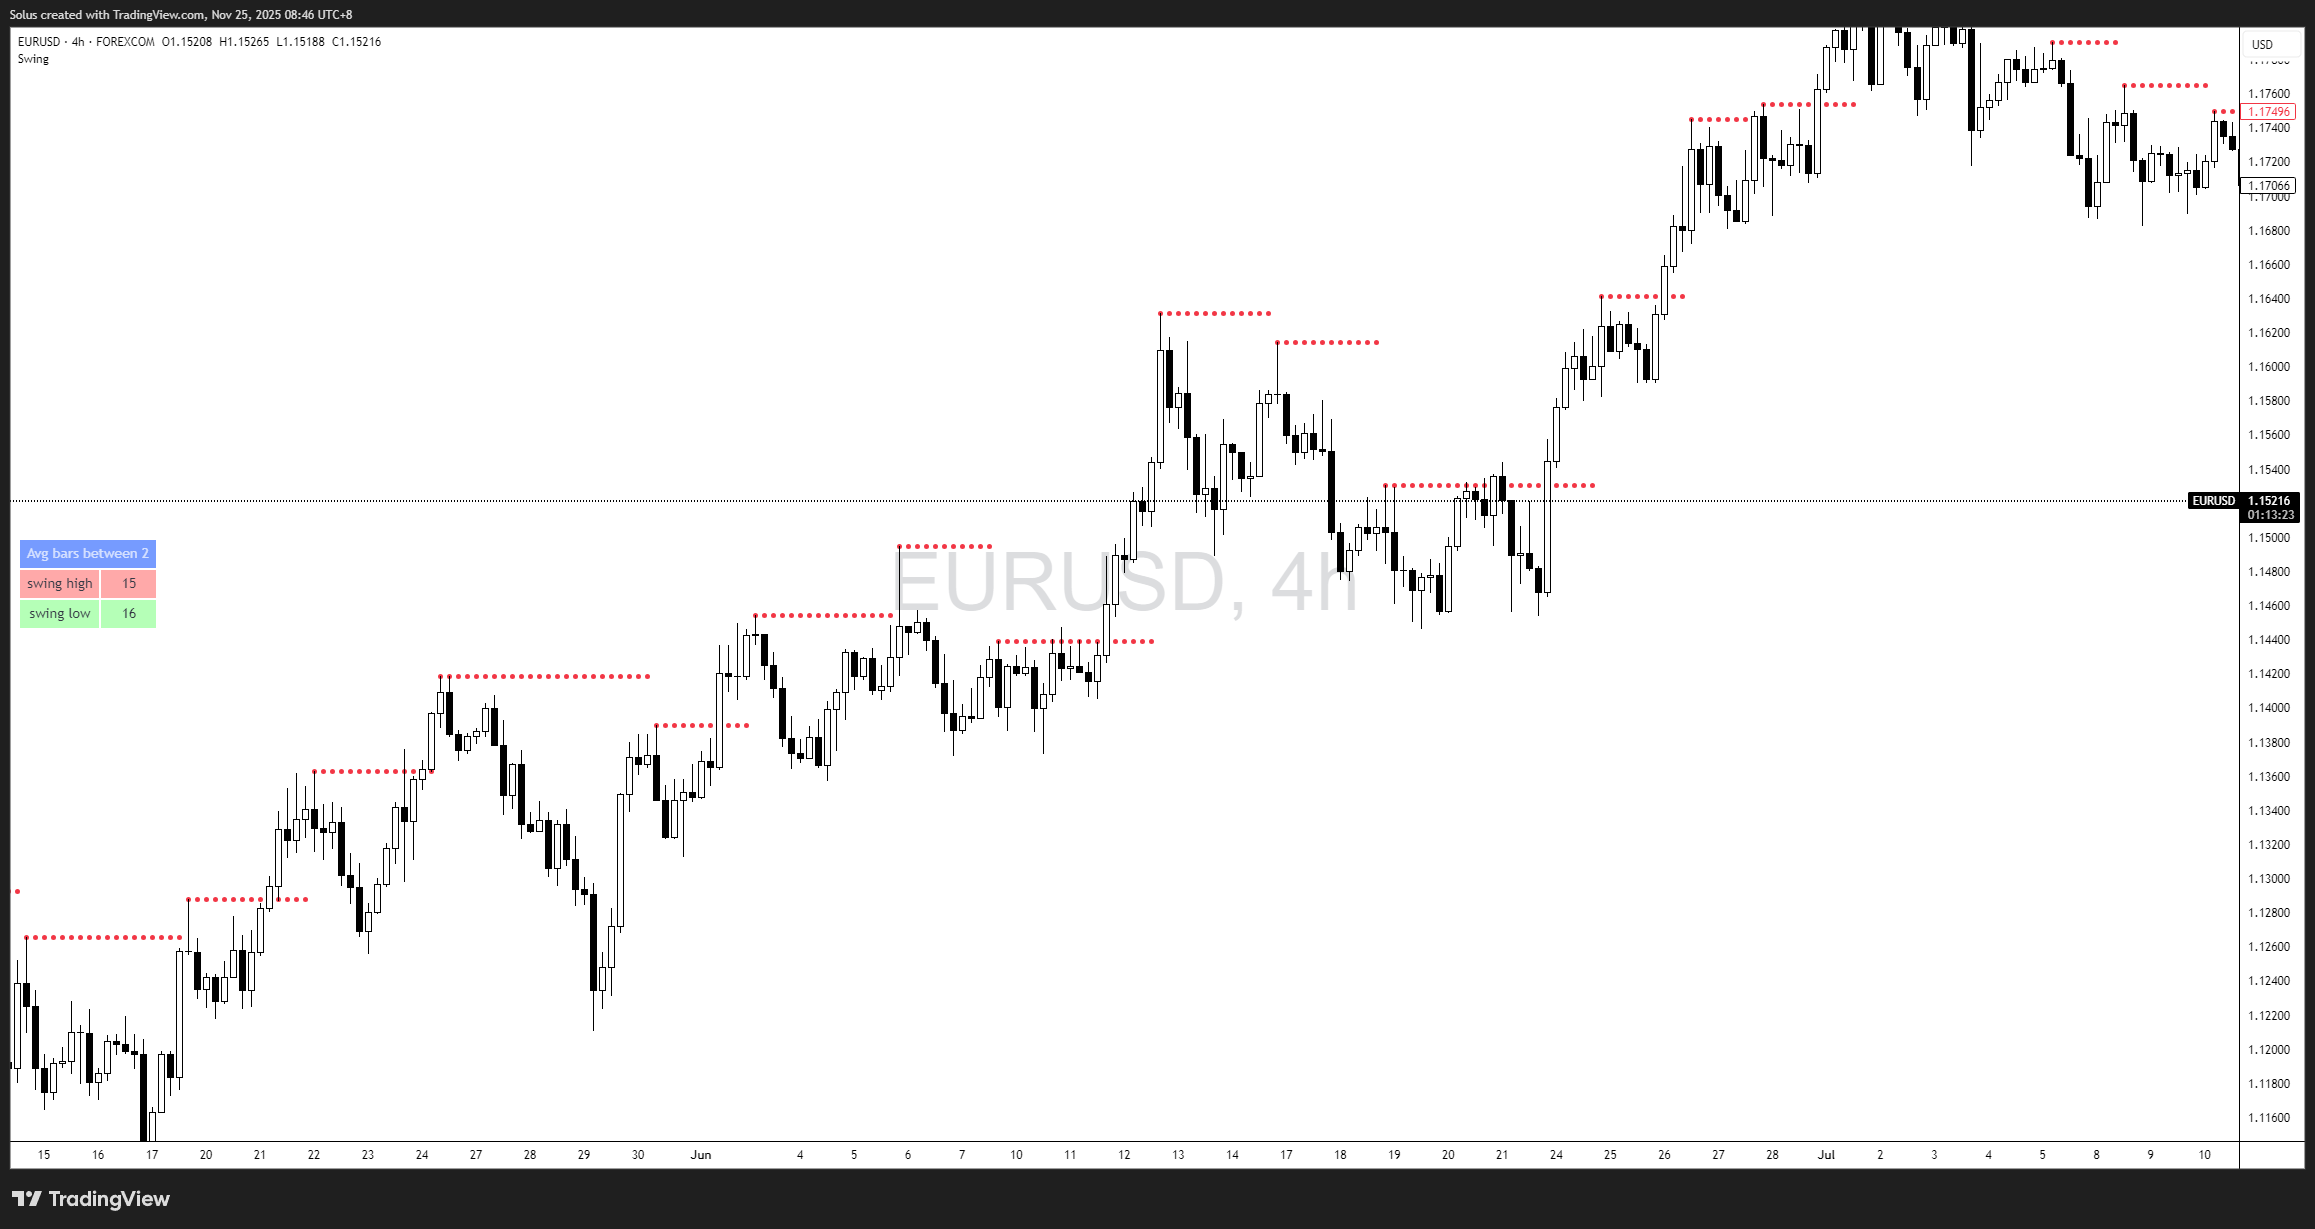
- A peak
- Formed when price fails to push higher
- Signifies exhaustion in buying pressure
Swing Low
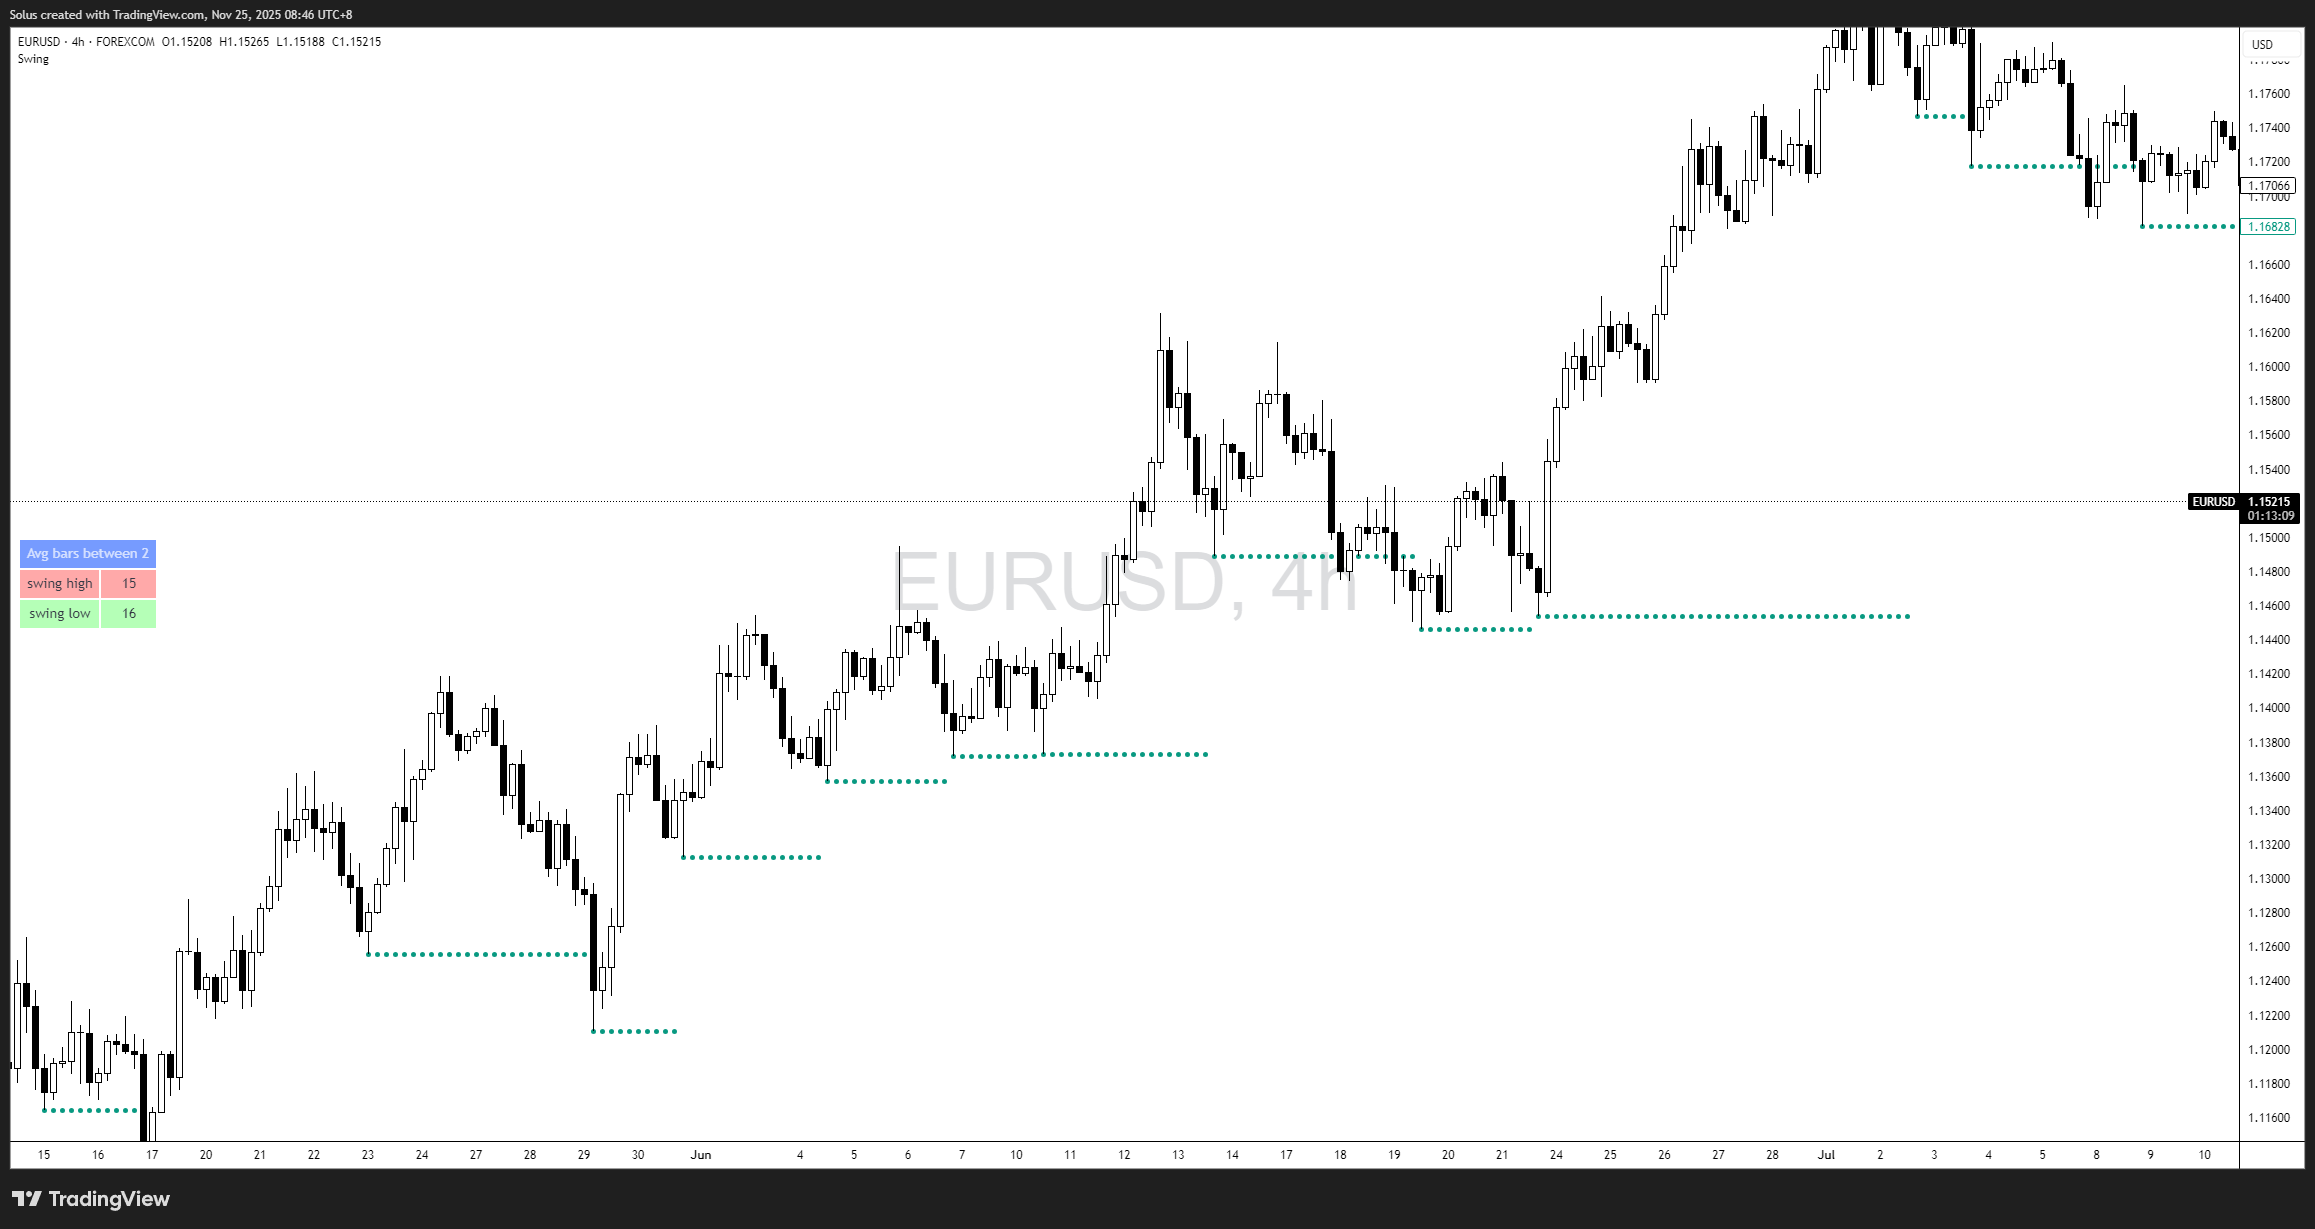
- A valley
- Formed when price fails to push lower
- Signifies exhaustion in selling pressure
These points are not random.
They form the “stepping stones” the market uses to reveal trend direction.
Without swing points, you cannot identify a trend.
Without identifying a trend, you cannot read intent.
And without reading intent, you cannot anticipate what comes next.
Support & Resistance – Price Memory
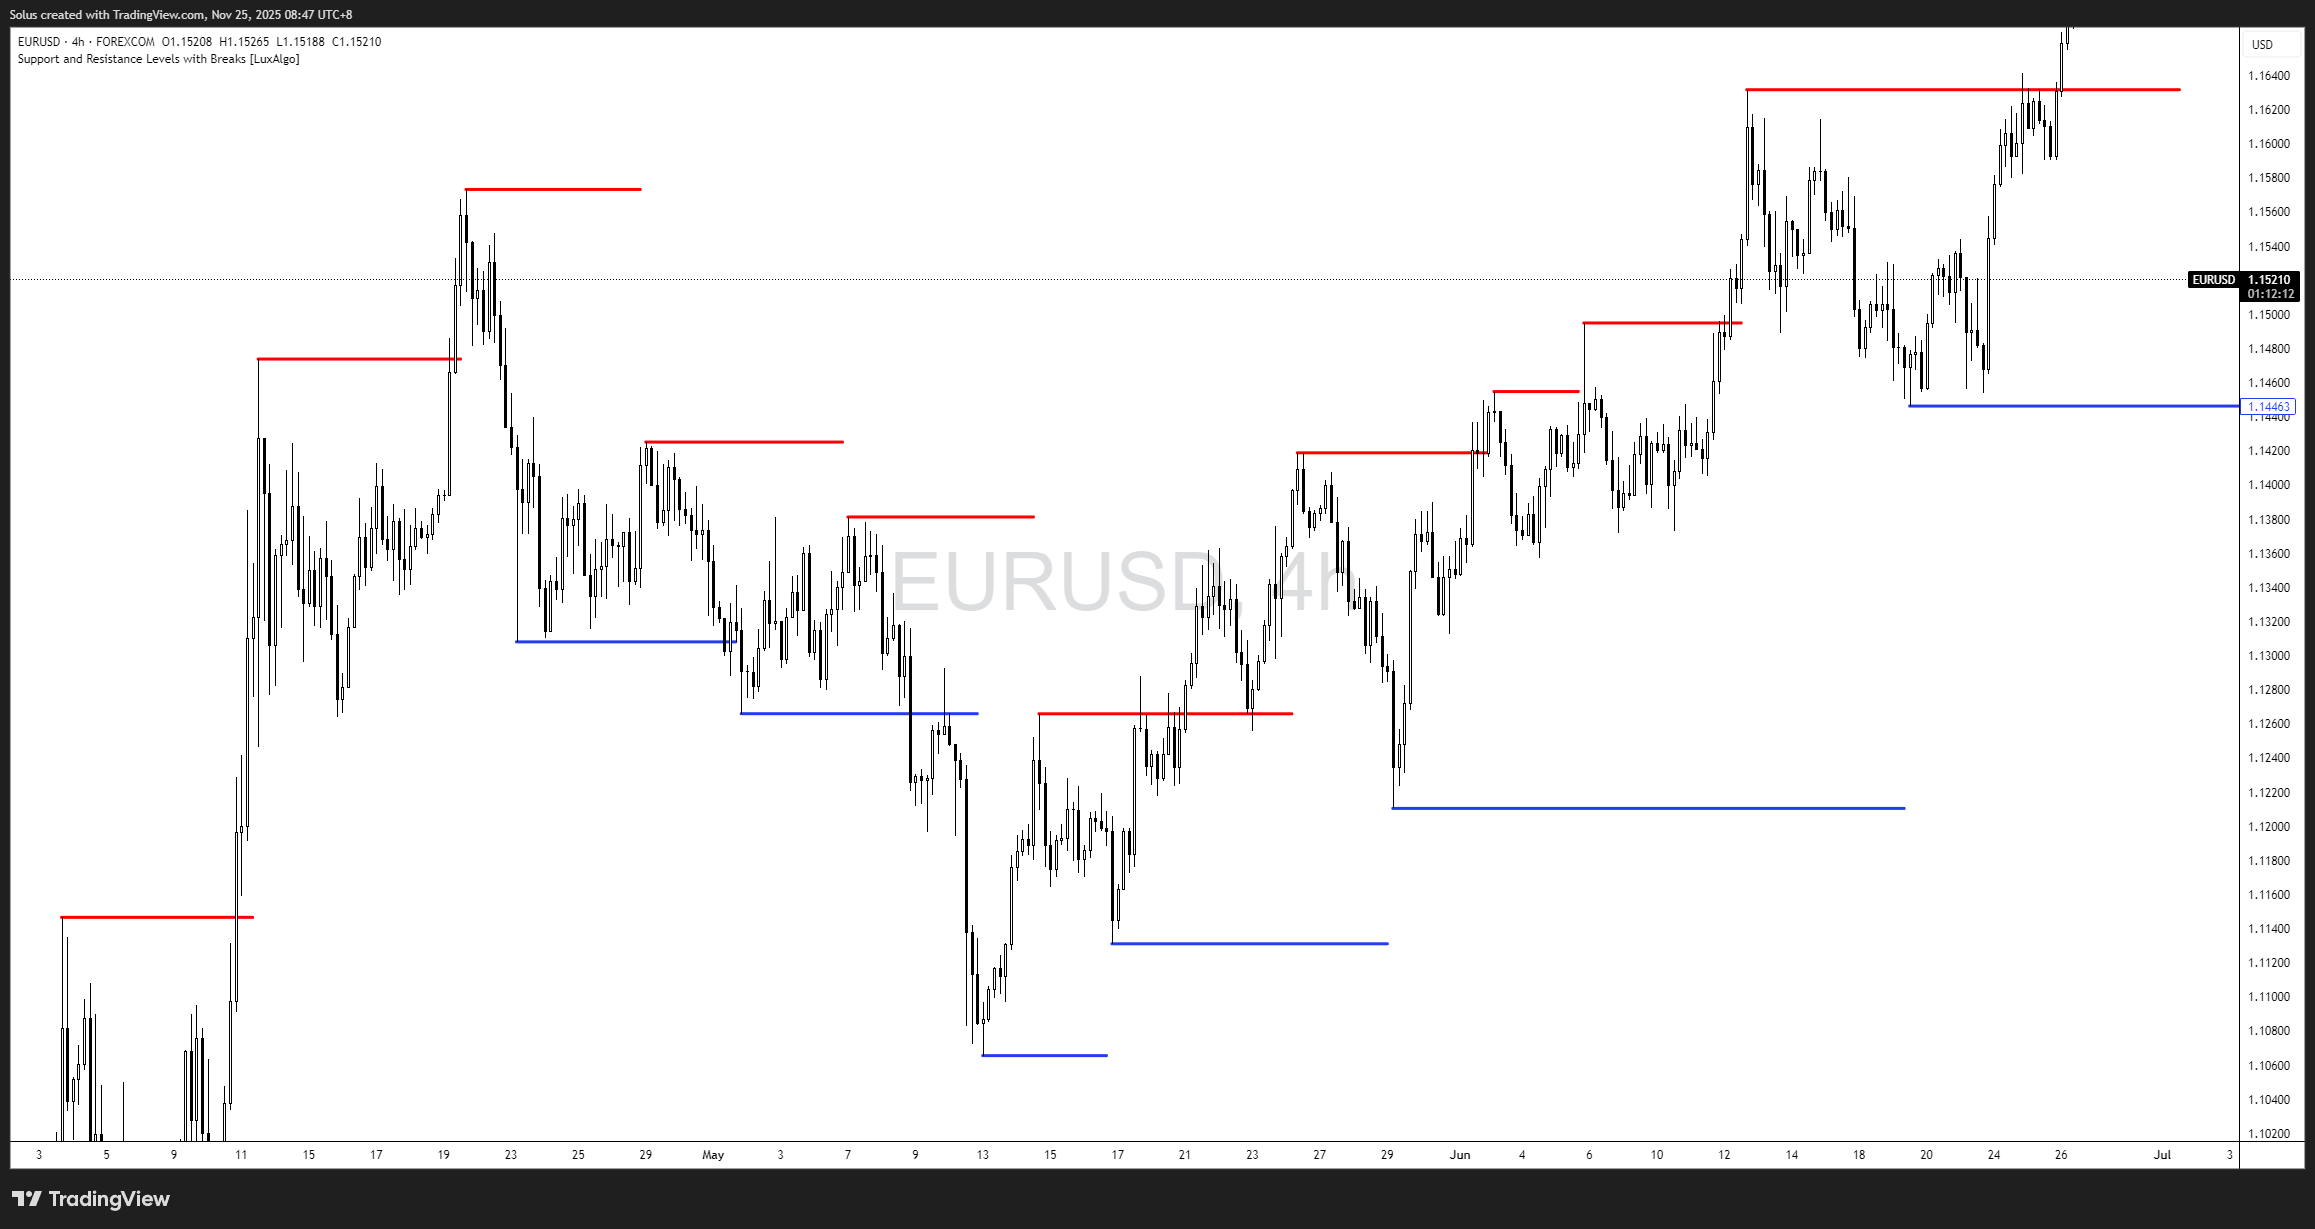
Support and resistance form naturally from swing highs and lows.
They are not magical zones. They are simply areas where buyers or sellers showed clear intent.
Support
A level where downward movement stopped and buyers responded.
Resistance
A level where upward movement stalled and sellers responded.
Most beginners complicate this by drawing countless levels.
Professionals do the opposite:
They draw fewer levels and read more behavior.
Because support and resistance are not about lines - they are about reactions.
You do not need a grid of lines. Professionals focus on the major reaction zones, then combine them with tools like confirmation entries or retest concepts, similar to what is taught in Mastering Retests: How to Enter with Confirmation After a Breakout.
Understanding Market Intent
Market intent is the heartbeat of price action.
Trend tells you where price is heading.
Intent tells you why it’s heading there - and whether it will continue.
Intent is visible through:
- Strength of impulsive moves
- Weakness of pullbacks
- How quickly price rejects levels
- How clean or messy the candles look
- Whether volume or volatility increases
- Whether higher timeframe levels influence behavior
Here’s how to read intent:
Strong Intent
- Long bodies, small wicks
- Fast rejections
- Clean breaks of structure
- Shallow pullbacks
- Higher timeframe alignment
Weak Intent
- Choppy candles
- Deep pullbacks
- Hesitant breaks
- Multiple failed pushes
- Lack of higher timeframe support
Intent is what separates noise from information.
Price can move in a direction, but intent decides if the move has conviction.
As you refine this, you start thinking more like a discretionary price action trader in the spirit of How to Think Like a Price Action Trader.
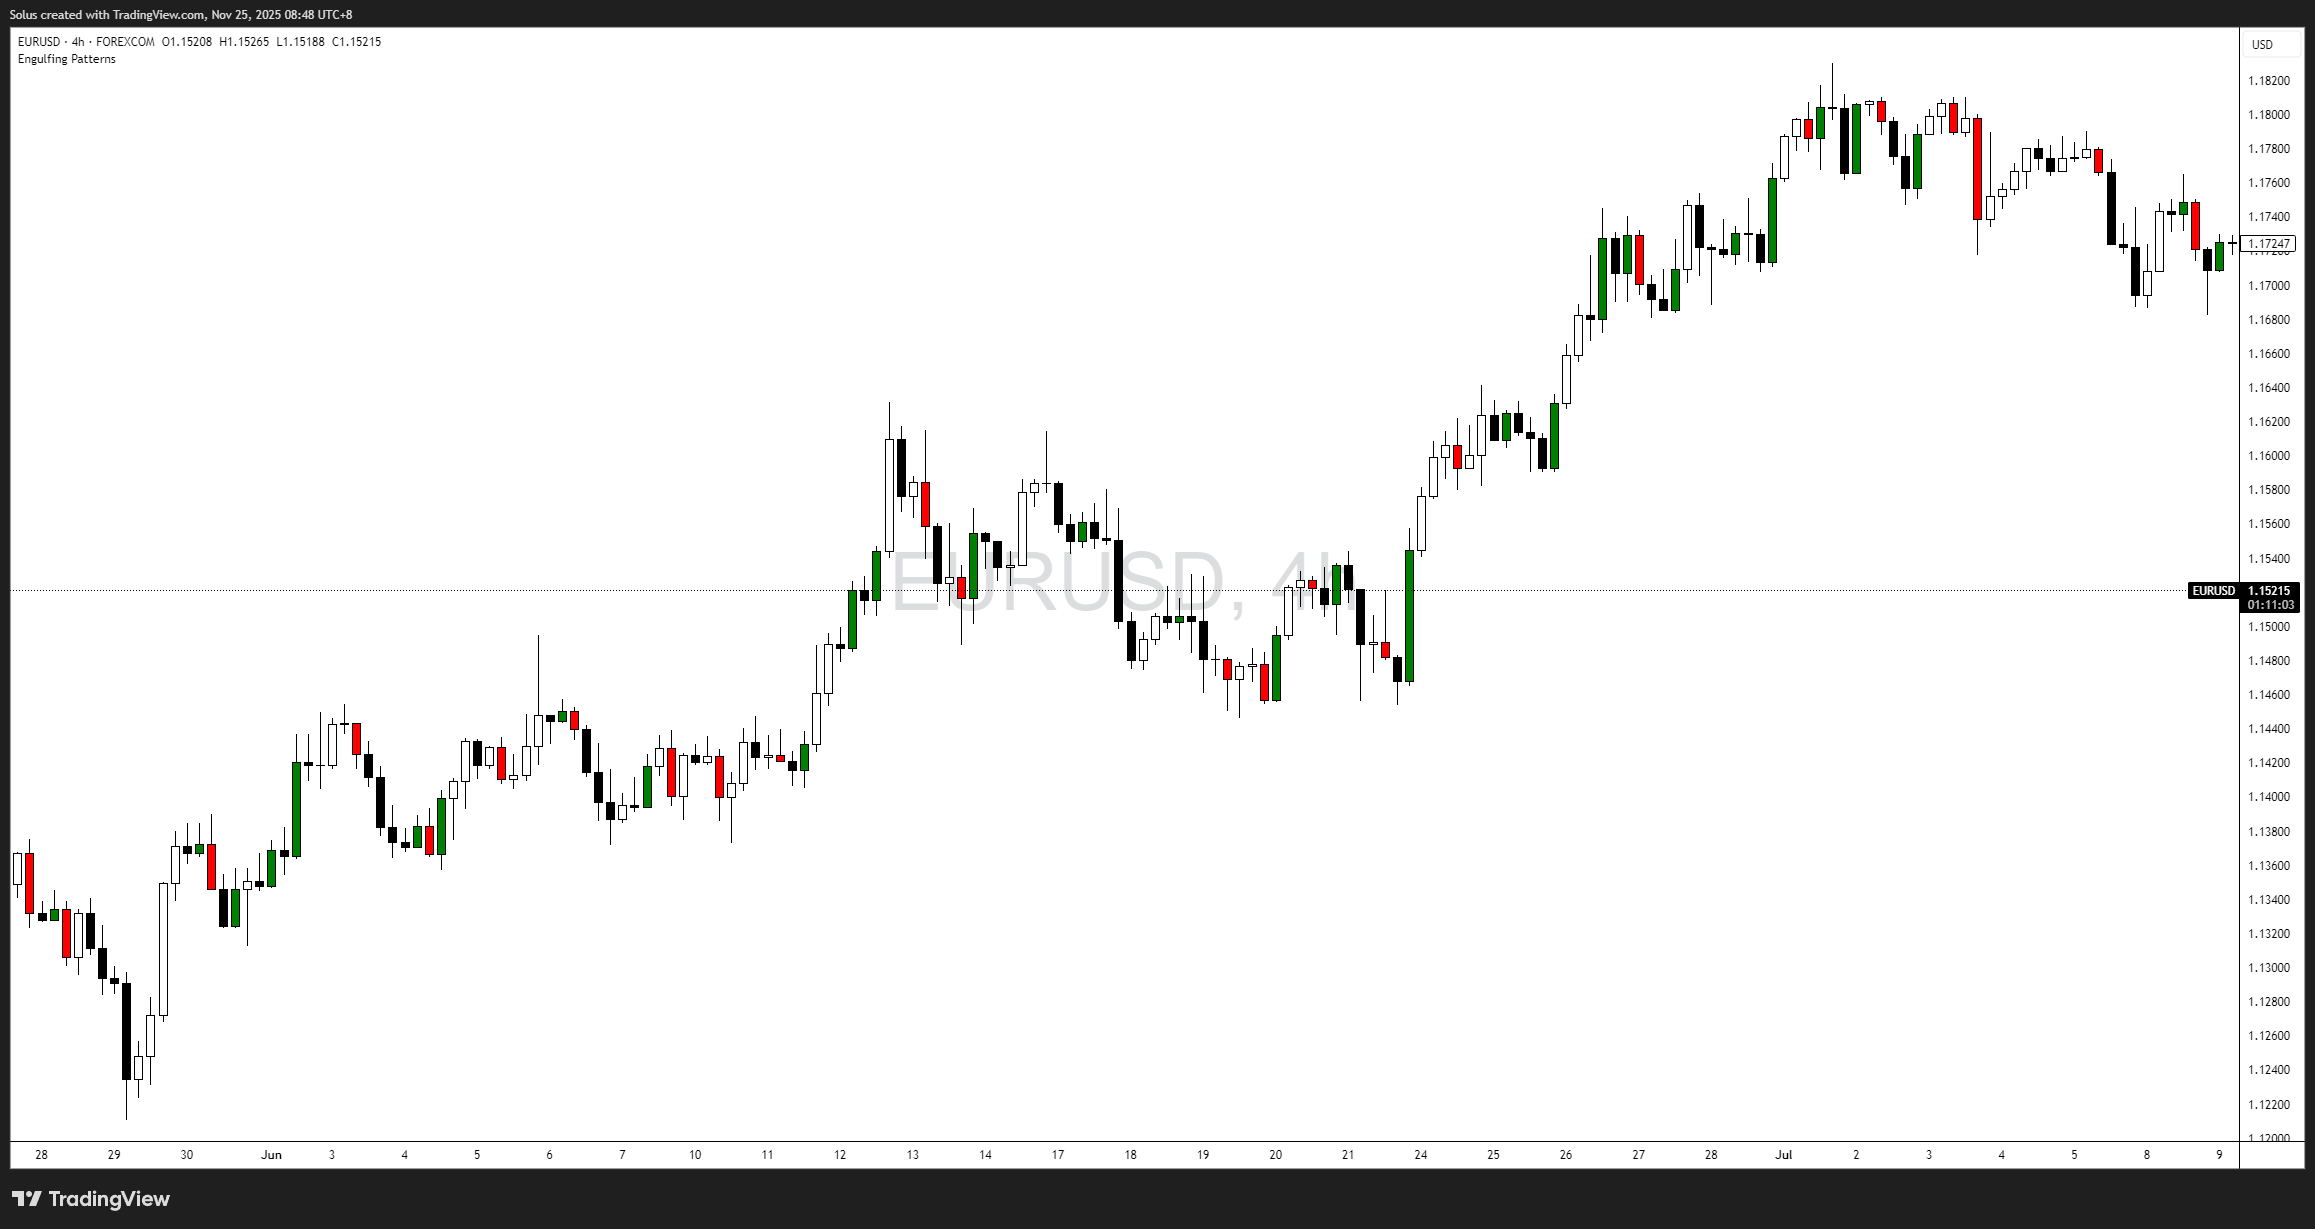
How to Read a Chart Without Indicators
Professional traders often remove everything from the chart except price.
Why?
Because raw price movement tells you more than any indicator ever will.
Use this 5-step method:
1. Zoom Out
Identify the dominant direction.
You cannot judge a trend from a single candle.
This is best by looking at higher timeframes like Daily and Weekly.
2. Mark Major Swing Highs/Lows

These guide your interpretation of trend strength.
3. Identify the Market Condition
Is it trending or ranging?
4. Observe the Depth of Pullbacks
Shallow pullbacks = strong trend
Deep pullbacks = weakening trend
5. Look for Intent
Study how price reacts at major levels and whether it moves with conviction.
This is how traders build a clean, noise-free understanding of the market.
More Insights to Strengthen Your Foundation
Let’s go even deeper - these insights separate beginners from those who truly understand structure.
Market Structure Has a Rhythm
Think of the market like breathing.
The market breathes: expansion, then contraction. It surges, then rests. It trends, then ranges. Swing traders who understand this rhythm can position better during cycles, as outlined in Core Principles of Swing Trading.
It expands, then contracts.
Pushes, then pulls.
Impulses, then corrections.
If you focus too much on the impulse, you panic.
If you focus too much on the correction, you hesitate.
If you understand both, you see flow.
The market is always alternating between strength and weakness.
Your job is not to predict - your job is to observe the rhythm.
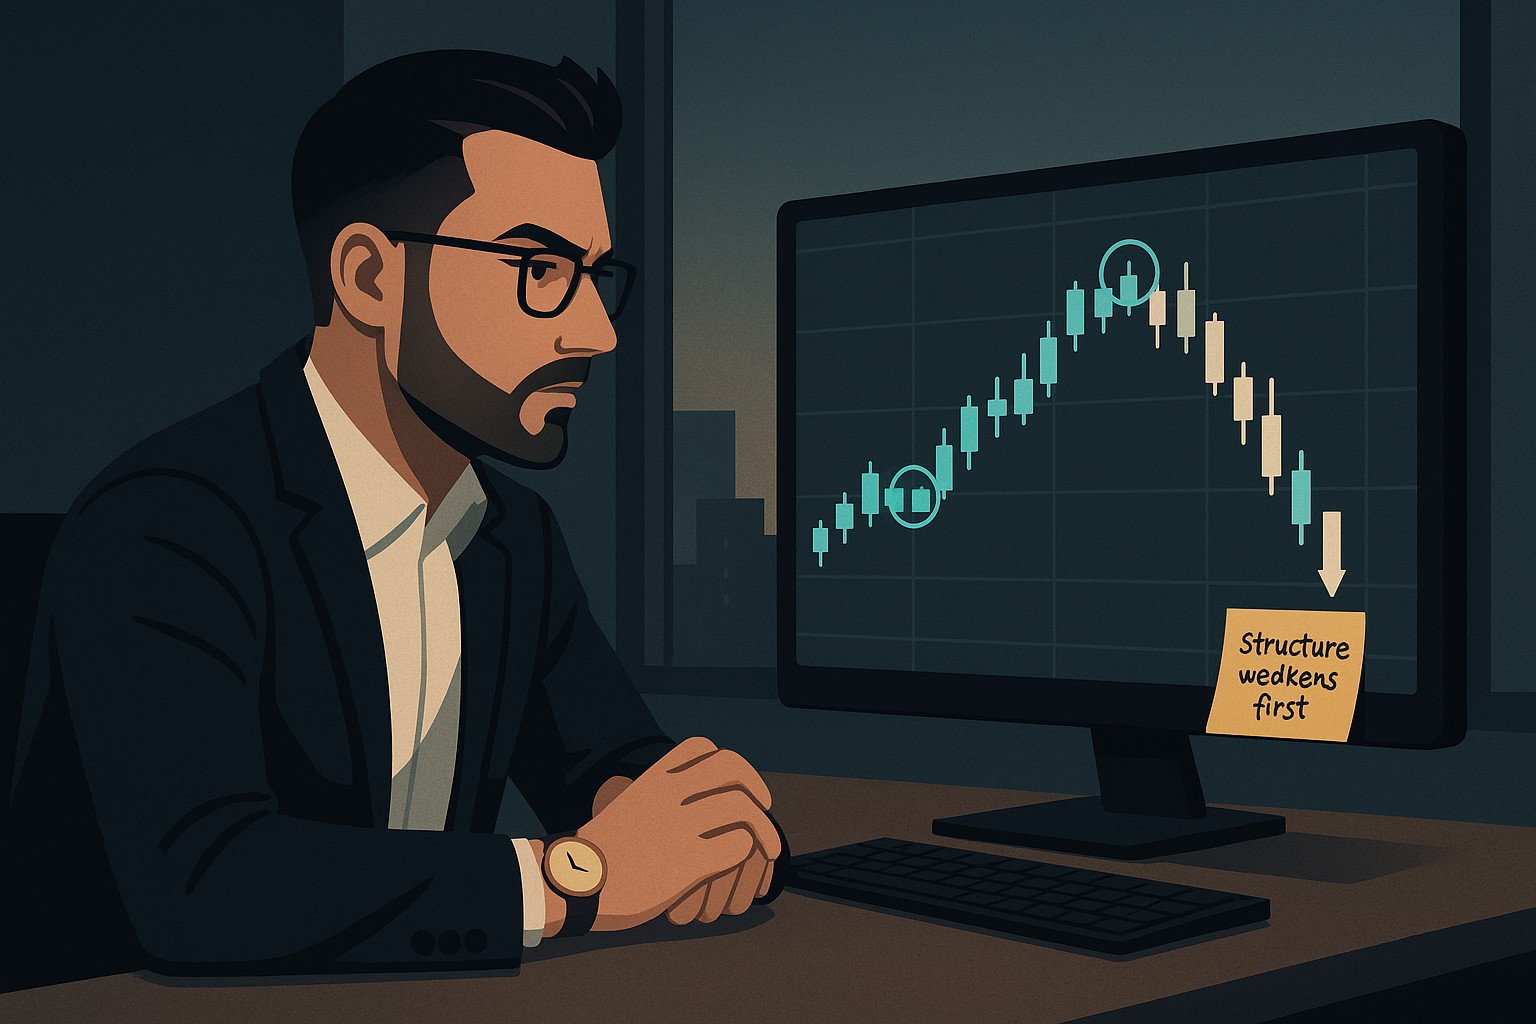
Structure Always Changes Before Trend
Trends don’t reverse out of nowhere.
There are always signs:
- Higher highs stop forming
- Lower lows lose strength
- Candles become choppy
- Price consolidates
- Pullbacks deepen
- Levels get tested more often
Structure weakens before trend shifts.
If you read these early, you avoid overstaying in fading trends and align with new ones earlier. This idea connects well with the way institutional traders think about accumulation and distribution, as described in Accumulation, Manipulation, Distribution: The Hidden Cycle That Runs Every Market.
Structure Across Timeframes Tells One Story
Structure can look bullish on one timeframe and corrective on another. For example, a downtrend on the 5 minute chart might be a simple pullback on the 1 hour. What matters is how you stack perspectives.
When you start reading structure using multiple timeframes together, tools like The Power of Multi-Timeframe Analysis in Smart Money Concepts give you an even clearer roadmap for aligning your bias and execution.
All timeframes tell the same story at different speeds. Your job is to sync them.
Structure Is the Foundation of Every Strategy
No matter your style:
- Smart Money Concepts
- Price action
- Indicator-based systems
- Algorithmic systems
- Swing trading
- Scalping
- Trend following
Every strategy relies on:
- Trends
- Pullbacks
- Breaks
- Retests
- Reversals
All rooted in structure.
Everything is built on trends, pullbacks, reversals, and breaks in structure. That is why understanding structure pairs naturally with building your own edge, as later explored in Trading Edge: Definition, Misconceptions and Casino Analogy.
Without structure, you’re guessing.
With structure, you’re reading.
Real-Life Analogy: Reading Body Language
Market structure is like reading someone’s body language.
You don’t need them to say a word - their posture, tone, and behavior reveal everything.
The market is the same:
- Strong pushes = confidence
- Weak bounces = hesitation
- Sharp reversals = rejection
- Consolidation = thinking
- Breakouts = commitment
If you pay attention, the market is constantly communicating.
The more time you spend observing, the more obvious it becomes when the market is confident, tired, undecided, or preparing for a move. As your awareness sharpens, you start to trade in a more focused and detached way, similar to the mindset in
The Zen of Trading: Becoming the Observer, Not the Reactor.
Final Thoughts

Understanding market structure is the first moment trading stops feeling like gambling and starts feeling like skill. You’re no longer reacting to random candles - you’re reading behavior, intention, and rhythm.
You stop asking, “Where do I buy or sell?”
You start asking, “What is the market trying to do?”
That shift alone is what transforms uncertainty into clarity.
It builds confidence.
It reduces hesitation.
It makes your trading decisions intentional rather than emotional.
Market structure doesn’t promise perfection - it promises understanding.
And understanding is the foundation of every consistent trader.
If you master this, everything coming next-entries, confirmation models, risk execution, trend shifts-will feel simpler, cleaner, and more intuitive.
Start Trading Live!
- Trade forex, indices, gold, and more
- Access ACY, MT4, MT5, & Copy Trading Platforms
It’s time to go from theory to execution!
Create an Account. Start Your Live Trading Now!
Check Out My Contents:
Beginners Path
- Learn Trading From Scratch: Clean, Simple, Zero-Noise
- Introduction to Trading: What Beginners Must Understand
Strategies That You Can Use
Looking for step-by-step approaches you can plug straight into the charts? Start here:
- How To Trade & Scalp Indices at the Open Using Smart Money Concepts (SMC)
- How to Trade Breakouts Effectively in Day Trading with Smart Money Concepts
- Complete Step-by-Step Guide to Day Trading Gold (XAU/USD) with Smart Money Concepts (SMC)
- The Power of Multi-Timeframe Analysis in Smart Money Concepts (SMC)
- Forex Trading Strategy for Beginners
- Mastering Candlestick Pattern Analysis with the SMC Strategy for Day Trading
- How to Use Fibonacci to Set Targets & Stops (Complete Guide)
- RSI Divergence Trading Strategy for Gold: How to Identify and Trade Trend Reversals
- Stochastics Trading Secrets: How to Time Entries in Trending Markets using Stochastics
- Gold Trading Stochastics Strategy: How to Trade Gold with 2R - 3R Targets
- RSI Hidden Divergence Explained: How to Spot Trend Continuations Like a Pro
- Moving Averages Trading Strategy Playbook
- Mastering Fibonacci Trading Psychology - Trusting the Levels, Managing the Mind
- Mastering Price Action at Key Levels - How to Spot, Trade, and Win at the Most Crucial Zones
- Mastering Retests: How to Enter with Confirmation After a Breakout
Indicators / Tools for Trading
Sharpen your edge with proven tools and frameworks:
- The Ultimate Guide to Risk Management in Trading - A Complete Compilation for 2026
- Moving Averages Trading Strategy Playbook
- How to Think Like a Price Action Trader
- Mastering Fibonacci Trading Psychology - Trusting the Levels, Managing the Mind
How To Trade News
News moves markets fast. Learn how to keep pace with SMC-based playbooks:
- Why Smart Money Concepts Work in News-Driven Markets - CPI, NFP, and More
- How to Trade NFP Using Smart Money Concepts (SMC) - A Proven Strategy for Forex Traders
- How to Trade CPI Like Smart Money - A Step-by-Step Guide Using SMC
- Learn to Trade News by Backtesting it with Forex Tester
Learn How to Trade US Indices
From NASDAQ opens to DAX trends, here’s how to approach indices like a pro:
- How to Start Trading Indices and Get into the Stock Market with Low Capital (2026 Guide)
- Best Indices to Trade for Day Traders | NASDAQ, S&P 500, DAX + Best Times to Trade Them
- How To Trade & Scalp Indices at the Open Using Smart Money Concepts (SMC)
- NAS100 - How to Trade the Nasdaq Like a Pro (Smart Money Edition)
How to Start Trading Gold
Gold remains one of the most traded assets - here’s how to approach it with confidence:
- How to Swing Trade Gold (XAU/USD) Using Smart Money Concepts: A Simple Guide for Traders
- Complete Step-by-Step Guide to Day Trading Gold (XAU/USD) with Smart Money Concepts (SMC)
- The Ultimate Guide to Backtesting and Trading Gold (XAU/USD) Using Smart Money Concepts (SMC)
- Why Gold Remains the Ultimate Security in a Shifting World
- How to Exit & Take Profits in Trading Gold Like a Pro: Using RSI, Range Breakdowns, and MAs as Your Confluence
- Backtest Gold using Forex Tester Online
How to Trade Japanese Candlesticks
Candlesticks are the building blocks of price action. Master the most powerful ones:
- Mastering the Top Japanese Candlesticks: The Top 5 Candlesticks To Trade + Top SMC Candlestick Pattern
- How to Trade Candlestick Patterns with High Probability: A Complete Guide for Beginners
- The Top Japanese Candlestick Guide: What is an Engulfing Pattern and How to Trade It?
- Piercing Pattern Candlestick Explained: How to Trade It - Step-By-Step Guide
- Morning & Evening Star Candlestick Patterns - How to Trade Market Reversals with Confidence
How to Start Day Trading
Ready to go intraday? Here’s how to build consistency step by step:
- 5 Steps to Start Day Trading: A Strategic Guide for Beginners
- 8 Steps How to Start Forex Day Trading in 2026: A Beginner’s Step-by-Step Guide
- 3 Steps to Build a Trading Routine for Consistency and Discipline - Day Trading Edition
- The Ultimate Guide to Understanding Market Trends and Price Action
- Trading with Momentum: The Best Trading Session to Trade Forex, Gold and Indices
Swing Trading 101
- Introduction to Swing Trading
- The Market Basics for Swing Trading
- Core Principles of Swing Trading
- The Technical Foundations Every Swing Trader Must Master
- Swing Trader’s Toolkit: Multi-Timeframe & Institutional Confluence
- The Psychology of Risk Management in Swing Trading
- Swing Trading Concepts To Know In Trading with Smart Money Concepts
- Becoming a Consistent Swing Trader: Trading Structure & Scaling Strategy
Learn how to navigate yourself in times of turmoil
Markets swing between calm and chaos. Learn to read risk-on vs risk-off like a pro:
- How to Identify Risk-On and Risk-Off Market Sentiment: A Complete Trader’s Guide
- How to Trade Risk-On and Risk-Off Sentiment - With Technical Confirmation
- The Ultimate Guide to Understanding Market Trends and Price Action
- Metals in Risk-On and Risk-Off Environments: How Sentiment Moves Gold and Commodities
Want to learn how to trade like the Smart Money?
Step inside the playbook of institutional traders with SMC concepts explained:
- Why Smart Money Concepts Work: The Truth Behind Liquidity and Price Action
- Mastering the Market with Smart Money Concepts: 5 Strategic Approaches
- Understanding Liquidity Sweep: How Smart Money Trades Liquidity Zones in Forex, Gold, US Indices
- The SMC Playbook Series Part 1: What Moves the Markets? Key Drivers Behind Forex, Gold & Stock Indices
- The SMC Playbook Series Part 2: How to Spot Liquidity Pools in Trading - Internal vs External Liquidity Explained
- Fair Value Gaps Explained: How Smart Money Leaves Footprints in the Market
- Accumulation, Manipulation, Distribution: The Hidden Cycle That Runs Every Market
- Institutional Order Flow - Reading the Market Through the Eyes of the Big Players
- London Session Trading Secrets: How Smart Money Sets the High & Low of the Day
- Mastering the New York Session - Smart Money Concepts Guide
- Anatomy of a Perfect Execution: How SMC Traders Trade with Precision
- Step-by-Step Trading Confirmation Guide for Precise Execution
- Execution Psychology: Turning Hesitation into Confidence
- What Is an Order Block? The Institutional Footprint Explained
- Anatomy of a Valid Order Block in Smart Money Concepts
- How to Draw Order Blocks Accurately - Day Trading Style
- Order Blocks and AMD Market Structure (Smart Money Concepts)
- The Confirmation Model: OB + FVG + Liquidity Sweep (Smart Money Concepts)
Master the World’s Most Popular Forex Pairs
Forex pairs aren’t created equal - some are stable, some are volatile, others tied to commodities or sessions.
- The Top 5 All-Time Best Forex Pairs to Trade
- Top Forex Pairs Beyond the Big Five
- EUR/USD: The King of Forex
- USD/JPY: The Fast Mover
- GBP/USD: The Volatile Cable
- AUD/USD: The Commodity Currency
- USD/CAD: The Oil-Backed Pair
- GBP/JPY: How to Trade The Beast
- Asian & London Session Secrets
- Mastering the New York Session
Metals Trading
- Metals Trading: Why Gold and Metals Are Rising Again
- Silver Trading: The Underdog with Dual Identity
- Gold vs Silver: Institutional Demand Breakdown Explained
- How to Day Trade Silver Like a Pro: Smart Money Tactics for XAG/USD
- Platinum & Palladium: The Quiet Power Duo of Industrial Metals
- How to Trade Metals with SMC and Fundamentals - Gold Trading Strategy
- Metals in Risk-On and Risk-Off Environments: How Sentiment Moves Gold and Commodities
- Future of Metals Market: Gold Forecast 2026 & Long-Term Commodities Outlook
Stop Hunting 101
If you’ve ever been stopped out right before the market reverses - this is why:
- Stop Hunting 101: How Swing Highs and Lows Become Liquidity Traps
- Outsmarting Stop Hunts: The Psychology Behind the Trap
- How to Lessen Risk From Stop Hunts in Trading
- How Stop Hunts Trigger Revenge Trading - Breaking the Pain Cycle
- How to Accept Stop Hunts Without Losing Discipline - Shifting From Frustration to Focus
Trading Psychology
Mindset is the deciding factor between growth and blowups. Explore these essentials:
- The Mental Game of Execution - Debunking the Common Trading Psychology
- Managing Trading Losses: Why You Can Be Wrong and Still Win Big in Trading
- The Hidden Threat in Trading: How Performance Anxiety Sabotages Your Edge
- Why 90% of Retail Traders Fail Even with Profitable Trading Strategies
- Top 10 Habits Profitable Traders Follow Daily to Stay Consistent
- Top 10 Trading Rules of the Most Successful Traders
- Top 10 Ways to Prevent Emotional Trading and Stay Disciplined in the Markets
- Why Most Traders Fail - Trading Psychology & The Hidden Mental Game
- Emotional Awareness in Trading - Naming Your Triggers
- Discipline vs. Impulse in Trading - Step-by Step Guide How to Build Control
- Trading Journal & Reflection - The Trader’s Mirror
- Overcoming FOMO & Revenge Trading in Forex - Why Patience Pays
- Risk of Ruin in Trading - Respect the Math of Survival
- Identity-Based Trading: Become Your Trading System for Consistency
- Trading Psychology: Aligning Emotions with Your System
- Mastering Fear in Trading: Turn Doubt into a Protective Signal
- Mastering Greed in Trading: Turn Ambition into Controlled Growth
- Mastering Boredom in Trading: From Restless Clicking to Patient Precision
- Mastering Doubt in Trading: Building Confidence Through Backtesting and Pattern Recognition
- Mastering Impatience in Trading: Turn Patience Into Profit
- Mastering Frustration in Trading: Turning Losses Into Lessons
- Mastering Hope in Trading: Replacing Denial With Discipline
- When to Quit on Trading - Read This!
- The Math of Compounding in Trading
- Why Daily Wins Matter More Than Big Wins
- Scaling in Trading: When & How to Increase Lot Sizes
- Why Patience in Trading Fuels the Compounding Growth
- Step-by-Step Guide on How to Manage Losses for Compounding Growth
- The Daily Habits of Profitable Traders: Building Your Compounding Routine
- Trading Edge: Definition, Misconceptions & Casino Analogy
- Finding Your Edge: From Chaos to Clarity
- Proving Your Edge: Backtesting Without Bias
- Forward Testing in Trading: How to Prove Your Edge Live
- Measuring Your Edge: Metrics That Matter
- Refining Your Edge: Iteration Without Overfitting
- The EDGE Framework: Knowing When and How to Evolve as a Trader
- Scaling Your Edge: From Small Account to Consistency
- Trading in the Zone: Execution Through Habit and Structure
- Trading in the Zone: Thinking in Probabilities
- The Inner War: Fear, Greed, and the Illusion of Control
- Detachment Discipline in Trading: How to Let Go of the Need to Be Right
- Trading Hack: Why You Keep Breaking Your Own Rules (And How to Stop)
- Trading Mindset Mastery: Building Confidence Through Data
- Flow State Trading: Entering the Zone Through Structure
- Cognitive Traps in Trading: Overconfidence, Recency Bias & Revenge Trades
- The Psychology of Risk in Trading: Fear of Loss vs Fear of Missing Out
- Self-Trust in Trading – Building Confidence from Repetition, Not Just Results
- The Zen of Trading: Becoming the Observer, Not the Reactor
- The Market Is Always Right: Why You Must Adapt, Not Demand
- The Three Stages to Becoming a Consistent Trader
- The Enemy Within: Limiting Beliefs and Emotional Conflict in Trading
- Self-Discipline in Trading: A Skill, Not a Personality Trait
- Mental Energy Management in Trading: Controlling Impulse, Stress, and Overwhelm
- Creating the Disciplined Trader Identity
- The Disciplined Trader: The Complete Blueprint for Consistency
Market Drivers
- Central Banks and Interest Rates: How They Move Your Trades
- Inflation & Economic Data: CPI Trading Strategy and PPI Indicator Guide
- Geopolitical Risks & Safe Havens in Trading (Gold, USD, JPY, CHF)
- Jobs, Growth & Recession Fears: NFP, GDP & Unemployment in Trading
- Commodities & Global Trade: Oil, Gold, and Forex Explained
- Market Correlations & Intermarket Analysis for Traders
Risk Management
The real edge in trading isn’t strategy - it’s how you protect your capital:
- Mastering Risk Management: Stop Loss, Take Profit, and Position Sizing
- Why Risk Management Is the Only Edge That Lasts
- How Much Should You Risk per Trade? (1%, 2%, or Less?)
- The Ultimate Risk Management Plan for Prop Firm Traders - Updated 2026
- Mastering Position Sizing: Automate or Calculate Your Risk Like a Pro
- Martingale Strategy in Trading: Compounding Power or Double-Edged Sword?
- How to Add to Winners Using Cost Averaging and Martingale Principle with Price Confirmation
- Managing Imperfect Entries in Trading - How Professionals Stay Composed
Suggested Learning Path
If you’re not sure where to start, follow this roadmap:
- Start with Trading Psychology → Build the mindset first.
- Move into Risk Management → Learn how to protect capital.
- Explore Strategies & Tools → Candlesticks, Fibonacci, MAs, Indicators.
- Apply to Assets → Gold, Indices, Forex sessions.
- Advance to Smart Money Concepts (SMC) → Learn how institutions trade.
- Specialize → Stop Hunts, News Trading, Turmoil Navigation.
This way, you’ll grow from foundation → application → mastery, instead of jumping around randomly.
Follow me for more daily market insights!
Jasper Osita - LinkedIn - FXStreet - YouTube
This content may have been written by a third party. ACY makes no representation or warranty and assumes no liability as to the accuracy or completeness of the information provided, nor any loss arising from any investment based on a recommendation, forecast or other information supplies by any third-party. This content is information only, and does not constitute financial, investment or other advice on which you can rely.
Try These Next

