Step-by-Step Trading Confirmation Guide for Precise Execution
2025-10-27 12:03:09


Every trader has a “spot” on the chart they like - that fair value gap, previous day high, or clean range low that screams this is where price will turn.
But here’s the truth: an area of interest is only that - an interest.
It’s not a signal. It’s not a setup.
It’s a location that deserves your attention, not yet your capital.

The moment you mistake interest for confirmation, emotion takes the wheel. The moment you wait for confirmation, logic returns to the driver’s seat.
That’s what the Confirmation Matrix is for - a mechanical process that transforms curiosity into conviction.
Think of it as your trading dashboard. When the right lights turn green - structure shift, displacement, volume alignment, liquidity sweep, and return to value - you know it’s time to move. For a bigger picture of precision execution, you can also study the companion piece, Anatomy of a Perfect Execution.
Let’s break down how to build trust in your setup, one confirmation at a time.
Step 1 - The Point of Interest: Curiosity, Not Commitment
You’ve marked your chart - an imbalance, an order block, or a previous session high/low. It looks perfect.
But before you rush in, pause. This is your Point of Interest (POI) - a potential battleground, not a confirmed opportunity.
At this stage, your only job is to observe how price reacts.
- Does it sweep liquidity?
- Does it stall?
- Does structure shift after hitting this level?
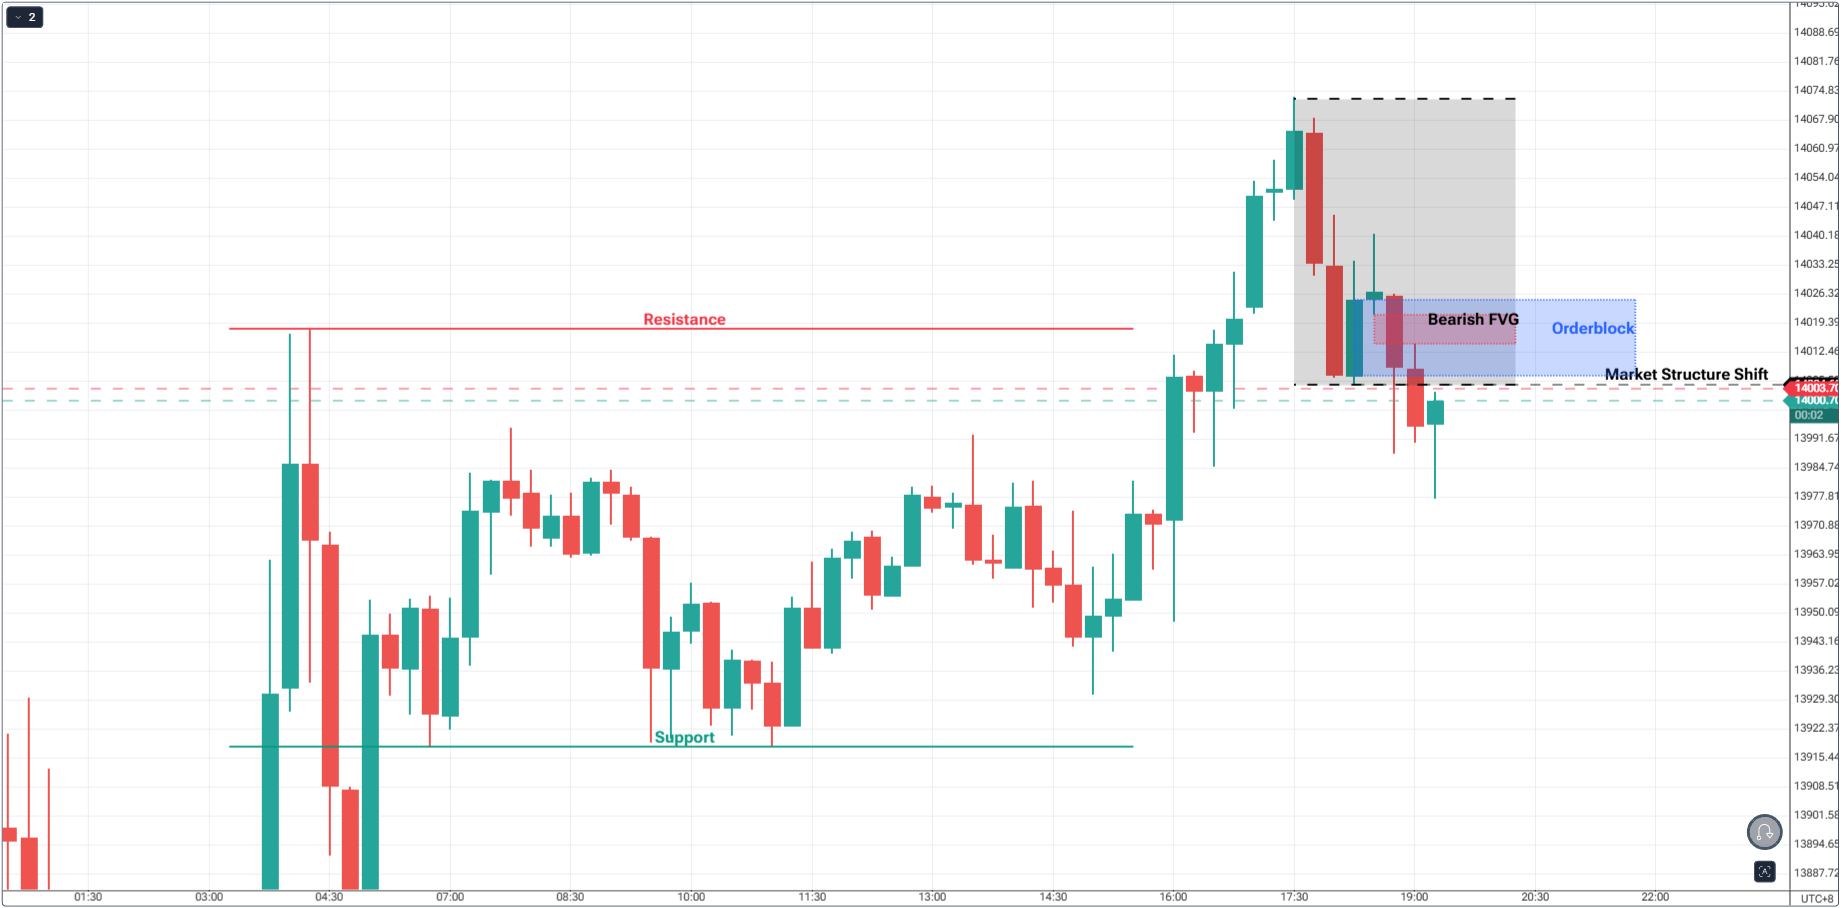
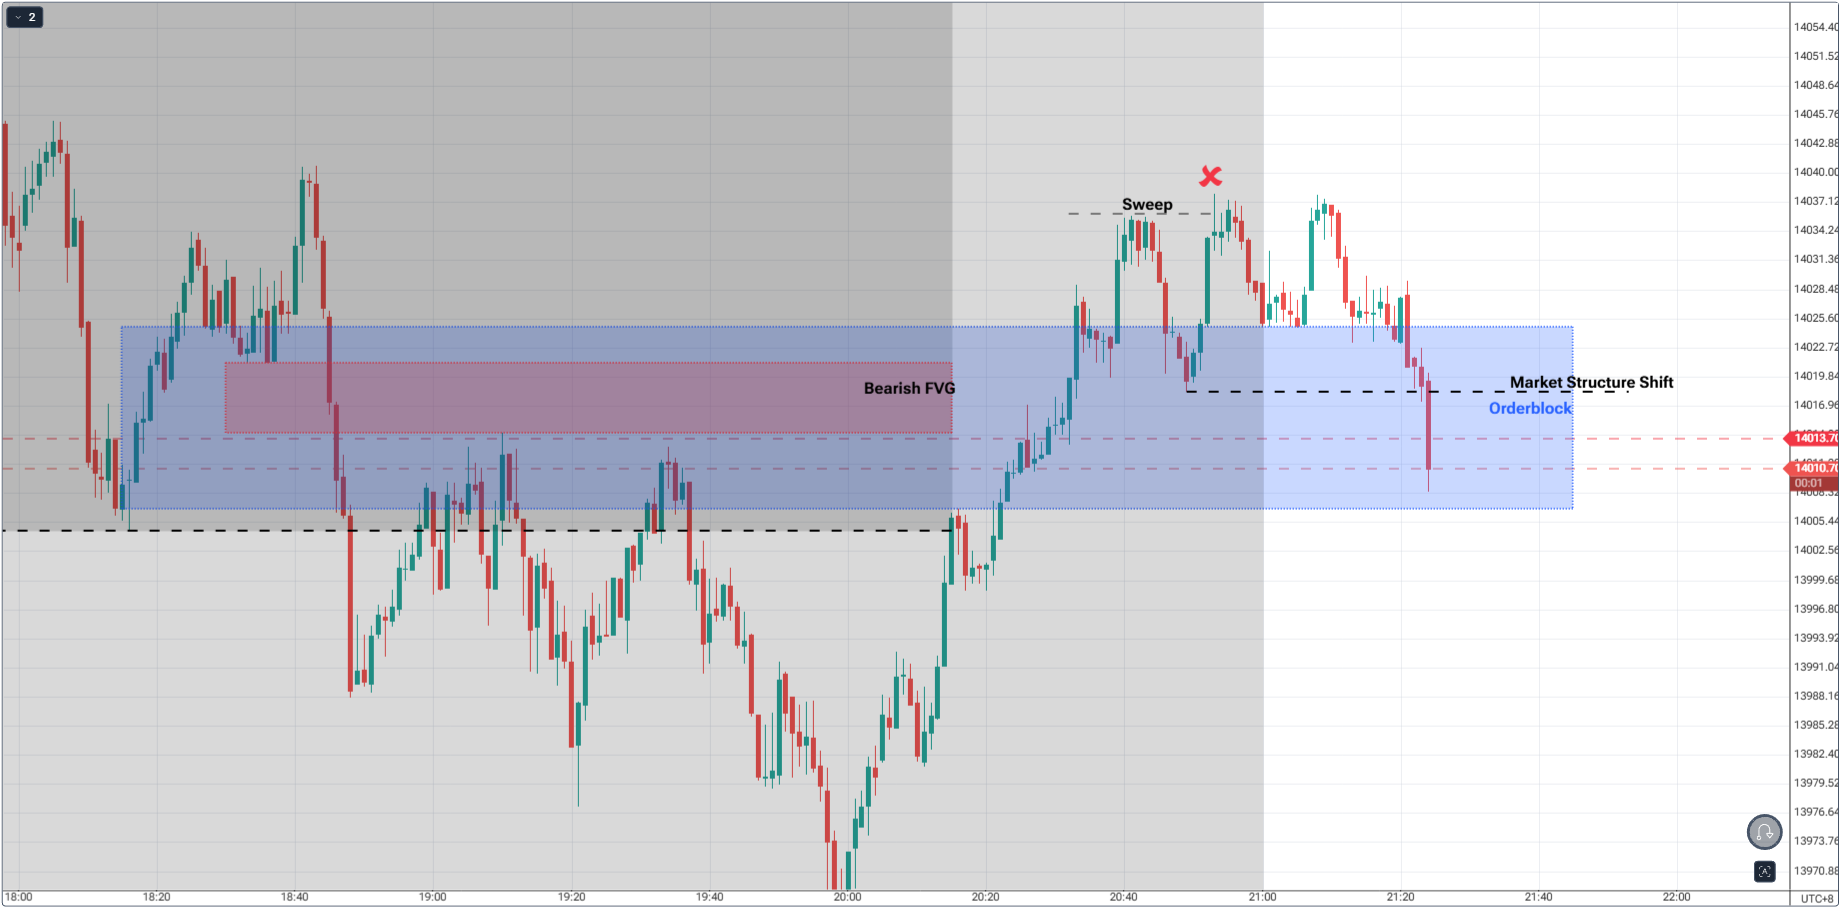
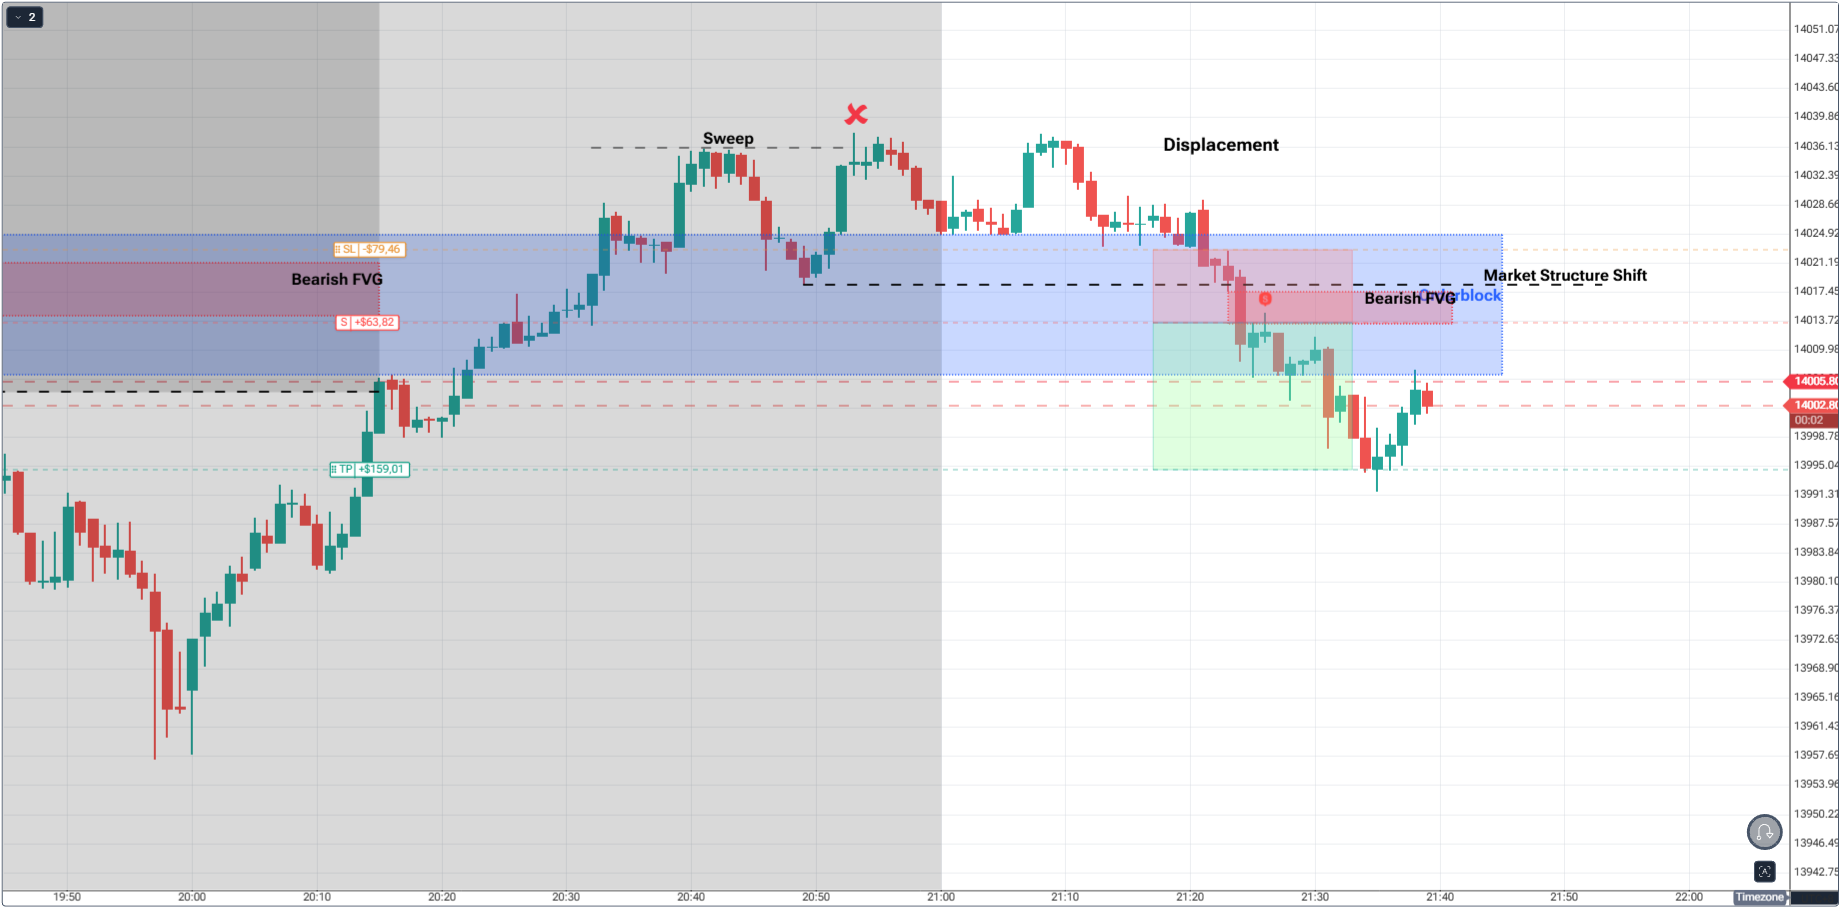
In the case above, we already have a point-of-interest with confluences of:
- Previous Resistance Level
- Market Structure Shift Confirmed
- Fair Value Gap
- Order Block
The POI sets the stage, but confirmation reveals whether the actors - liquidity, displacement, and order flow - actually showed up. If your POI is an FVG, here’s a deeper primer on Fair Value Gaps and how they form.
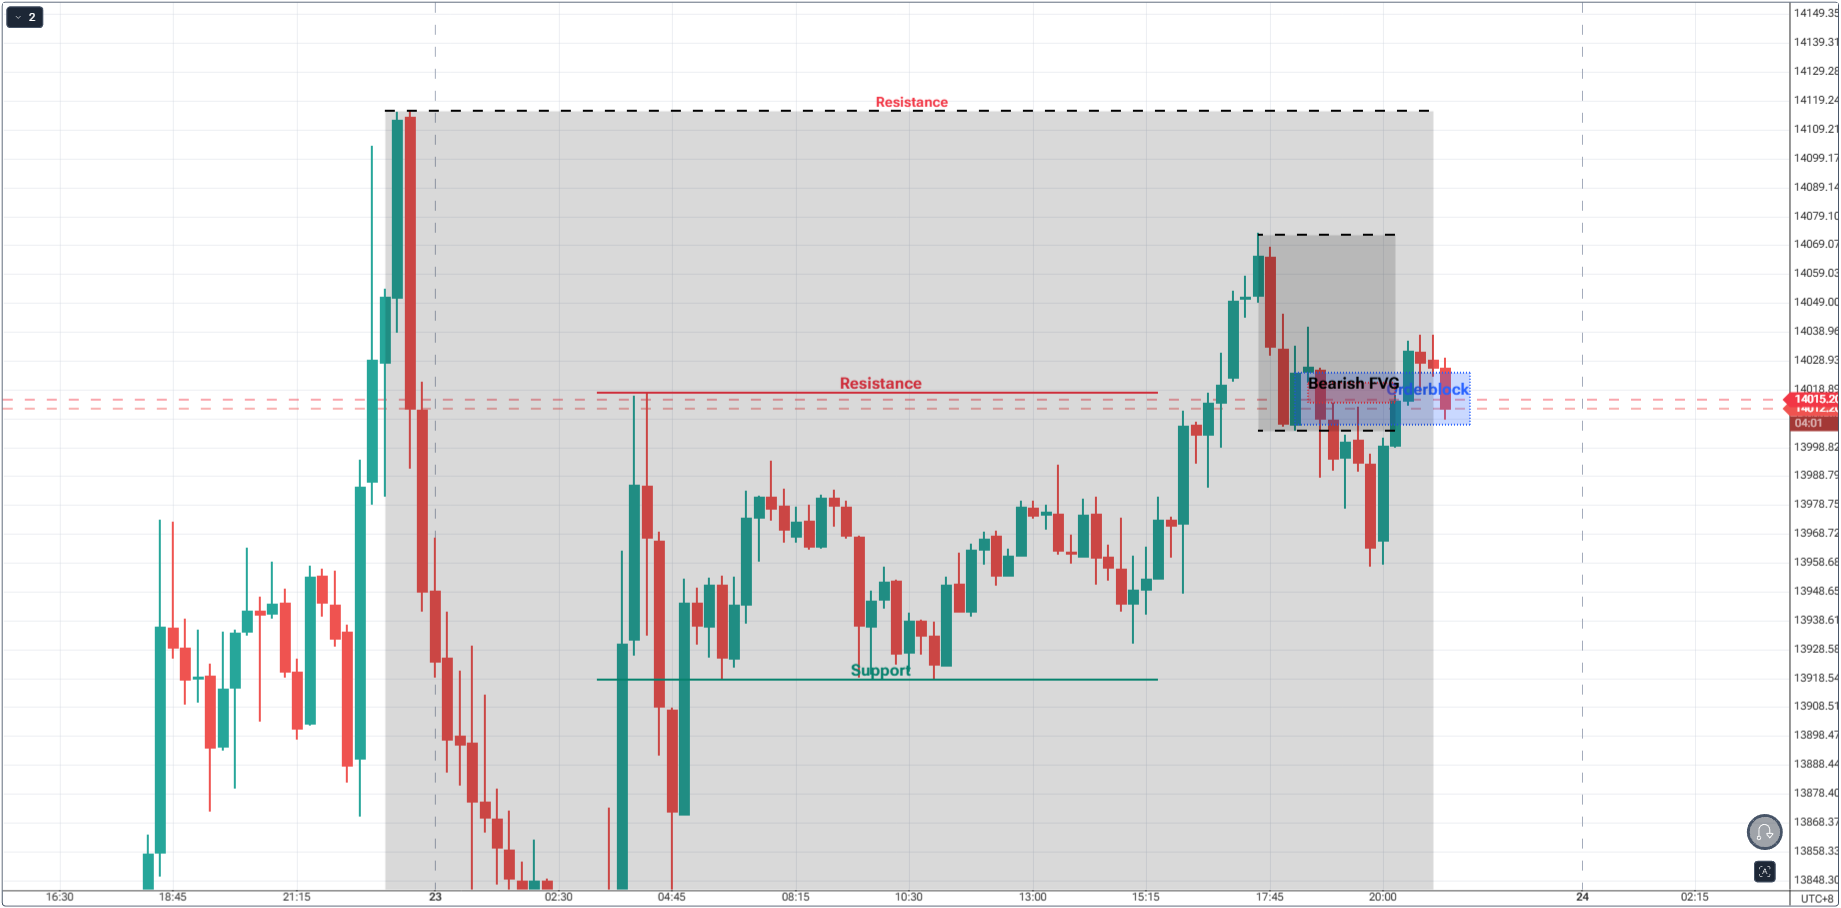
Step 2 - Multi-Timeframe Context: The Tide Behind the Wave
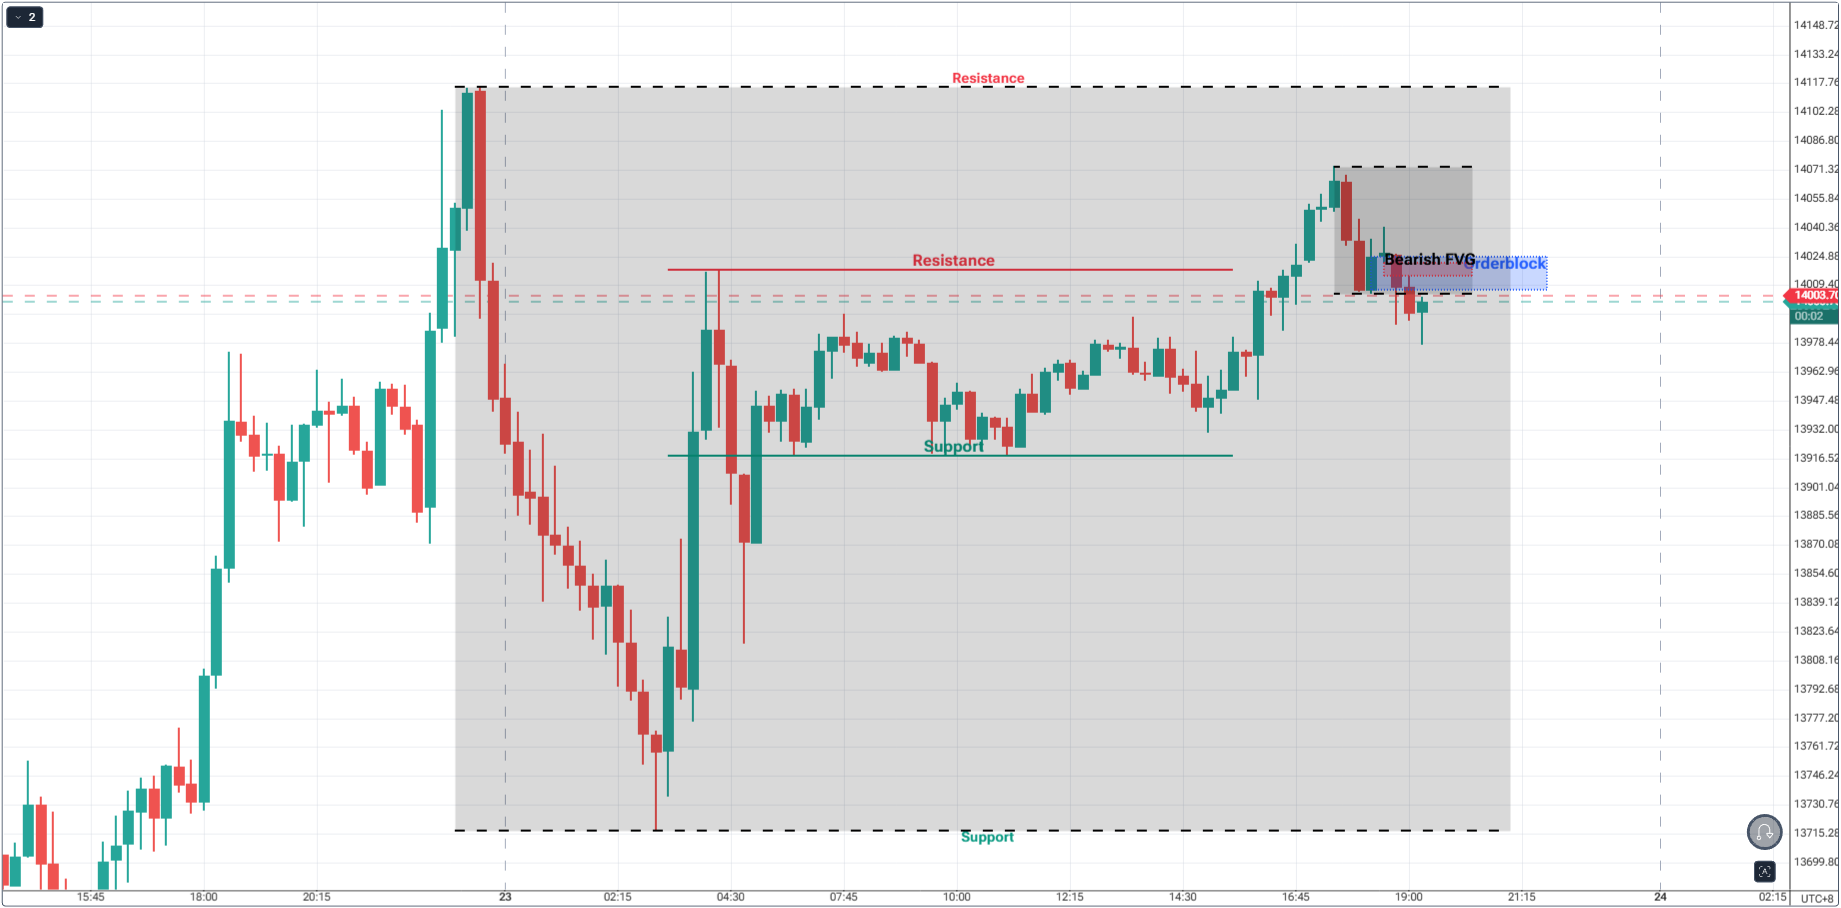
A common trap for traders is mistaking a lower timeframe pullback for a full reversal.
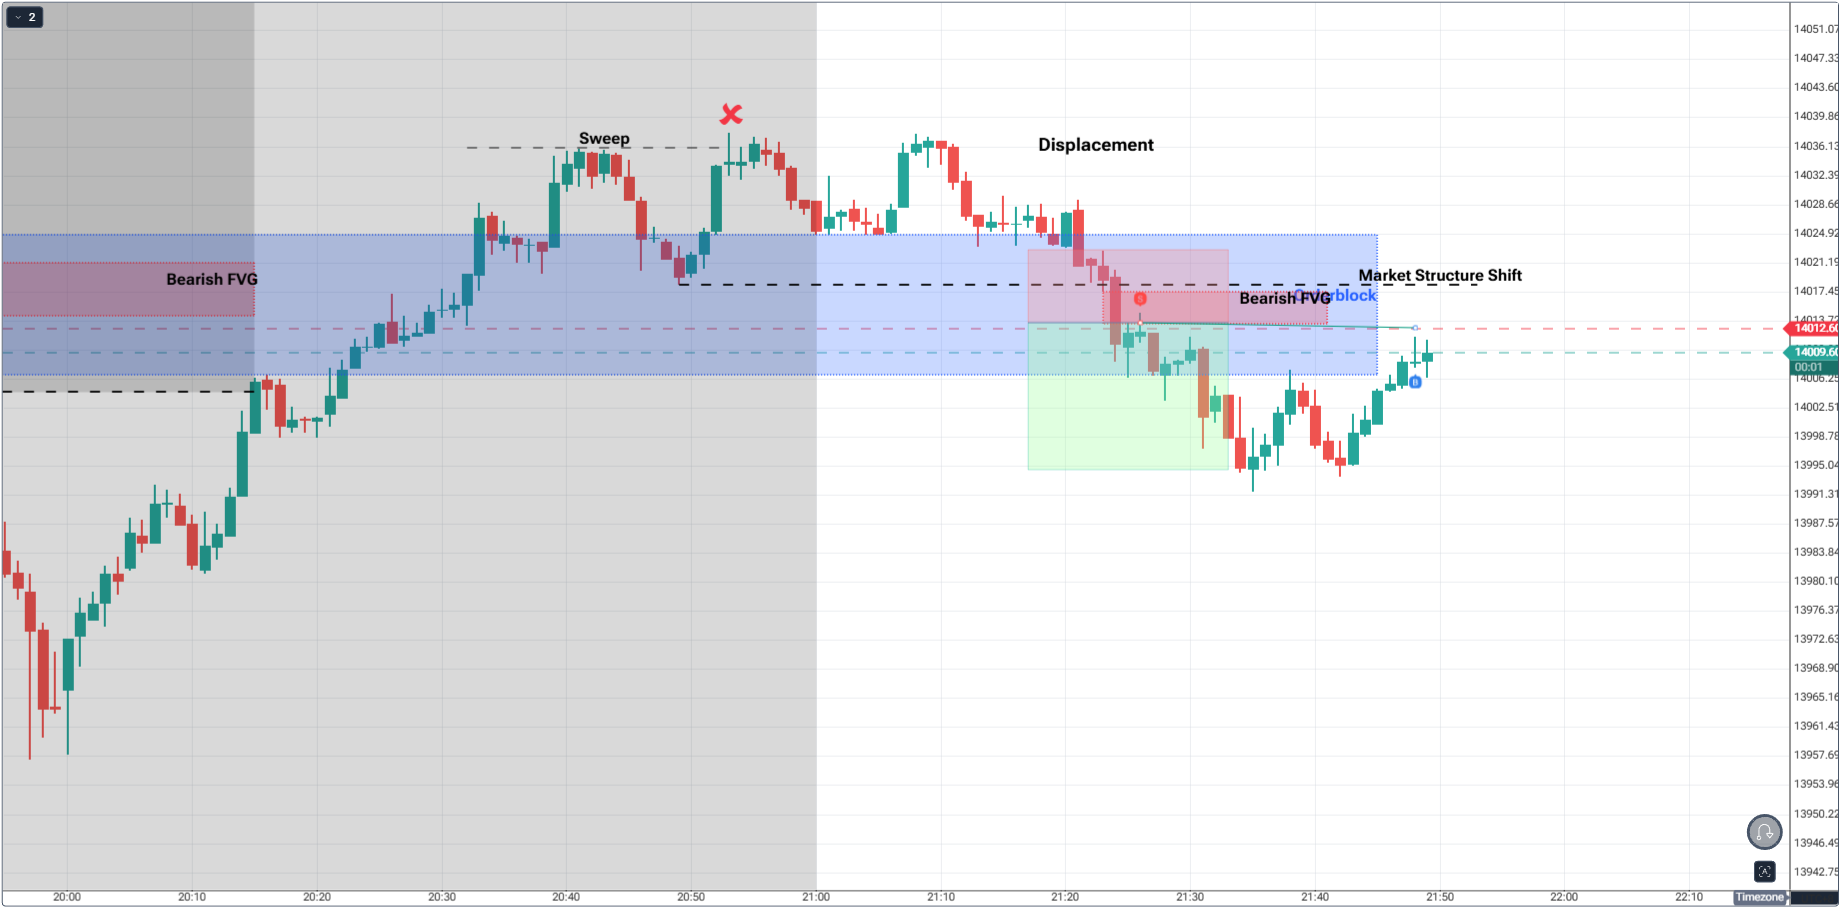
Looking at the chart above, price has broken out of the micro-box(range inside the bigger range), but despite breaking out, there’s no strong follow-through to the upside.
This is why it’s essential that price must have a follow-through before executing.
When your H1 or Daily trend points up, but your M5 shows a sharp drop, that move could be nothing more than a fakeout - liquidity being cleared before continuation.
Your confirmation matrix starts with alignment.
The Market Never Lies - It Just Waits to Tell the Truth
Markets are like interviews. They don’t answer your first question. They test if you’ll ask the right next one.
Your Point of Interest is the first question - “Is this where price might turn?”
The confirmation process is the follow-up - “Can you prove it?”
And price always answers... with structure.
Step 3 - Structure Shift: The Market’s First Honest Answer
This is where logic starts to take shape.
A structure shift is your first sign that the market is responding, not reacting.
If you’re looking for a buy, wait for price to break a short-term high.
If you’re looking for a sell, wait for it to break a short-term low.
The key is intent.
A wick through the level isn’t intent - it’s noise.
A full-bodied close beyond it, especially after a liquidity sweep, is your first tick on the confirmation checklist.
Structure defines the skeleton of your trade. Without it, every other signal collapses. If you like using candlestick evidence for this step, this guide on Candlestick Pattern Analysis with SMC shows what “intent” looks like in the candles themselves.
Step 4 - Return to POI: The Next Key
The best entries aren’t at the impulse - they’re at the retracement into the fair value gap or order block that formed during displacement.
This is where imbalance gets rebalanced, and risk gets minimized.
You’re not chasing confirmation here - you’re validating it.
When price returns to the gap or the order block, your point-of-interest, that’s your low-risk, high-probability entry zone - where logic meets timing. If you prefer a rules-based retest approach, study Retests with Confirmation After Breakouts.
Step 5 - Liquidity Sweep: The Setup’s Catalyst
Before every strong move, there’s usually pain - someone else’s.
Liquidity sweeps are that pain made visible.
Watch for price to take out previous highs or lows, stop-hunt round numbers, or trigger obvious retail zones - then shift structure.
This is how institutional traders collect liquidity before moving the market in the real direction. For a deep dive into this footprint, see Understanding Liquidity Sweeps.
A setup without a sweep is like a storm without pressure - it might not have enough force to last.
Step 6 - Displacement: The Pulse of Power
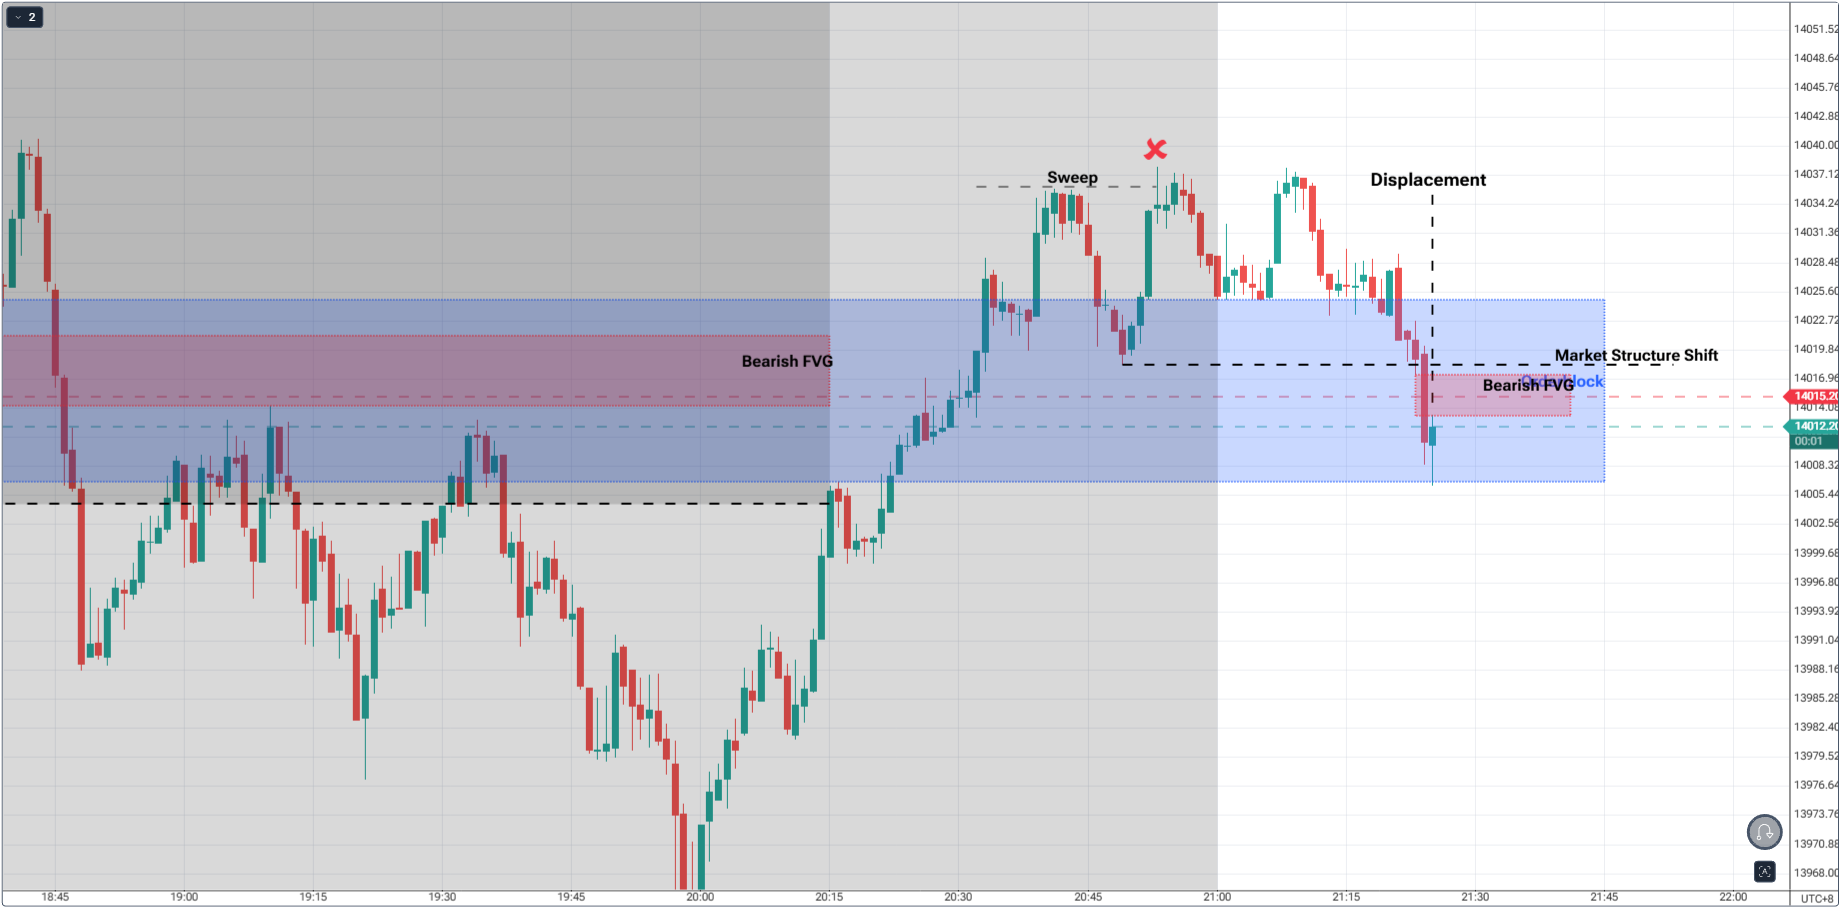
After the sweep and structure shifts on the execution timeframe, look for displacement - that clean, impulsive move that shows institutional participation.
Displacements normally have FVGs in their pattern.
You’ll recognize it instantly: wide-bodied candles, small wicks, and sudden acceleration with fair value gaps.
Displacement is the heartbeat of confirmation.
It tells you whether the shift in structure has muscle behind it.
But be careful.
If displacement forms against the higher timeframe trend, it could be a trap - a fake pulse meant to lure impatient traders.
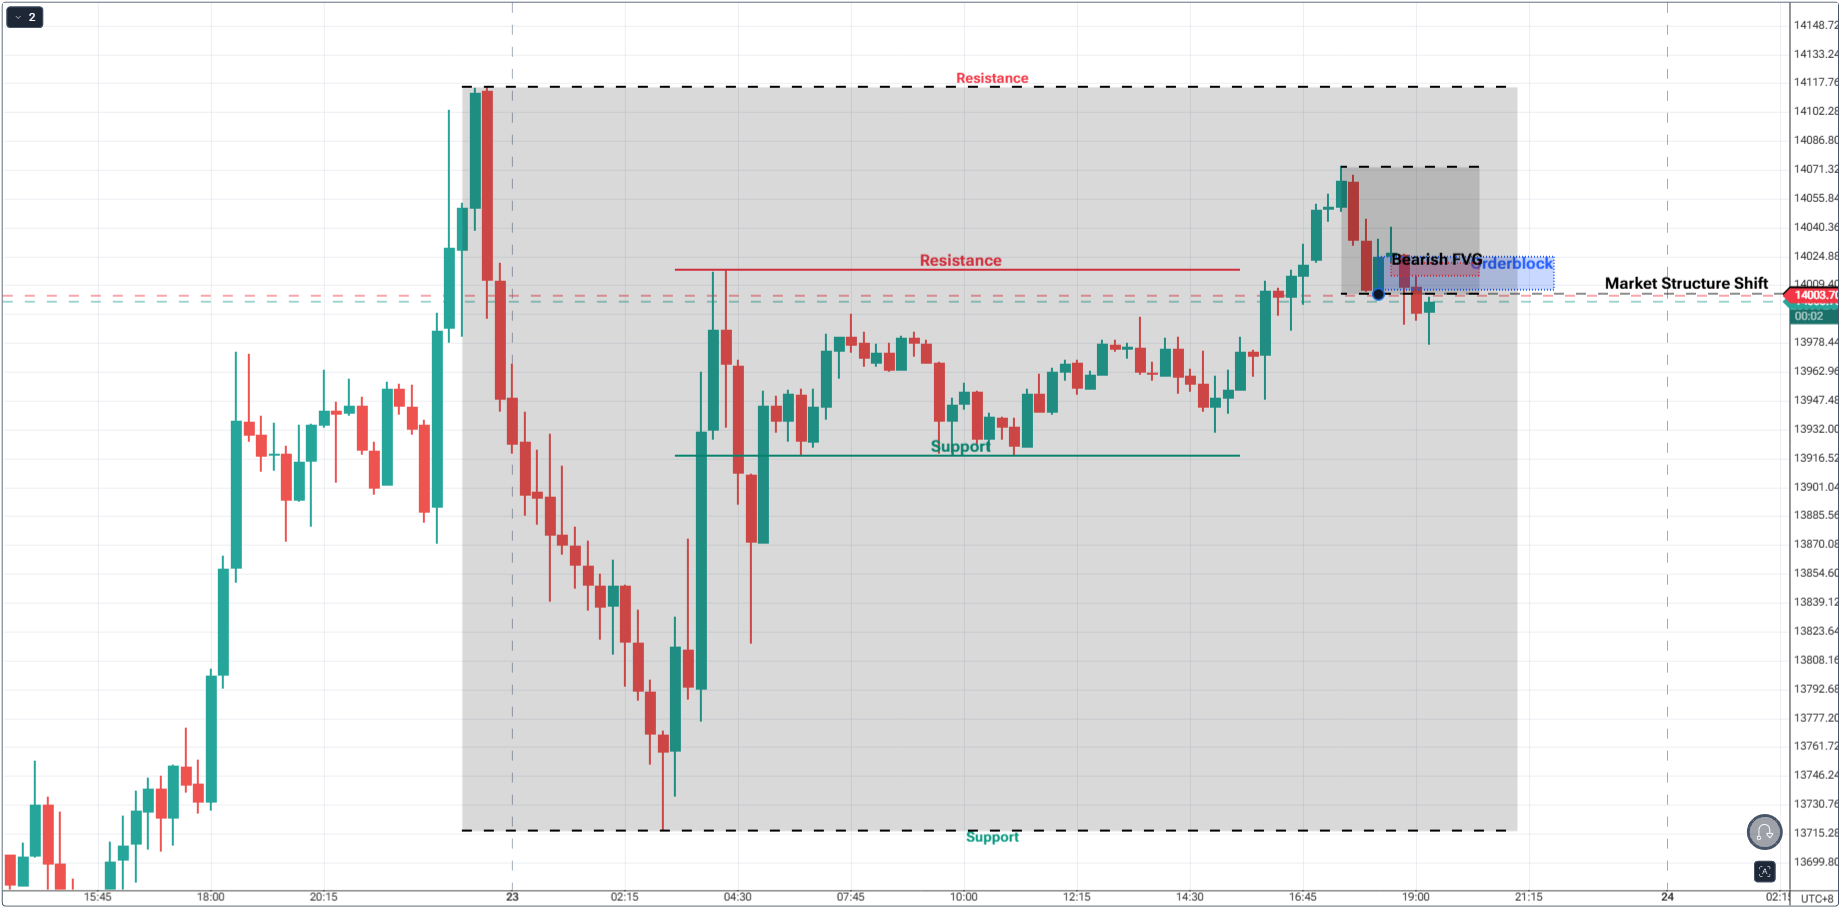
In this case, lower timeframe is still in-synced with the higher timeframe as candles does not confirm a bullish follow-through at the premium level.
The real displacement always flows with narrative context, not against it. When this occurs around session opens, use the timing playbooks in Mastering the New York Session.
Step 7 - Volume Alignment: Participation or Pretense
Volume doesn’t lie. It tells you who’s actually moving the market.
When price moves sharply but volume stays flat, it’s a hint that only retail is participating.
However, when you see a burst in volume during displacement, followed by a calm retracement, that’s your confirmation rhythm.
It’s effort meeting result.
High volume confirms that smart money is active.
Low volume on the pullback confirms that smart money is waiting to re-enter.
But here’s the nuance most traders miss: volume is relative.
The data you see depends on where you trade. CFD brokers aggregate prices from different liquidity providers, so each feed shows its own version of “volume” - not the entire market’s participation.
If you want a clearer picture, check the futures volume. Unlike CFD brokers, futures markets are centralized on exchanges like CME, so prints reflect consolidated participation. Use CFD volume for rhythm, but lean on futures volume when you need decisive confirmation of participation.
Always ask:
- What’s the higher timeframe narrative?
- Am I trading with or against it?
- If against, do I have enough confluence to justify it?
Displacement that moves against the higher timeframe is like swimming against the current - possible, but exhausting and often short-lived. If this part feels fuzzy, revisit Multi-Timeframe Analysis in SMC for a clear workflow.
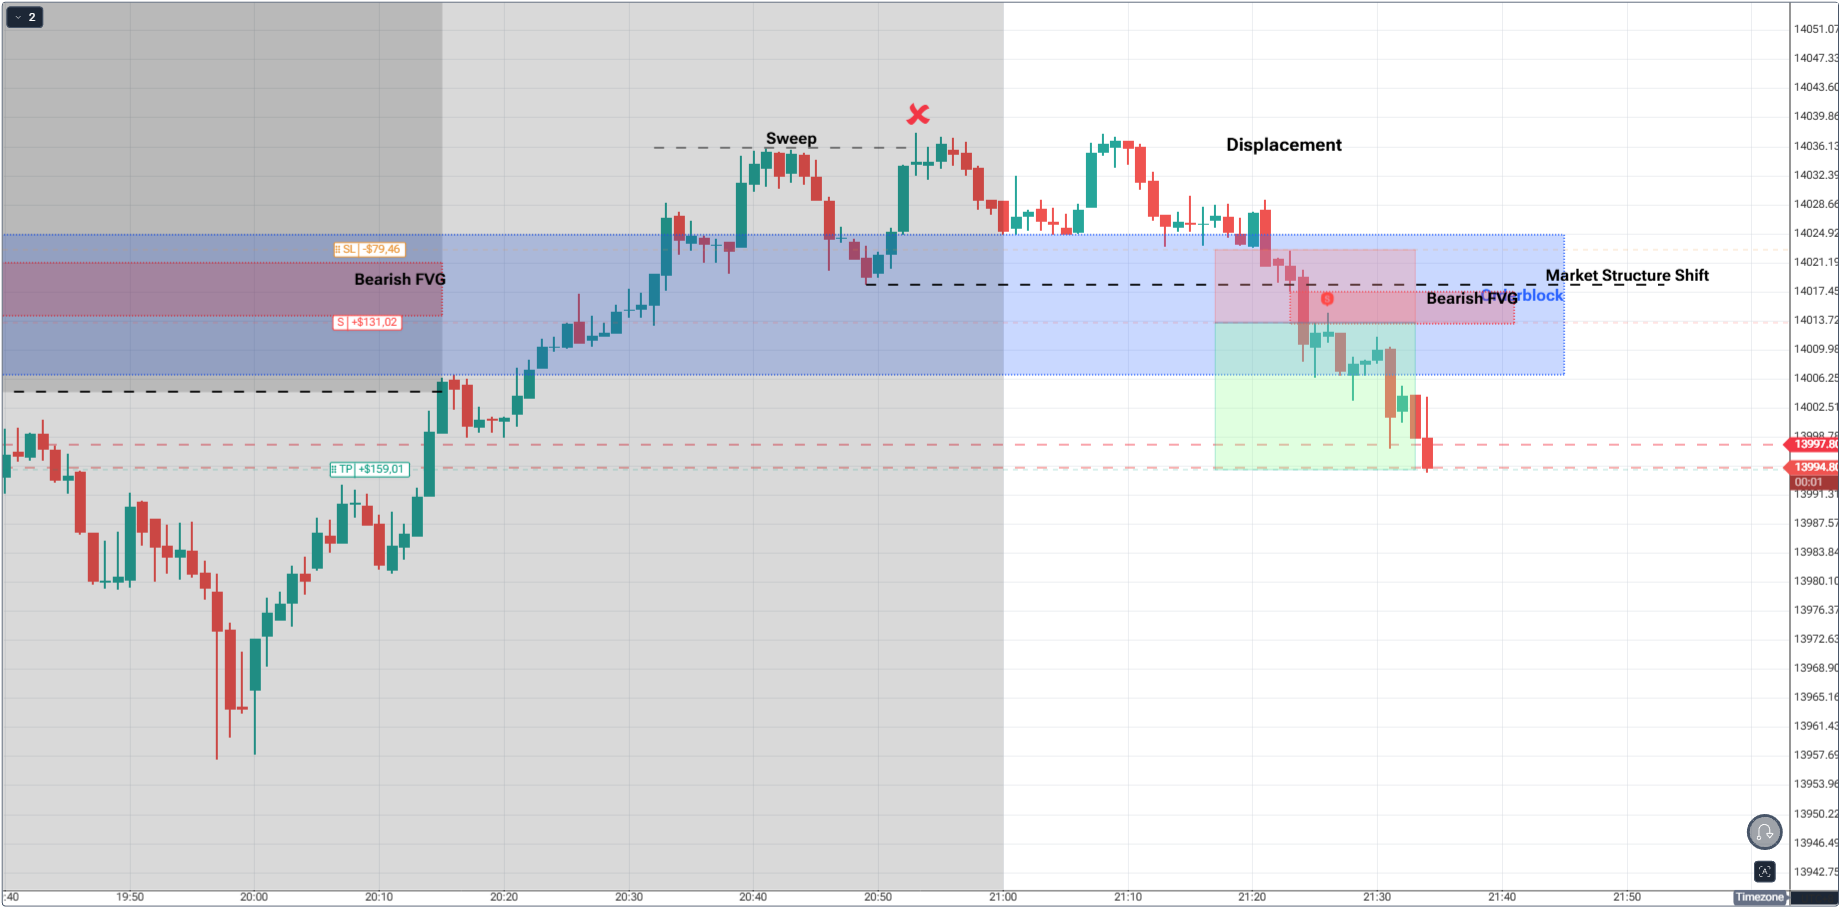
Step 8 - Session Timing: Trade When the Tape Has Teeth
For day traders, timing is a confirmation layer. Indices and many FX crosses reveal the day’s true intent when liquidity concentrates at key sessions.
If you trade indices, wait for the cash open. The first 15-30 minutes often deliver the displacement that validates your bias, or exposes your read as premature.
Use your POI, then marry it to session timing: London set the range, New York tests or breaks it.
If your matrix is at 3 of 6 before the open, let the bell be the fourth light. No session - no confirmation.
Build your playbook around this with How To Trade & Scalp Indices at the Open Using SMC and the broader session context from Mastering the New York Session.
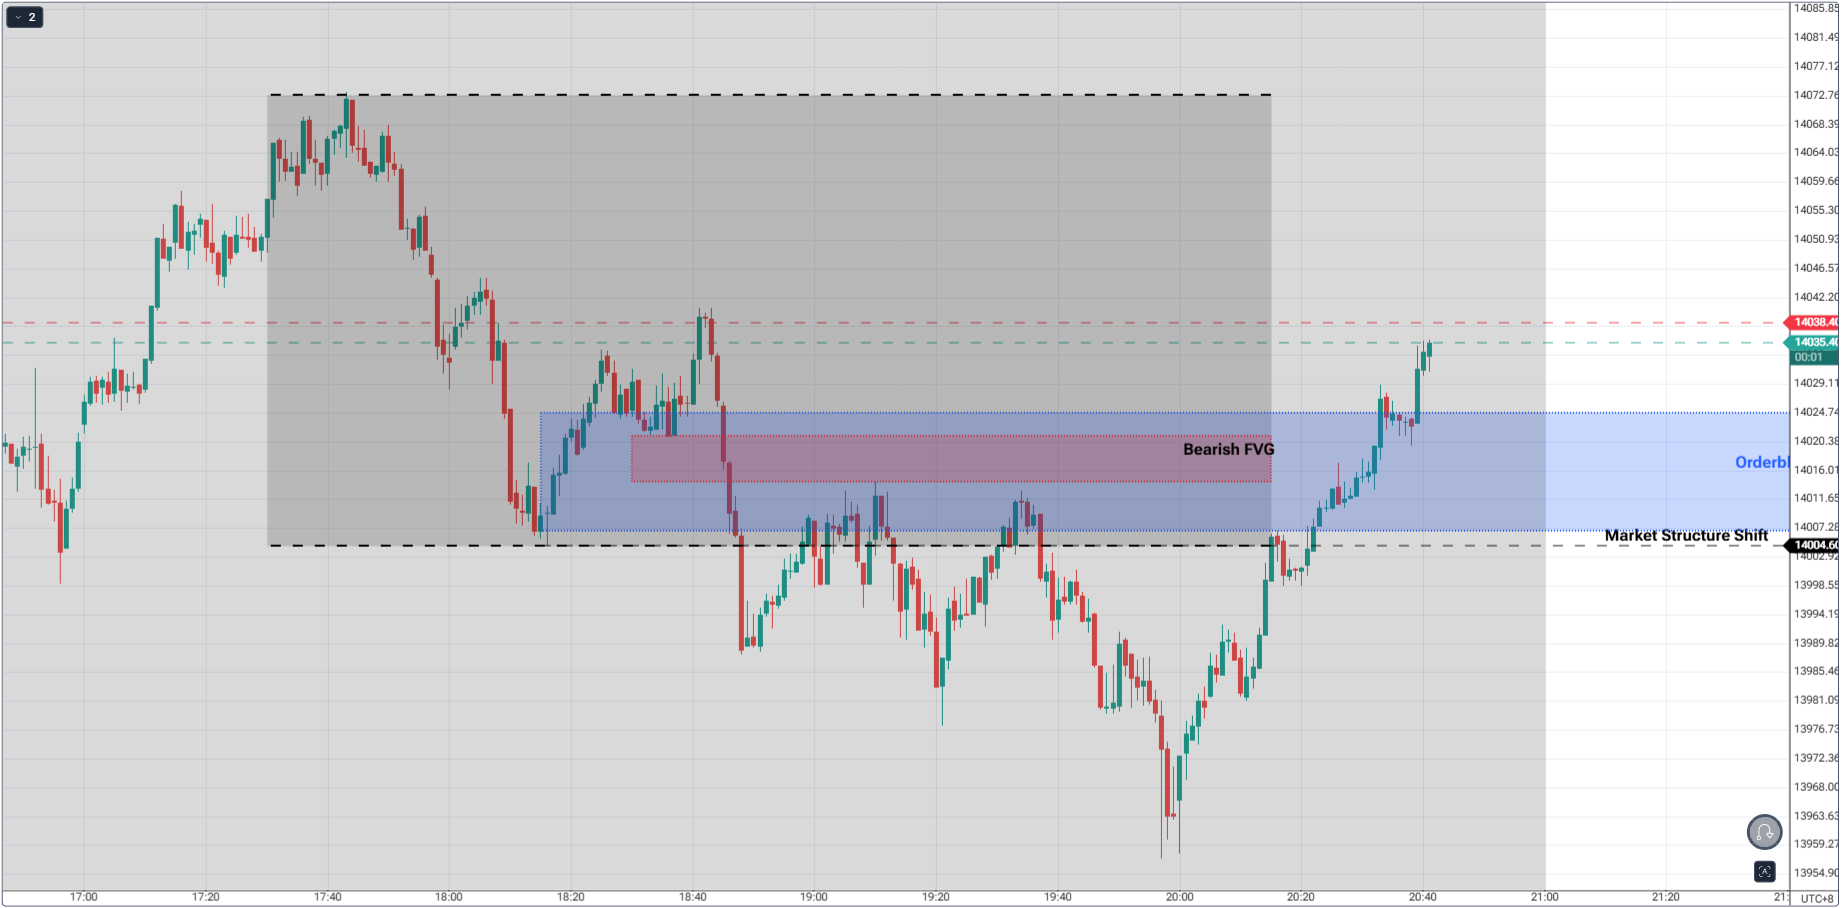
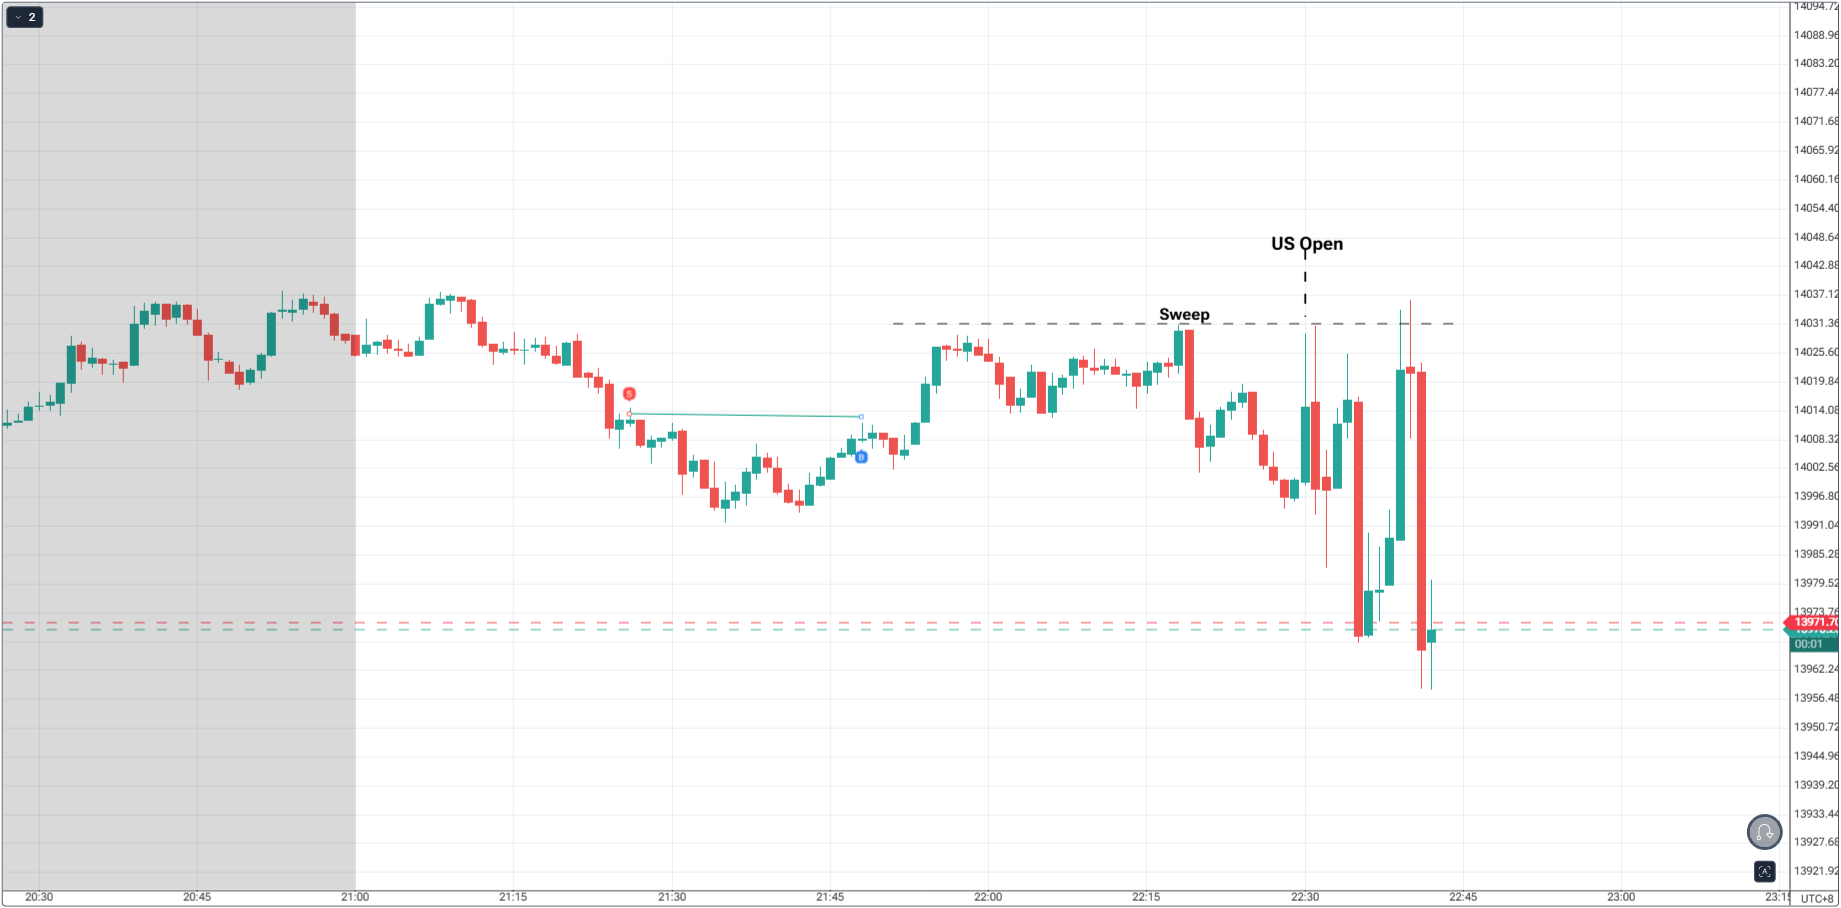
Above, we can see that despite having a good short on our point-of-interest, price wasn’t able to hit our target profit due to spread.
The reason: Nasdaq is yet to open. We entered the market pre-maturely. And spread is still too wide, meaning, liquidity is still thin.
Trade resulted to breakeven. The best approach to lessen risks like this: Wait for the Key Session. In this case, the US open.
Repeat the previous steps but this time, we anticipate the sweep, market structure shift, and displacement at the open with new levels to look for a sweep.
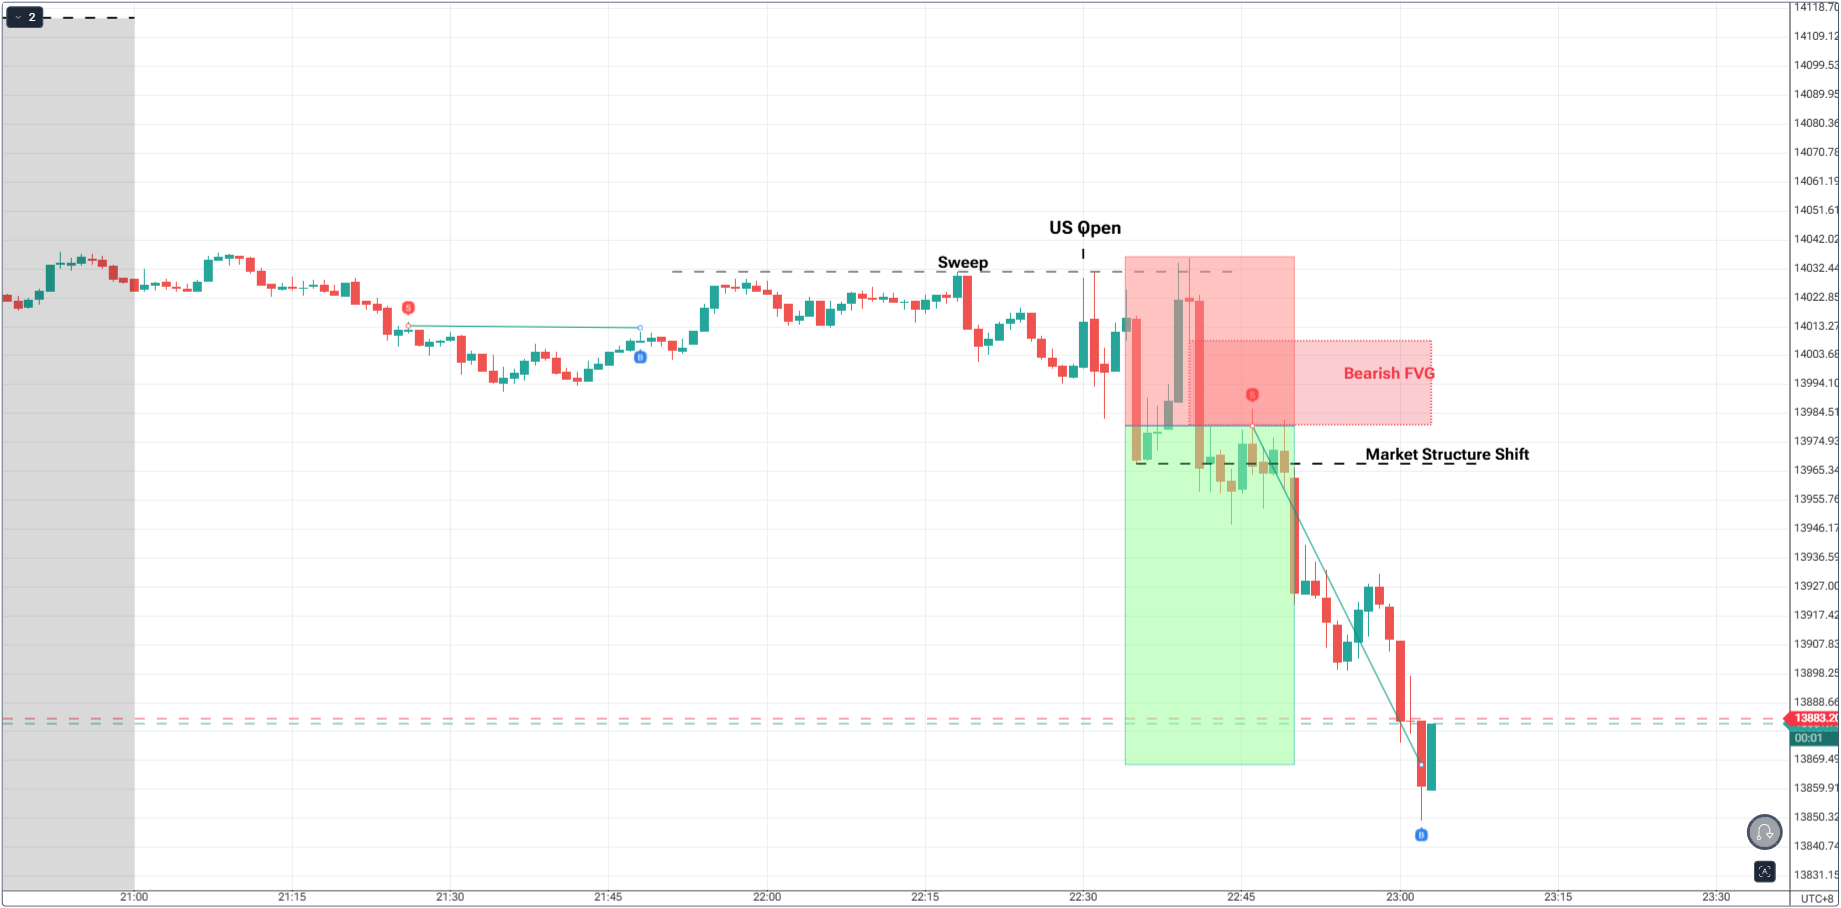
We had a better chance of trading here with liquidity as the spread here compared to our previous trade is thinner, which is a good market condition.
Your Confirmation Matrix Checklist

| Element | Question | Confirmation Signal |
|---|---|---|
| Higher TF | Is it aligned with the broader trend? | Directional confluence on H1 or Daily |
| Structure | Did the market shift intent? | Body-close break of key swing |
| Displacement | Was there power behind the move? | Impulsive candles, clean momentum |
| Volume | Did participation validate it? | Spike on impulse, lighter on pullback - cross-check futures |
| Liquidity | Was there a sweep before shift? | Obvious stops taken, then reversal intent |
| Return to Value | Did price retest the origin zone? | Entry from FVG or OB retrace |
| Session | Are you trading at a key session? | Cash open or session handoff provides confirmation |
Rule of thumb - 4 lights to act, 5 to size normally. If countertrend to Daily, demand an extra check.
Final Thoughts
Perfect setups aren’t hunted - they’re confirmed. An area of interest becomes a trade only when your matrix aligns - structure, power, participation, sweep, value, and the right session.
Let the session open be your truth serum. And when you do press the button, guard the idea with tight rules from Mastering Risk Management.
You’re not trading guesses anymore. You’re trading evidence, at the hour when the market is most honest.
Start Practicing with Confidence - Risk-Free!
- Trade forex, indices, gold, and more
- Access ACY, MT4, MT5, & Copy Trading Platforms
- Practice with zero risk
It’s time to go from theory to execution - risk-free.
Create an Account. Start Your Free Demo!
Check Out My Contents:
Strategies That You Can Use
Looking for step-by-step approaches you can plug straight into the charts? Start here:
- How To Trade & Scalp Indices at the Open Using Smart Money Concepts (SMC)
- How to Trade Breakouts Effectively in Day Trading with Smart Money Concepts
- Complete Step-by-Step Guide to Day Trading Gold (XAU/USD) with Smart Money Concepts (SMC)
- The Power of Multi-Timeframe Analysis in Smart Money Concepts (SMC)
- Forex Trading Strategy for Beginners
- Mastering Candlestick Pattern Analysis with the SMC Strategy for Day Trading
- How to Use Fibonacci to Set Targets & Stops (Complete Guide)
- RSI Divergence Trading Strategy for Gold: How to Identify and Trade Trend Reversals
- Stochastics Trading Secrets: How to Time Entries in Trending Markets using Stochastics
- Gold Trading Stochastics Strategy: How to Trade Gold with 2R - 3R Targets
- RSI Hidden Divergence Explained: How to Spot Trend Continuations Like a Pro
- Moving Averages Trading Strategy Playbook
- Mastering Fibonacci Trading Psychology - Trusting the Levels, Managing the Mind
- Mastering Price Action at Key Levels - How to Spot, Trade, and Win at the Most Crucial Zones
- Mastering Retests: How to Enter with Confirmation After a Breakout
Indicators / Tools for Trading
Sharpen your edge with proven tools and frameworks:
- The Ultimate Guide to Risk Management in Trading - A Complete Compilation for 2026
- Moving Averages Trading Strategy Playbook
- How to Think Like a Price Action Trader
- Mastering Fibonacci Trading Psychology - Trusting the Levels, Managing the Mind
How To Trade News
News moves markets fast. Learn how to keep pace with SMC-based playbooks:
- Why Smart Money Concepts Work in News-Driven Markets - CPI, NFP, and More
- How to Trade NFP Using Smart Money Concepts (SMC) - A Proven Strategy for Forex Traders
- How to Trade CPI Like Smart Money - A Step-by-Step Guide Using SMC
Learn How to Trade US Indices
From NASDAQ opens to DAX trends, here’s how to approach indices like a pro:
- How to Start Trading Indices and Get into the Stock Market with Low Capital (2026 Guide)
- Best Indices to Trade for Day Traders | NASDAQ, S&P 500, DAX + Best Times to Trade Them
- How To Trade & Scalp Indices at the Open Using Smart Money Concepts (SMC)
- NAS100 - How to Trade the Nasdaq Like a Pro (Smart Money Edition)
How to Start Trading Gold
Gold remains one of the most traded assets - here’s how to approach it with confidence:
- How to Swing Trade Gold (XAU/USD) Using Smart Money Concepts: A Simple Guide for Traders
- Complete Step-by-Step Guide to Day Trading Gold (XAU/USD) with Smart Money Concepts (SMC)
- The Ultimate Guide to Backtesting and Trading Gold (XAU/USD) Using Smart Money Concepts (SMC)
- Why Gold Remains the Ultimate Security in a Shifting World
- How to Exit & Take Profits in Trading Gold Like a Pro: Using RSI, Range Breakdowns, and MAs as Your Confluence
How to Trade Japanese Candlesticks
Candlesticks are the building blocks of price action. Master the most powerful ones:
- Mastering the Top Japanese Candlesticks: The Top 5 Candlesticks To Trade + Top SMC Candlestick Pattern
- How to Trade Candlestick Patterns with High Probability: A Complete Guide for Beginners
- The Top Japanese Candlestick Guide: What is an Engulfing Pattern and How to Trade It?
- Piercing Pattern Candlestick Explained: How to Trade It - Step-By-Step Guide
- Morning & Evening Star Candlestick Patterns - How to Trade Market Reversals with Confidence
How to Start Day Trading
Ready to go intraday? Here’s how to build consistency step by step:
- 5 Steps to Start Day Trading: A Strategic Guide for Beginners
- 8 Steps How to Start Forex Day Trading in 2026: A Beginner’s Step-by-Step Guide
- 3 Steps to Build a Trading Routine for Consistency and Discipline - Day Trading Edition
- The Ultimate Guide to Understanding Market Trends and Price Action
- Trading with Momentum: The Best Trading Session to Trade Forex, Gold and Indices
Swing Trading 101
- Introduction to Swing Trading
- The Market Basics for Swing Trading
- Core Principles of Swing Trading
- The Technical Foundations Every Swing Trader Must Master
- Swing Trader’s Toolkit: Multi-Timeframe & Institutional Confluence
- The Psychology of Risk Management in Swing Trading
- Swing Trading Concepts To Know In Trading with Smart Money Concepts
- Becoming a Consistent Swing Trader: Trading Structure & Scaling Strategy
Learn how to navigate yourself in times of turmoil
Markets swing between calm and chaos. Learn to read risk-on vs risk-off like a pro:
- How to Identify Risk-On and Risk-Off Market Sentiment: A Complete Trader’s Guide
- How to Trade Risk-On and Risk-Off Sentiment - With Technical Confirmation
- The Ultimate Guide to Understanding Market Trends and Price Action
- Metals in Risk-On and Risk-Off Environments: How Sentiment Moves Gold and Commodities
Want to learn how to trade like the Smart Money?
Step inside the playbook of institutional traders with SMC concepts explained:
- Why Smart Money Concepts Work: The Truth Behind Liquidity and Price Action
- Mastering the Market with Smart Money Concepts: 5 Strategic Approaches
- Understanding Liquidity Sweep: How Smart Money Trades Liquidity Zones in Forex, Gold, US Indices
- The SMC Playbook Series Part 1: What Moves the Markets? Key Drivers Behind Forex, Gold & Stock Indices
- The SMC Playbook Series Part 2: How to Spot Liquidity Pools in Trading - Internal vs External Liquidity Explained
- Fair Value Gaps Explained: How Smart Money Leaves Footprints in the Market
- Accumulation, Manipulation, Distribution: The Hidden Cycle That Runs Every Market
- Institutional Order Flow - Reading the Market Through the Eyes of the Big Players
- London Session Trading Secrets: How Smart Money Sets the High & Low of the Day
- Mastering the New York Session - Smart Money Concepts Guide
- Anatomy of a Perfect Execution: How SMC Traders Trade with Precision
Master the World’s Most Popular Forex Pairs
Forex pairs aren’t created equal - some are stable, some are volatile, others tied to commodities or sessions.
- The Top 5 All-Time Best Forex Pairs to Trade
- Top Forex Pairs Beyond the Big Five
- EUR/USD: The King of Forex
- USD/JPY: The Fast Mover
- GBP/USD: The Volatile Cable
- AUD/USD: The Commodity Currency
- USD/CAD: The Oil-Backed Pair
- GBP/JPY: How to Trade The Beast
- Asian & London Session Secrets
- Mastering the New York Session
Metals Trading
- Metals Trading: Why Gold and Metals Are Rising Again
- Silver Trading: The Underdog with Dual Identity
- Gold vs Silver: Institutional Demand Breakdown Explained
- Platinum & Palladium: The Quiet Power Duo of Industrial Metals
- How to Trade Metals with SMC and Fundamentals - Gold Trading Strategy
- Future of Metals Market: Gold Forecast 2026 & Long-Term Commodities Outlook
Stop Hunting 101
If you’ve ever been stopped out right before the market reverses - this is why:
- Stop Hunting 101: How Swing Highs and Lows Become Liquidity Traps
- Outsmarting Stop Hunts: The Psychology Behind the Trap
- How to Lessen Risk From Stop Hunts in Trading
- How Stop Hunts Trigger Revenge Trading - Breaking the Pain Cycle
- How to Accept Stop Hunts Without Losing Discipline - Shifting From Frustration to Focus
Trading Psychology
Mindset is the deciding factor between growth and blowups. Explore these essentials:
- The Mental Game of Execution - Debunking the Common Trading Psychology
- Managing Trading Losses: Why You Can Be Wrong and Still Win Big in Trading
- The Hidden Threat in Trading: How Performance Anxiety Sabotages Your Edge
- Why 90% of Retail Traders Fail Even with Profitable Trading Strategies
- Top 10 Habits Profitable Traders Follow Daily to Stay Consistent
- Top 10 Trading Rules of the Most Successful Traders
- Top 10 Ways to Prevent Emotional Trading and Stay Disciplined in the Markets
- Why Most Traders Fail - Trading Psychology & The Hidden Mental Game
- Emotional Awareness in Trading - Naming Your Triggers
- Discipline vs. Impulse in Trading - Step-by Step Guide How to Build Control
- Trading Journal & Reflection - The Trader’s Mirror
- Overcoming FOMO & Revenge Trading in Forex - Why Patience Pays
- Risk of Ruin in Trading - Respect the Math of Survival
- Identity-Based Trading: Become Your Trading System for Consistency
- Trading Psychology: Aligning Emotions with Your System
- Mastering Fear in Trading: Turn Doubt into a Protective Signal
- Mastering Greed in Trading: Turn Ambition into Controlled Growth
- Mastering Boredom in Trading: From Restless Clicking to Patient Precision
- Mastering Doubt in Trading: Building Confidence Through Backtesting and Pattern Recognition
- Mastering Impatience in Trading: Turn Patience Into Profit
- Mastering Frustration in Trading: Turning Losses Into Lessons
- Mastering Hope in Trading: Replacing Denial With Discipline
- When to Quit on Trading - Read This!
- The Math of Compounding in Trading
- Why Daily Wins Matter More Than Big Wins
- Scaling in Trading: When & How to Increase Lot Sizes
- Why Patience in Trading Fuels the Compounding Growth
- Step-by-Step Guide on How to Manage Losses for Compounding Growth
- The Daily Habits of Profitable Traders: Building Your Compounding Routine
- Trading Edge: Definition, Misconceptions & Casino Analogy
- Finding Your Edge: From Chaos to Clarity
- Proving Your Edge: Backtesting Without Bias
- Forward Testing in Trading: How to Prove Your Edge Live
- Measuring Your Edge: Metrics That Matter
- Refining Your Edge: Iteration Without Overfitting
- The EDGE Framework: Knowing When and How to Evolve as a Trader
- Scaling Your Edge: From Small Account to Consistency
Market Drivers
- Central Banks and Interest Rates: How They Move Your Trades
- Inflation & Economic Data: CPI Trading Strategy and PPI Indicator Guide
- Geopolitical Risks & Safe Havens in Trading (Gold, USD, JPY, CHF)
- Jobs, Growth & Recession Fears: NFP, GDP & Unemployment in Trading
- Commodities & Global Trade: Oil, Gold, and Forex Explained
- Market Correlations & Intermarket Analysis for Traders
Risk Management
The real edge in trading isn’t strategy - it’s how you protect your capital:
- Mastering Risk Management: Stop Loss, Take Profit, and Position Sizing
- Why Risk Management Is the Only Edge That Lasts
- How Much Should You Risk per Trade? (1%, 2%, or Less?)
- The Ultimate Risk Management Plan for Prop Firm Traders - Updated 2026
- Mastering Position Sizing: Automate or Calculate Your Risk Like a Pro
- Martingale Strategy in Trading: Compounding Power or Double-Edged Sword?
- How to Add to Winners Using Cost Averaging and Martingale Principle with Price Confirmation
Suggested Learning Path
If you’re not sure where to start, follow this roadmap:
- Start with Trading Psychology → Build the mindset first.
- Move into Risk Management → Learn how to protect capital.
- Explore Strategies & Tools → Candlesticks, Fibonacci, MAs, Indicators.
- Apply to Assets → Gold, Indices, Forex sessions.
- Advance to Smart Money Concepts (SMC) → Learn how institutions trade.
- Specialize → Stop Hunts, News Trading, Turmoil Navigation.
This way, you’ll grow from foundation → application → mastery, instead of jumping around randomly.
Follow me for more daily market insights!
Jasper Osita - LinkedIn - FXStreet - YouTube
This content may have been written by a third party. ACY makes no representation or warranty and assumes no liability as to the accuracy or completeness of the information provided, nor any loss arising from any investment based on a recommendation, forecast or other information supplies by any third-party. This content is information only, and does not constitute financial, investment or other advice on which you can rely.
Try These Next

