Swing Trader’s Toolkit: Multi-Timeframe & Institutional Confluence
2025-10-13 09:12:03


Every successful swing trader carries a toolkit—not one made of wrenches and screwdrivers, but of charts, timeframes, and concepts that decode how institutions move the market. Your goal isn’t to predict every tick; it’s to align yourself with the flow of smart money across multiple timeframes. If you’ve never structured your workflow this way, start by studying multi-timeframe analysis in SMC to see how the Daily, 4H, and 1H each carry a job in your plan.
In this part of the Swing Trading Series, we’ll sharpen your edge using multi-timeframe analysis, confluence zones, liquidity concepts, and Fair Value Gaps (FVGs) & Order Blocks (OBs) tailored for higher timeframe structures. Newer traders can pair this with a structured base like Forex Trading Strategy for Beginners so the ideas translate into step-by-step actions.
1. Multi-Timeframe Analysis: From Bird’s-Eye to Tactical View
Swing traders are navigators of time.
Your daily chart shows the terrain, your 4-hour chart reveals the path, and your 1-hour chart gives the entry point. The workflow is simple: define bias on the Daily, map the pullback or continuation structure on 4H, then refine triggers on 1H.

If you want a deeper walk-through of this exact flow, keep this MTF guide handy while you chart.
2. Finding Confluence Zones: Where Evidence Meets Opportunity
Confluence is where everything “clicks.” It’s when your higher timeframe structure, a prior order block, and a developing FVG sit in the same region—after a liquidity event. That’s stacked probability, not hope. If you prefer rules over vibes, ground your selection process in how Smart Money Concepts actually work so your confluence checklist reflects real institutional behavior rather than random overlaps.
Step-by-Step Breakdown
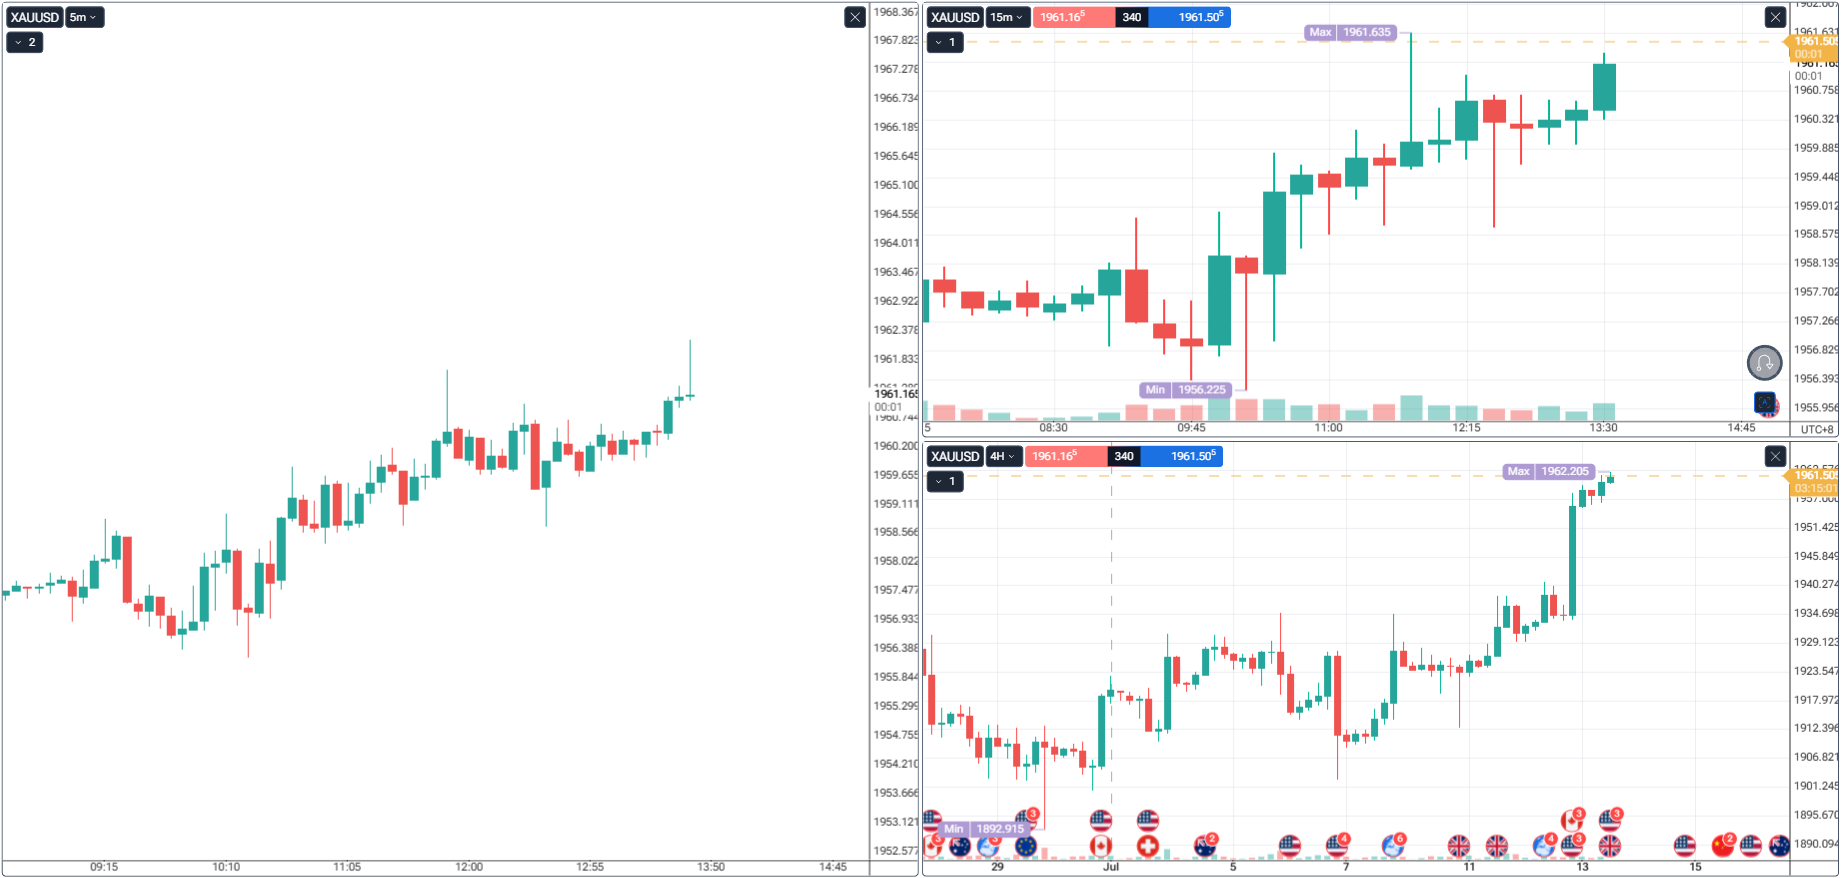
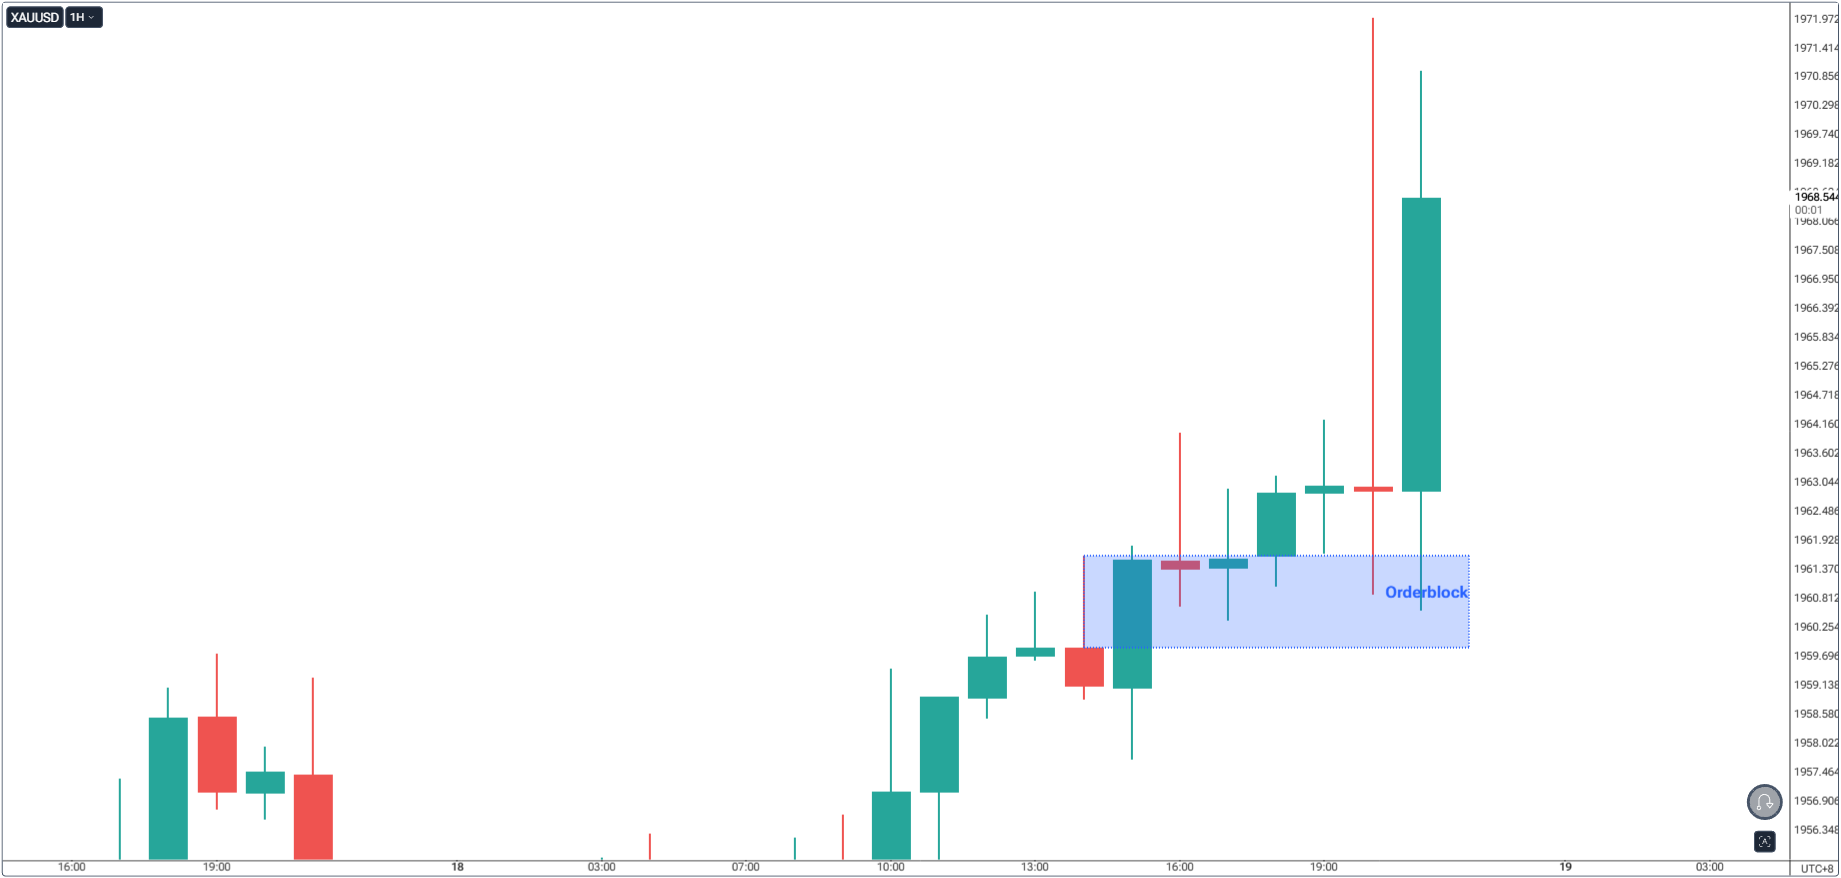
Higher Timeframe Context (4H)
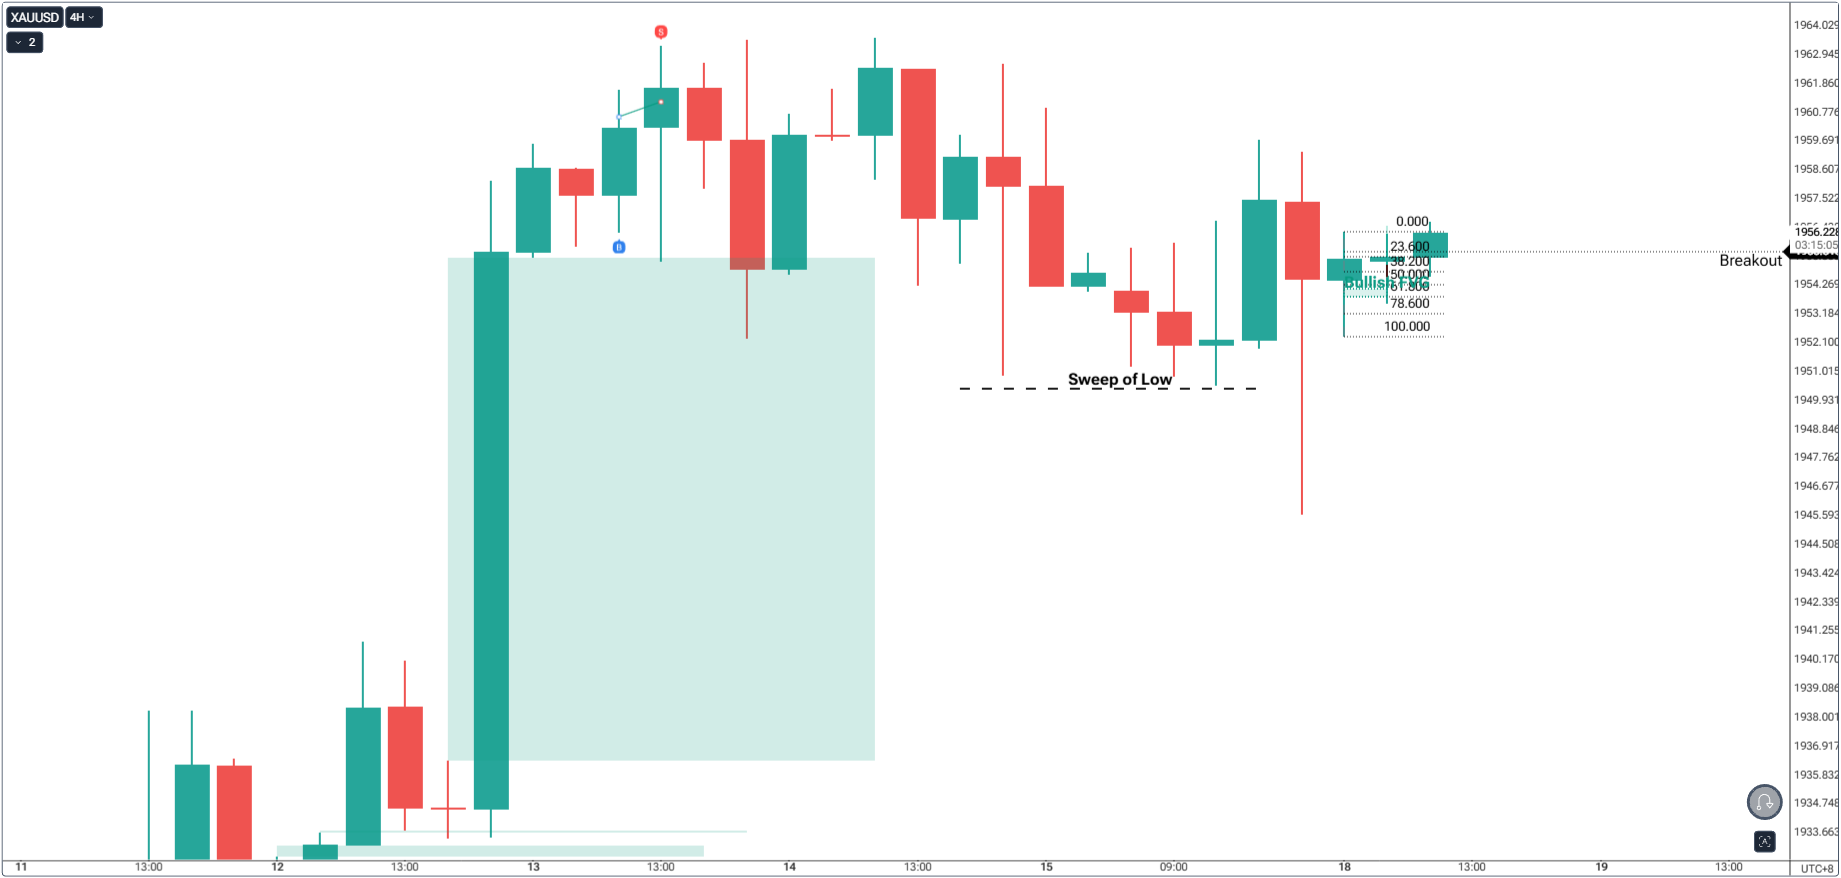
- On the 4H chart (bottom right), price recently rejected from a key zone near 1950. With this rejection, we are looking for strength to breakout since the rejection signaled a fakeout.
- This gives the bias: price is potentially bullish.
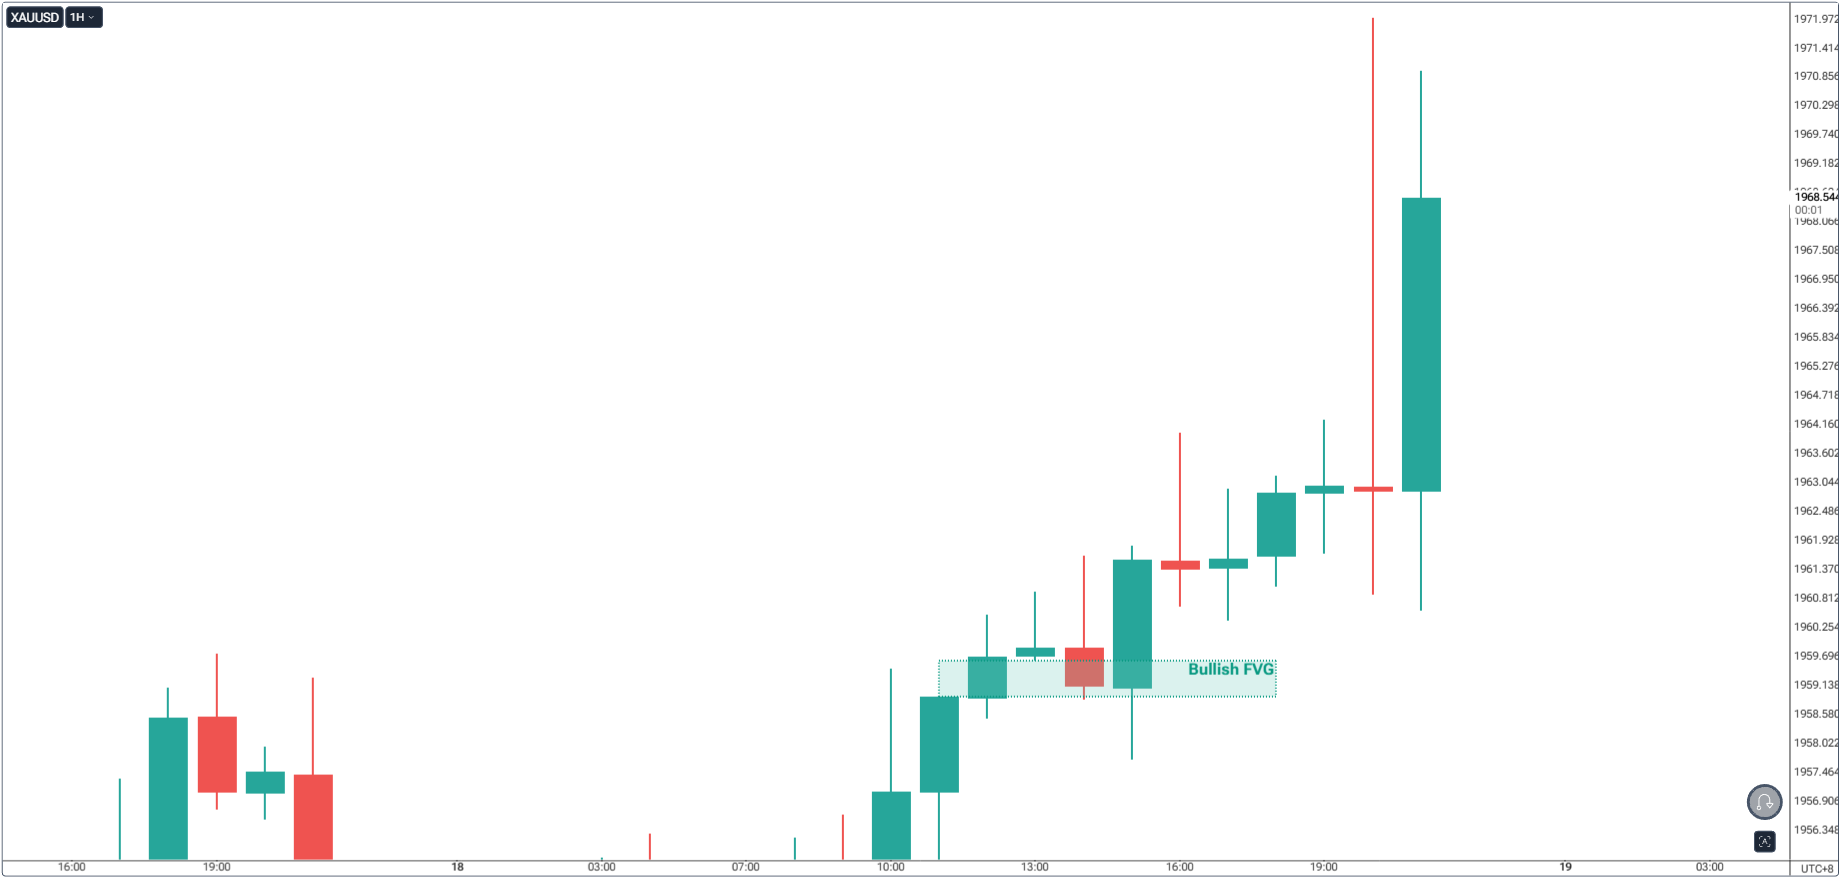
Mid Timeframe Confirmation (15M)
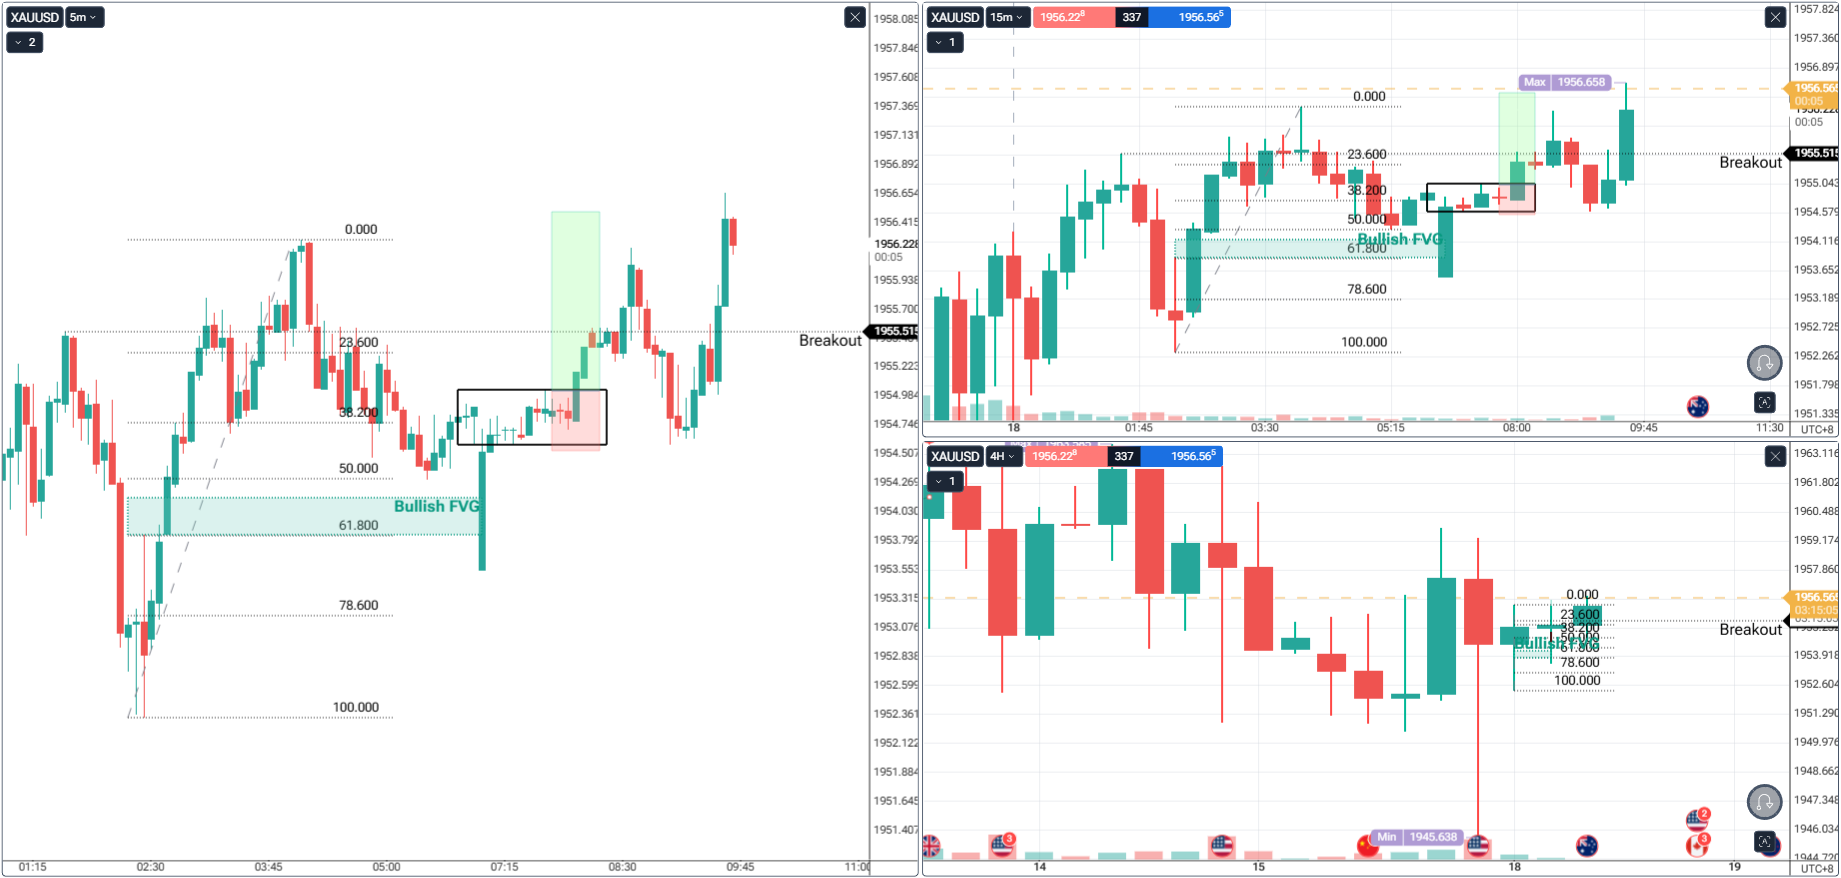
- The 15M chart (top right) shows how price retraced into that M15 FVG level, around the 61.8-78.6% retracement level — perfect confluence level. Adding to the confluence is the orderblock.
- That’s your first layer of confluence: liquidity grab + FVG inside higher timeframe FVG.
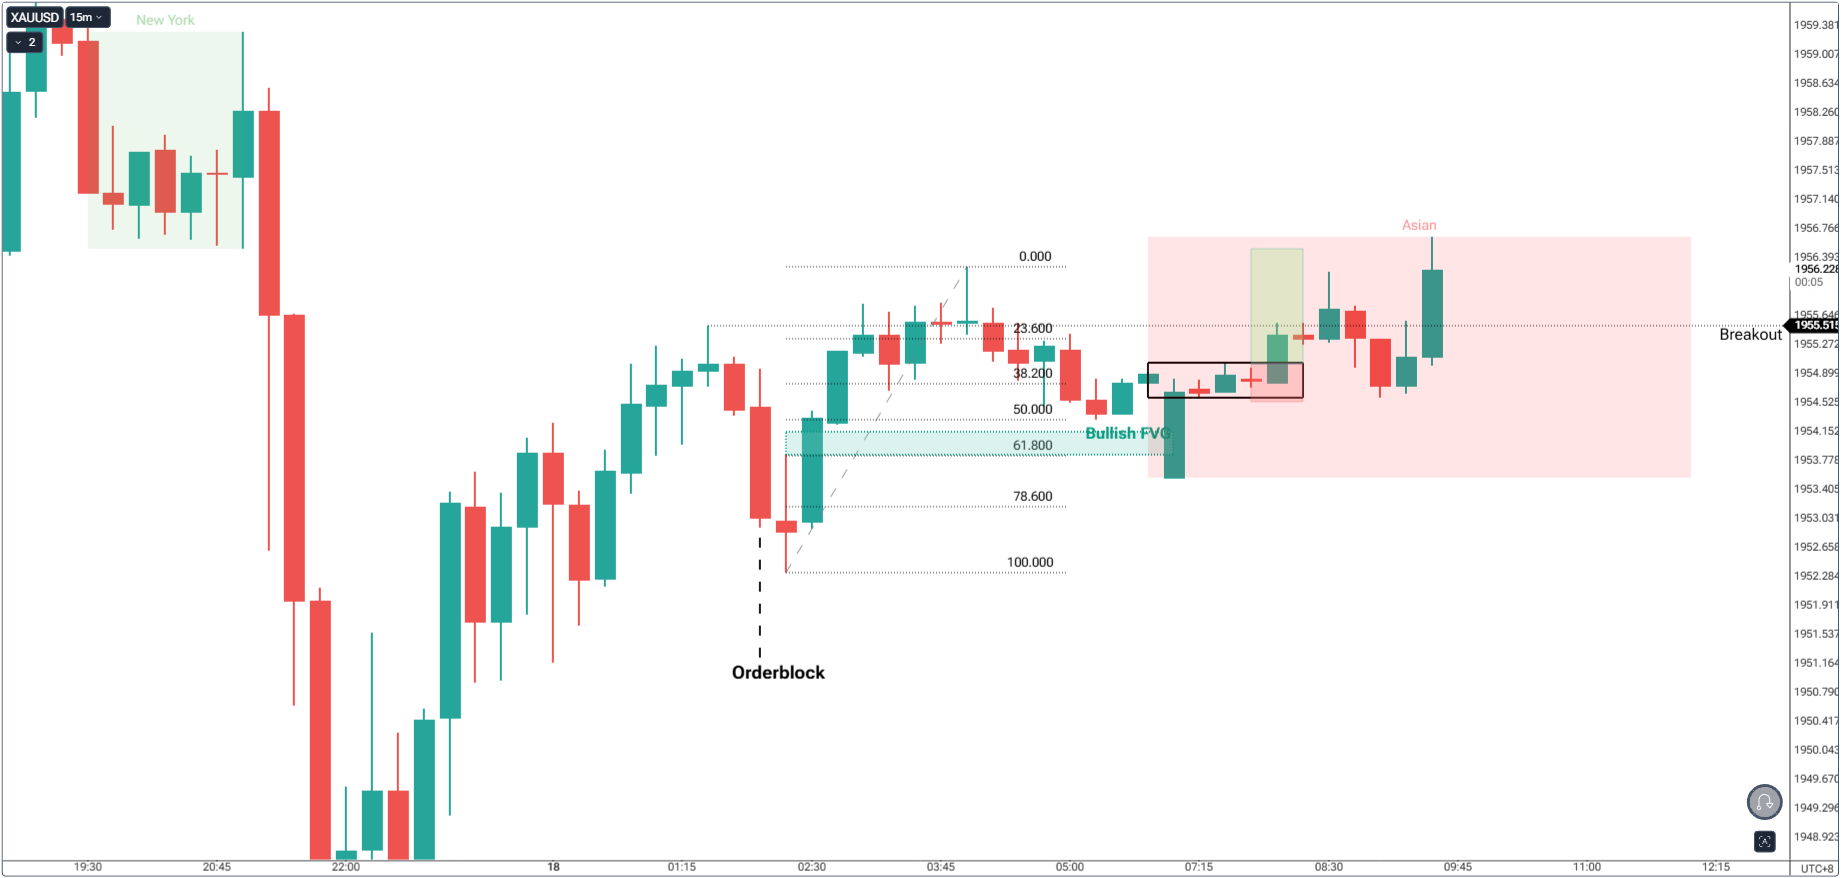
Entry Timeframe Precision (5M)
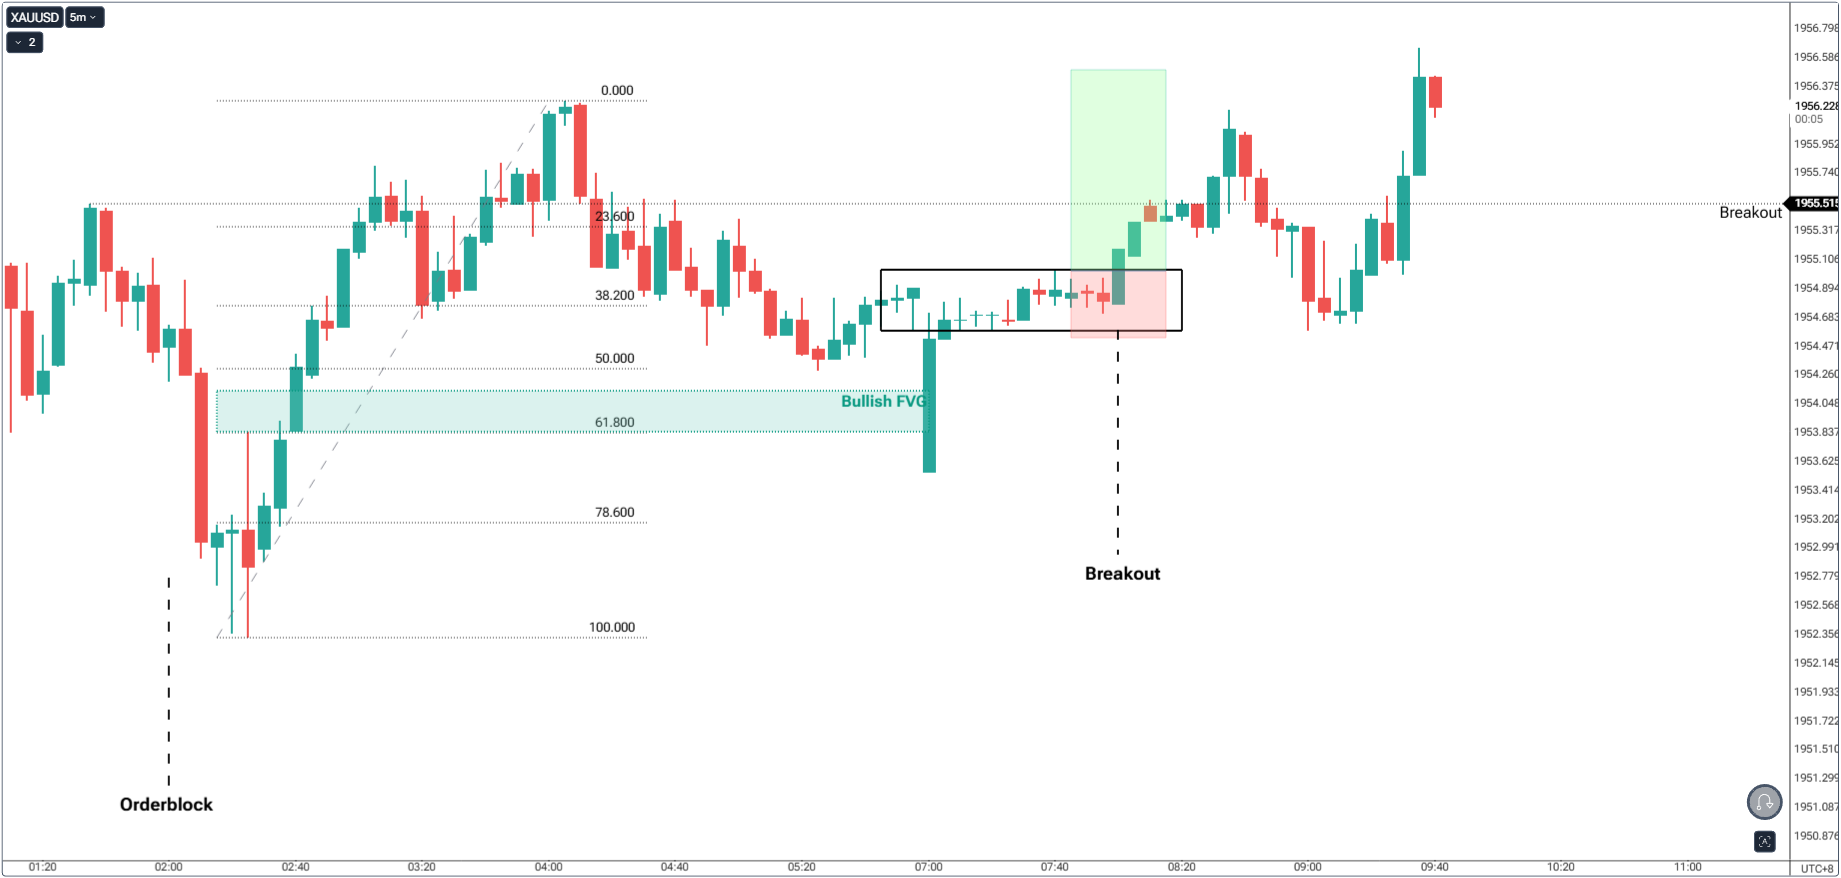
- On the 5M chart (left), the same FVG zone acts as a bullish reaction level.
- After the sweep, price forms a small consolidation (the black box), then breaks structure upward (marked as “Breakout”).
- This is your Market Structure Shift (MSS) confirming short-term order flow change.
- This is now your second layer of confluence at your execution timeframe.
In Simple Terms

You’re not buying because the chart “looks bullish.”
You’re buying because:
- The higher timeframe shows strong rejection.
- The mid timeframe shows liquidity swept and imbalance.
- The lower timeframe confirms with a shift in order flow through a breakout.
3. Liquidity Concepts for Swing Trading: Spotting Institutional Footprints

Institutions don’t chase obvious breakouts; they engineer them to harvest stops. Equal highs/lows and crisp trendlines become liquidity shelves. When price wicks through a well-advertised high and fails to continue, it often signals the “fill” phase before reversal or continuation. To see these footprints with clarity, review liquidity sweeps in SMC and practice distinguishing genuine displacement from head-fakes.
4. Fair Value Gaps & Order Blocks Simplified for Higher Timeframes
- Fair Value Gap (FVG): A fast-move imbalance that price often rebalances later.
- Order Block (OB): The last opposing candle(s) before a strong move that caused a break of structure.
On higher timeframes (4H/D/W), these zones can act like institutional footprints. Your best swing entries come from trading from these zones, not into them. When in doubt, revisit Fair Value Gaps Explained to keep your markings consistent and avoid bloated, ambiguous boxes.
Real-Life Analogy: The Architect’s Blueprint
A pro architect doesn’t start hammering nails randomly. They study the master plan, check load-bearing points, and align angles before a single cut. The Daily is your blueprint, 4H is your frame, and 1H is your finishing work. Skip one, and the structure warps—even if it looks pretty at first.
Final Thoughts
The swing trader toolkit is less about collecting tools and more about sequencing them: bias → liquidity → zone → trigger → risk. Keep your blueprint (Daily), framework (4H), and finishing work (1H) talking to each other. When they agree—and only then—execute with clarity.
If you want to see these ideas in live market form, pair this with multi-timeframe SMC examples and a refresher on why SMC works. For newcomers building structure, this beginner’s strategy path will keep you grounded.
FAQs
What’s the best timeframe trio for swing trading?
Daily–4H–1H provides a clean chain from bias → structure → execution.
Do I need indicators for this?
No. Price action, structure, and liquidity are sufficient—add tools only if they clarify, not clutter.
How do I validate an OB or FVG?
It should be tied to a clear break of structure and ideally sit after a liquidity event. Use the FVG primer for consistency.
Where does risk management fit?
At the center. Position sizing and stop placement turn good ideas into sustainable results; lock in a plan with this risk management compilation.
Start Practicing with Confidence - Risk-Free!
- Trade forex, indices, gold, and more
- Access ACY, MT4, MT5, & Copy Trading Platforms
- Practice with zero risk
It’s time to go from theory to execution - risk-free.
Create an Account. Start Your Free Demo!
Check Out My Contents:
Strategies That You Can Use
Looking for step-by-step approaches you can plug straight into the charts? Start here:
- How To Trade & Scalp Indices at the Open Using Smart Money Concepts (SMC)
- How to Trade Breakouts Effectively in Day Trading with Smart Money Concepts
- Complete Step-by-Step Guide to Day Trading Gold (XAU/USD) with Smart Money Concepts (SMC)
- The Power of Multi-Timeframe Analysis in Smart Money Concepts (SMC)
- Forex Trading Strategy for Beginners
- Mastering Candlestick Pattern Analysis with the SMC Strategy for Day Trading
- How to Use Fibonacci to Set Targets & Stops (Complete Guide)
- RSI Divergence Trading Strategy for Gold: How to Identify and Trade Trend Reversals
- Stochastics Trading Secrets: How to Time Entries in Trending Markets using Stochastics
- Gold Trading Stochastics Strategy: How to Trade Gold with 2R - 3R Targets
- RSI Hidden Divergence Explained: How to Spot Trend Continuations Like a Pro
- Moving Averages Trading Strategy Playbook
- Mastering Fibonacci Trading Psychology - Trusting the Levels, Managing the Mind
- Mastering Price Action at Key Levels - How to Spot, Trade, and Win at the Most Crucial Zones
- Mastering Retests: How to Enter with Confirmation After a Breakout
Indicators / Tools for Trading
Sharpen your edge with proven tools and frameworks:
- The Ultimate Guide to Risk Management in Trading - A Complete Compilation for 2026
- Moving Averages Trading Strategy Playbook
- How to Think Like a Price Action Trader
- Mastering Fibonacci Trading Psychology - Trusting the Levels, Managing the Mind
How To Trade News
News moves markets fast. Learn how to keep pace with SMC-based playbooks:
- Why Smart Money Concepts Work in News-Driven Markets - CPI, NFP, and More
- How to Trade NFP Using Smart Money Concepts (SMC)-A Proven Strategy for Forex Traders
- How to Trade CPI Like Smart Money - A Step-by-Step Guide Using SMC
Learn How to Trade US Indices
From NASDAQ opens to DAX trends, here’s how to approach indices like a pro:
- How to Start Trading Indices and Get into the Stock Market with Low Capital (2026 Guide)
- Best Indices to Trade for Day Traders | NASDAQ, S&P 500, DAX + Best Times to Trade Them
- How To Trade & Scalp Indices at the Open Using Smart Money Concepts (SMC)
- NAS100 - How to Trade the Nasdaq Like a Pro (Smart Money Edition)
How to Start Trading Gold
Gold remains one of the most traded assets - - here’s how to approach it with confidence:
- How to Swing Trade Gold (XAU/USD) Using Smart Money Concepts: A Simple Guide for Traders
- Complete Step-by-Step Guide to Day Trading Gold (XAU/USD) with Smart Money Concepts (SMC)
- The Ultimate Guide to Backtesting and Trading Gold (XAU/USD) Using Smart Money Concepts (SMC)
- Why Gold Remains the Ultimate Security in a Shifting World
- How to Exit & Take Profits in Trading Gold Like a Pro: Using RSI, Range Breakdowns, and MAs as Your Confluence
How to Trade Japanese Candlesticks
Candlesticks are the building blocks of price action. Master the most powerful ones:
- Mastering the Top Japanese Candlesticks: The Top 5 Candlesticks To Trade + Top SMC Candlestick Pattern
- How to Trade Candlestick Patterns with High Probability: A Complete Guide for Beginners
- The Top Japanese Candlestick Guide: What is an Engulfing Pattern and How to Trade It?
- Piercing Pattern Candlestick Explained: How to Trade It - Step-By-Step Guide
- Morning & Evening Star Candlestick Patterns - How to Trade Market Reversals with Confidence
How to Start Day Trading
Ready to go intraday? Here’s how to build consistency step by step:
- 5 Steps to Start Day Trading: A Strategic Guide for Beginners
- 8 Steps How to Start Forex Day Trading in 2026: A Beginner’s Step-by-Step Guide
- 3 Steps to Build a Trading Routine for Consistency and Discipline - Day Trading Edition
- The Ultimate Guide to Understanding Market Trends and Price Action
- Trading with Momentum: The Best Trading Session to Trade Forex, Gold and Indices
Learn how to navigate yourself in times of turmoil
Markets swing between calm and chaos. Learn to read risk-on vs risk-off like a pro:
- How to Identify Risk-On and Risk-Off Market Sentiment: A Complete Trader’s Guide
- How to Trade Risk-On and Risk-Off Sentiment - With Technical Confirmation
- The Ultimate Guide to Understanding Market Trends and Price Action
Want to learn how to trade like the Smart Money?
Step inside the playbook of institutional traders with SMC concepts explained:
- Why Smart Money Concepts Work: The Truth Behind Liquidity and Price Action
- Mastering the Market with Smart Money Concepts: 5 Strategic Approaches
- Understanding Liquidity Sweep: How Smart Money Trades Liquidity Zones in Forex, Gold, US Indices
- The SMC Playbook Series Part 1: What Moves the Markets? Key Drivers Behind Forex, Gold & Stock Indices
- The SMC Playbook Series Part 2: How to Spot Liquidity Pools in Trading-Internal vs External Liquidity Explained
- Fair Value Gaps Explained: How Smart Money Leaves Footprints in the Market
- Accumulation, Manipulation, Distribution: The Hidden Cycle That Runs Every Market
- Institutional Order Flow - Reading the Market Through the Eyes of the Big Players
- London Session Trading Secrets: How Smart Money Sets the High & Low of the Day
- Mastering the New York Session - Smart Money Concepts Guide
Master the World’s Most Popular Forex Pairs
Forex pairs aren’t created equal - - some are stable, some are volatile, others tied to commodities or sessions.
- The Top 5 All-Time Best Forex Pairs to Trade
- Top Forex Pairs Beyond the Big Five
- EUR/USD: The King of Forex
- USD/JPY: The Fast Mover
- GBP/USD: The Volatile Cable
- AUD/USD: The Commodity Currency
- USD/CAD: The Oil-Backed Pair
- GBP/JPY: How to Trade The Beast
- Asian & London Session Secrets
- Mastering the New York Session
Stop Hunting 101
If you’ve ever been stopped out right before the market reverses - - this is why:
- Stop Hunting 101: How Swing Highs and Lows Become Liquidity Traps
- Outsmarting Stop Hunts: The Psychology Behind the Trap
- How to Lessen Risk From Stop Hunts in Trading
- How Stop Hunts Trigger Revenge Trading - Breaking the Pain Cycle
- How to Accept Stop Hunts Without Losing Discipline - Shifting From Frustration to Focus
Trading Psychology
Mindset is the deciding factor between growth and blowups. Explore these essentials:
- The Mental Game of Execution - Debunking the Common Trading Psychology
- Managing Trading Losses: Why You Can Be Wrong and Still Win Big in Trading
- The Hidden Threat in Trading: How Performance Anxiety Sabotages Your Edge
- Why 90% of Retail Traders Fail Even with Profitable Trading Strategies
- Top 10 Habits Profitable Traders Follow Daily to Stay Consistent
- Top 10 Trading Rules of the Most Successful Traders
- Top 10 Ways to Prevent Emotional Trading and Stay Disciplined in the Markets
- Why Most Traders Fail - Trading Psychology & The Hidden Mental Game
- Emotional Awareness in Trading - Naming Your Triggers
- Discipline vs. Impulse in Trading - Step-by Step Guide How to Build Control
- Trading Journal & Reflection - The Trader’s Mirror
- Overcoming FOMO & Revenge Trading in Forex - Why Patience Pays
- Risk of Ruin in Trading - Respect the Math of Survival
- Identity-Based Trading: Become Your Trading System for Consistency
- Trading Psychology: Aligning Emotions with Your System
- Mastering Fear in Trading: Turn Doubt into a Protective Signal
- Mastering Greed in Trading: Turn Ambition into Controlled Growth
- Mastering Boredom in Trading: From Restless Clicking to Patient Precision
- Mastering Doubt in Trading: Building Confidence Through Backtesting and Pattern Recognition
- Mastering Impatience in Trading: Turn Patience Into Profit
- Mastering Frustration in Trading: Turning Losses Into Lessons
- Mastering Hope in Trading: Replacing Denial With Discipline
- When to Quit on Trading - Read This!
- The Math of Compounding in Trading
- Why Daily Wins Matter More Than Big Wins
- Scaling in Trading: When & How to Increase Lot Sizes
- Why Patience in Trading Fuels the Compounding Growth
- Step-by-Step Guide on How to Manage Losses for Compounding Growth
- The Daily Habits of Profitable Traders: Building Your Compounding Routine
- Trading Edge: Definition, Misconceptions & Casino Analogy
- Finding Your Edge: From Chaos to Clarity
- Proving Your Edge: Backtesting Without Bias
- Forward Testing in Trading: How to Prove Your Edge Live
- Measuring Your Edge: Metrics That Matter
- Refining Your Edge: Iteration Without Overfitting
- The EDGE Framework: Knowing When and How to Evolve as a Trader
- Scaling Your Edge: From Small Account to Consistency
Market Drivers
- Central Banks and Interest Rates: How They Move Your Trades
- Inflation & Economic Data: CPI Trading Strategy and PPI Indicator Guide
- Geopolitical Risks & Safe Havens in Trading (Gold, USD, JPY, CHF)
- Jobs, Growth & Recession Fears: NFP, GDP & Unemployment in Trading
- Commodities & Global Trade: Oil, Gold, and Forex Explained
- Market Correlations & Intermarket Analysis for Traders
Swing Trading 101
- Introduction to Swing Trading
- The Market Basics for Swing Trading
- Core Principles of Swing Trading
- The Technical Foundations Every Swing Trader Must Master
Risk Management
The real edge in trading isn’t strategy - it’s how you protect your capital:
- Mastering Risk Management: Stop Loss, Take Profit, and Position Sizing
- Why Risk Management Is the Only Edge That Lasts
- How Much Should You Risk per Trade? (1%, 2%, or Less?)
- The Ultimate Risk Management Plan for Prop Firm Traders - Updated 2026
- Mastering Position Sizing: Automate or Calculate Your Risk Like a Pro
- Martingale Strategy in Trading: Compounding Power or Double-Edged Sword?
- How to Add to Winners Using Cost Averaging and Martingale Principle with Price Confirmation
Suggested Learning Path
If you’re not sure where to start, follow this roadmap:
- Start with Trading Psychology → Build the mindset first.
- Move into Risk Management → Learn how to protect capital.
- Explore Strategies & Tools → Candlesticks, Fibonacci, MAs, Indicators.
- Apply to Assets → Gold, Indices, Forex sessions.
- Advance to Smart Money Concepts (SMC) → Learn how institutions trade.
- Specialize → Stop Hunts, News Trading, Turmoil Navigation.
This way, you’ll grow from foundation → application → mastery, instead of jumping around randomly.
Follow me for more daily market insights!
Jasper Osita - LinkedIn - FXStreet - YouTube
This content may have been written by a third party. ACY makes no representation or warranty and assumes no liability as to the accuracy or completeness of the information provided, nor any loss arising from any investment based on a recommendation, forecast or other information supplies by any third-party. This content is information only, and does not constitute financial, investment or other advice on which you can rely.
Try These Next

