The Technical Foundations Every Swing Trader Must Master
2025-10-09 11:10:24


When you strip away the colors, tools, and fancy indicators, every chart still speaks one language: price action. Before you try to forecast the next swing, train your eyes to listen to what price already said-through swings, highs/lows, and structure. If you want a gentle step-in to this world, start with the series intro and market groundwork you’ve covered-your Introduction to Swing Trading and Market Basics for Swing Trading-so today’s lesson slots into a clean mental model.
How to Read Price Action: Swings, Highs/Lows & Market Structure

Price moves in impulses and corrections. In an uptrend, you’ll see HH/HL; in a downtrend, LH/LL-that’s your market structure. Your job isn’t to chase every wiggle; it’s to read where displacement began, where liquidity was taken, and where structure shifts. If the “why” behind these moves intrigues you, the SMC foundation pieces-like Why Smart Money Concepts Work and Fair Value Gaps Explained-help you see how institutions leave footprints you can actually trade.
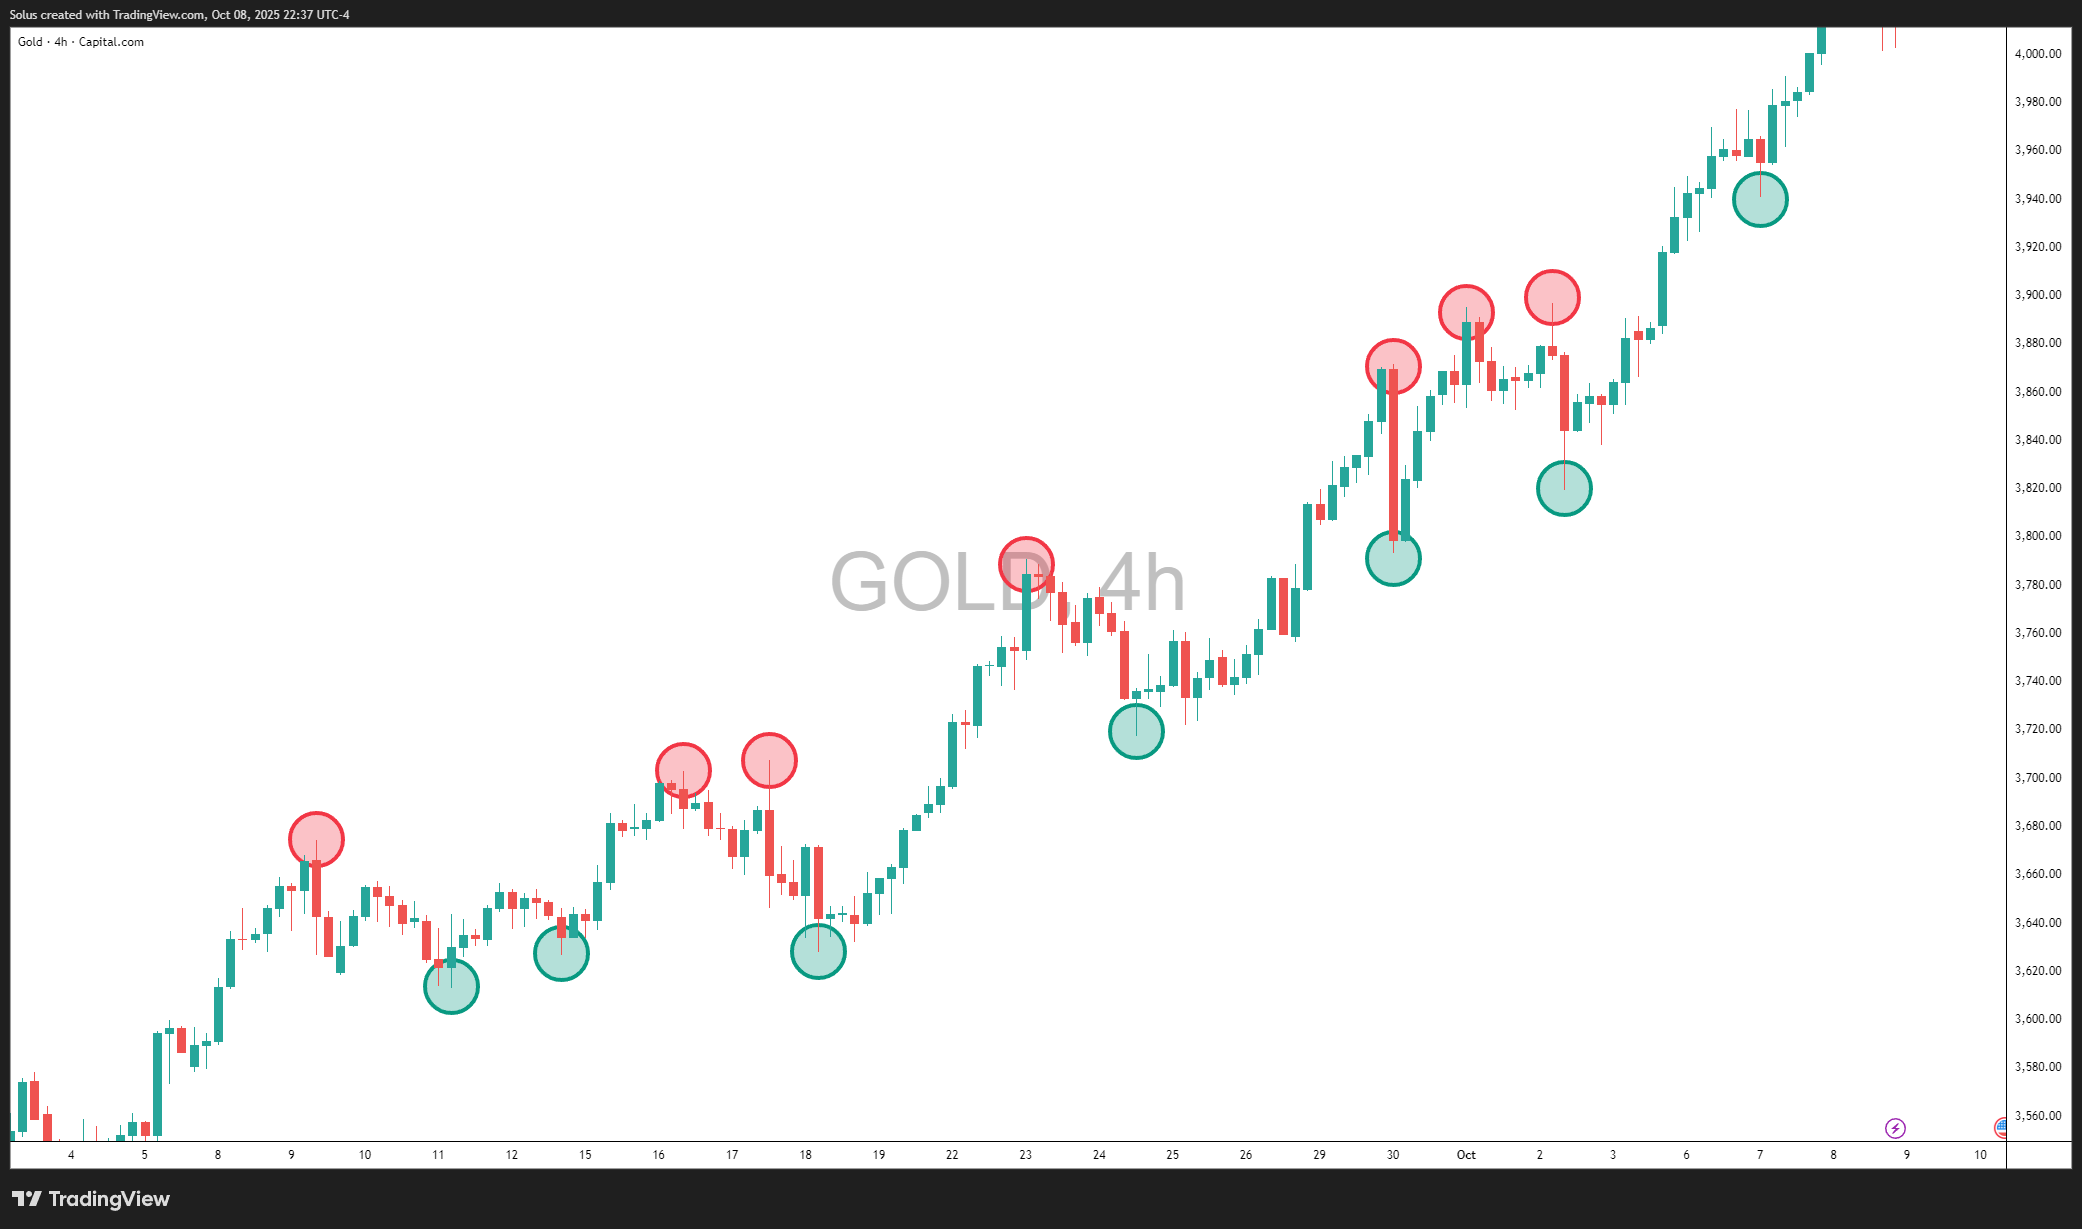
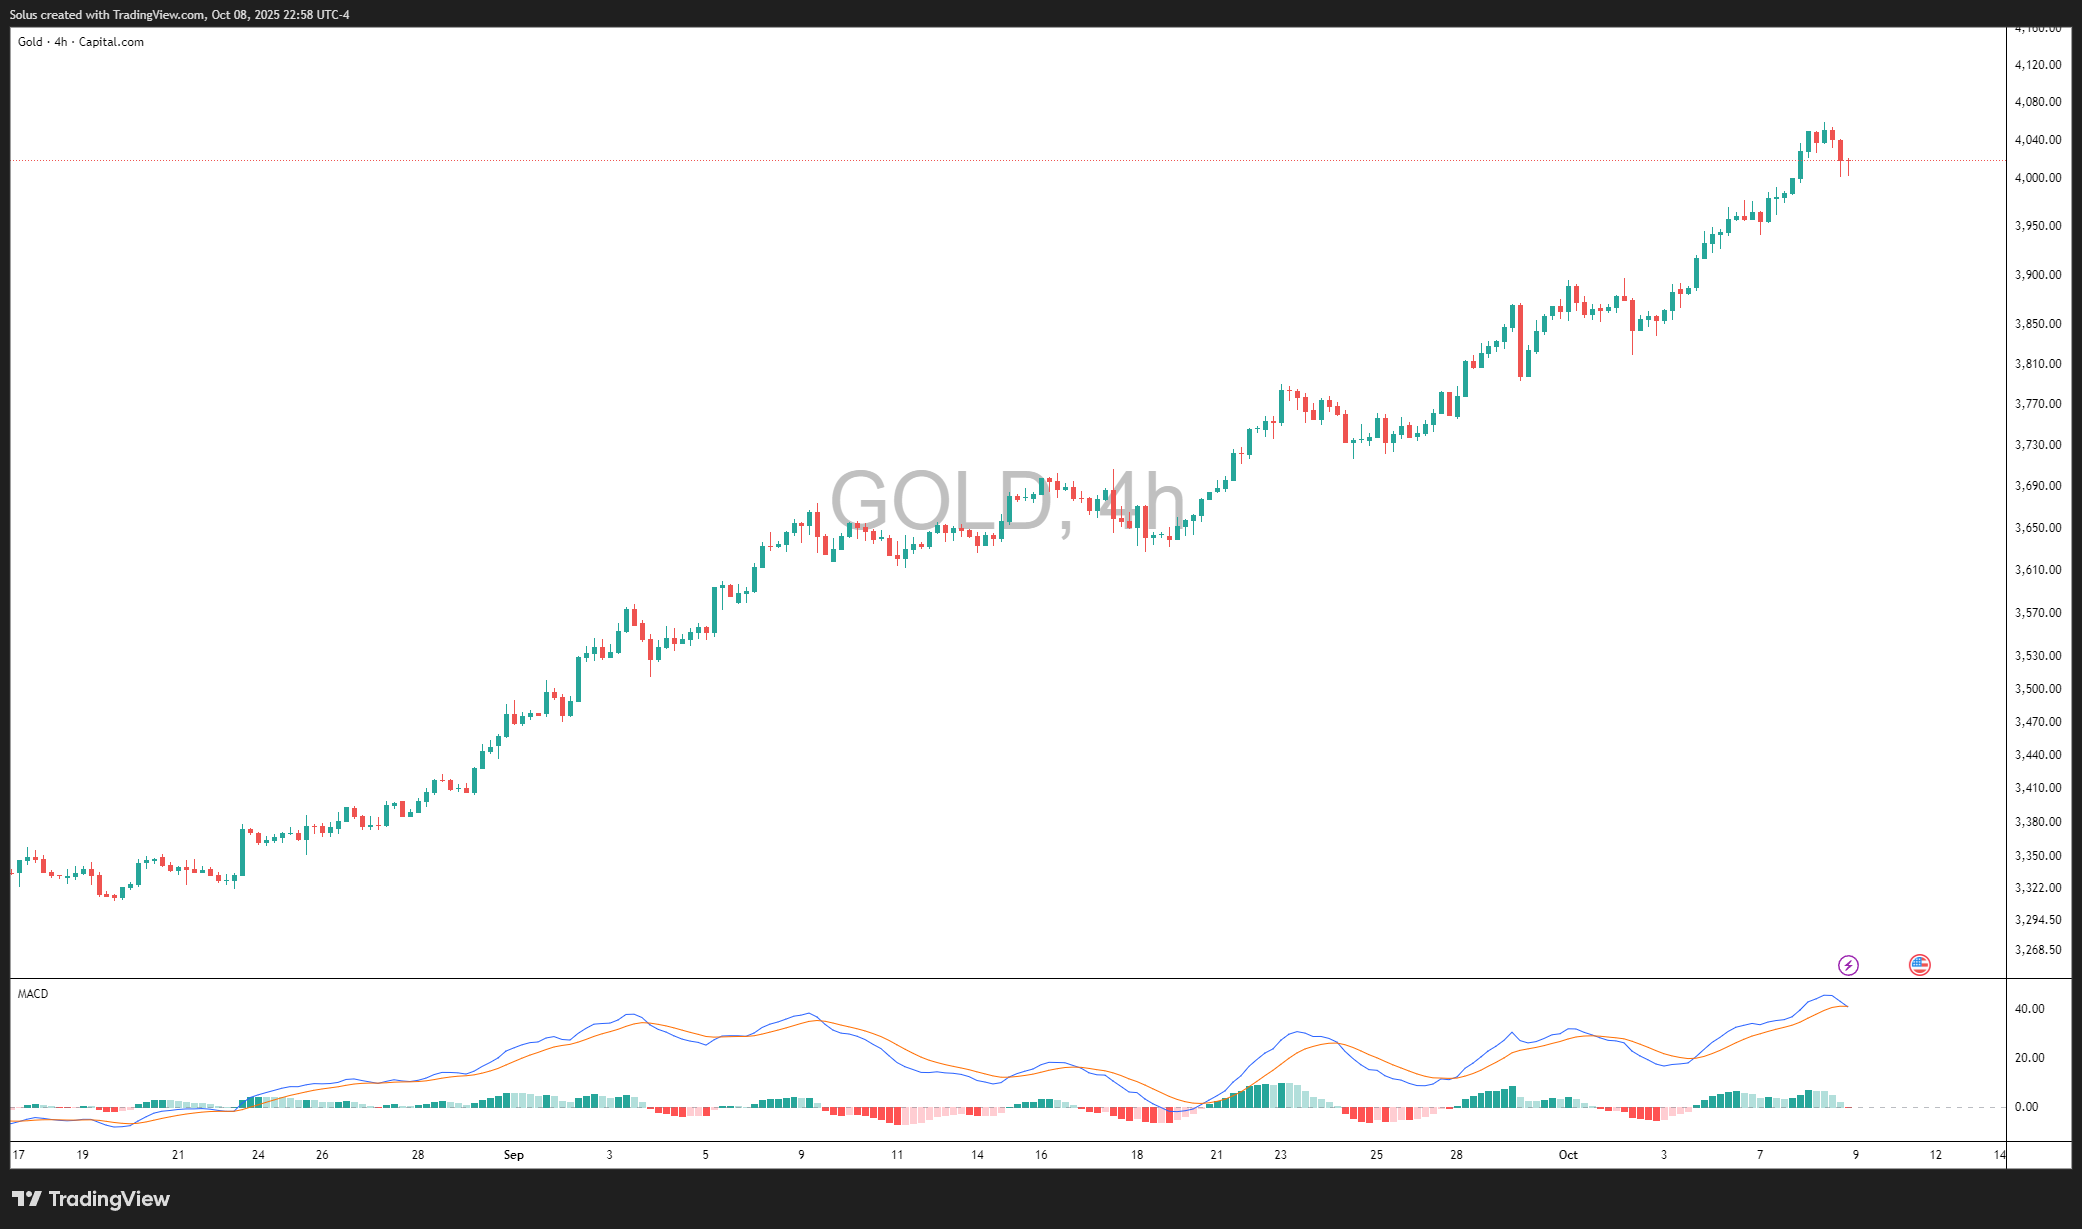
In the Gold 4H chart above, notice how each green circle marks a higher low and each red circle marks a higher high. This rhythmic pattern is what defines an uptrend - buyers consistently defending higher levels while pushing price to new peaks. When this pattern breaks (for example, a higher low fails to hold), it signals that the market may be transitioning or taking a breather.
Your job isn’t to chase every wiggle; it’s to read where displacement began, where liquidity was taken, and where structure shifts. These turning points often reveal institutional footprints - areas where smart money entered or exited positions.
If the “why” behind these moves intrigues you, the SMC foundation pieces - like Why Smart Money Concepts Work and Fair Value Gaps Explained - show how these structural shifts align with liquidity engineering.
And if you’re just starting out, reinforce this visual learning with Forex Trading Strategy for Beginners, which translates this price rhythm into clear entry, stop, and take-profit logic.
Support & Resistance Basics
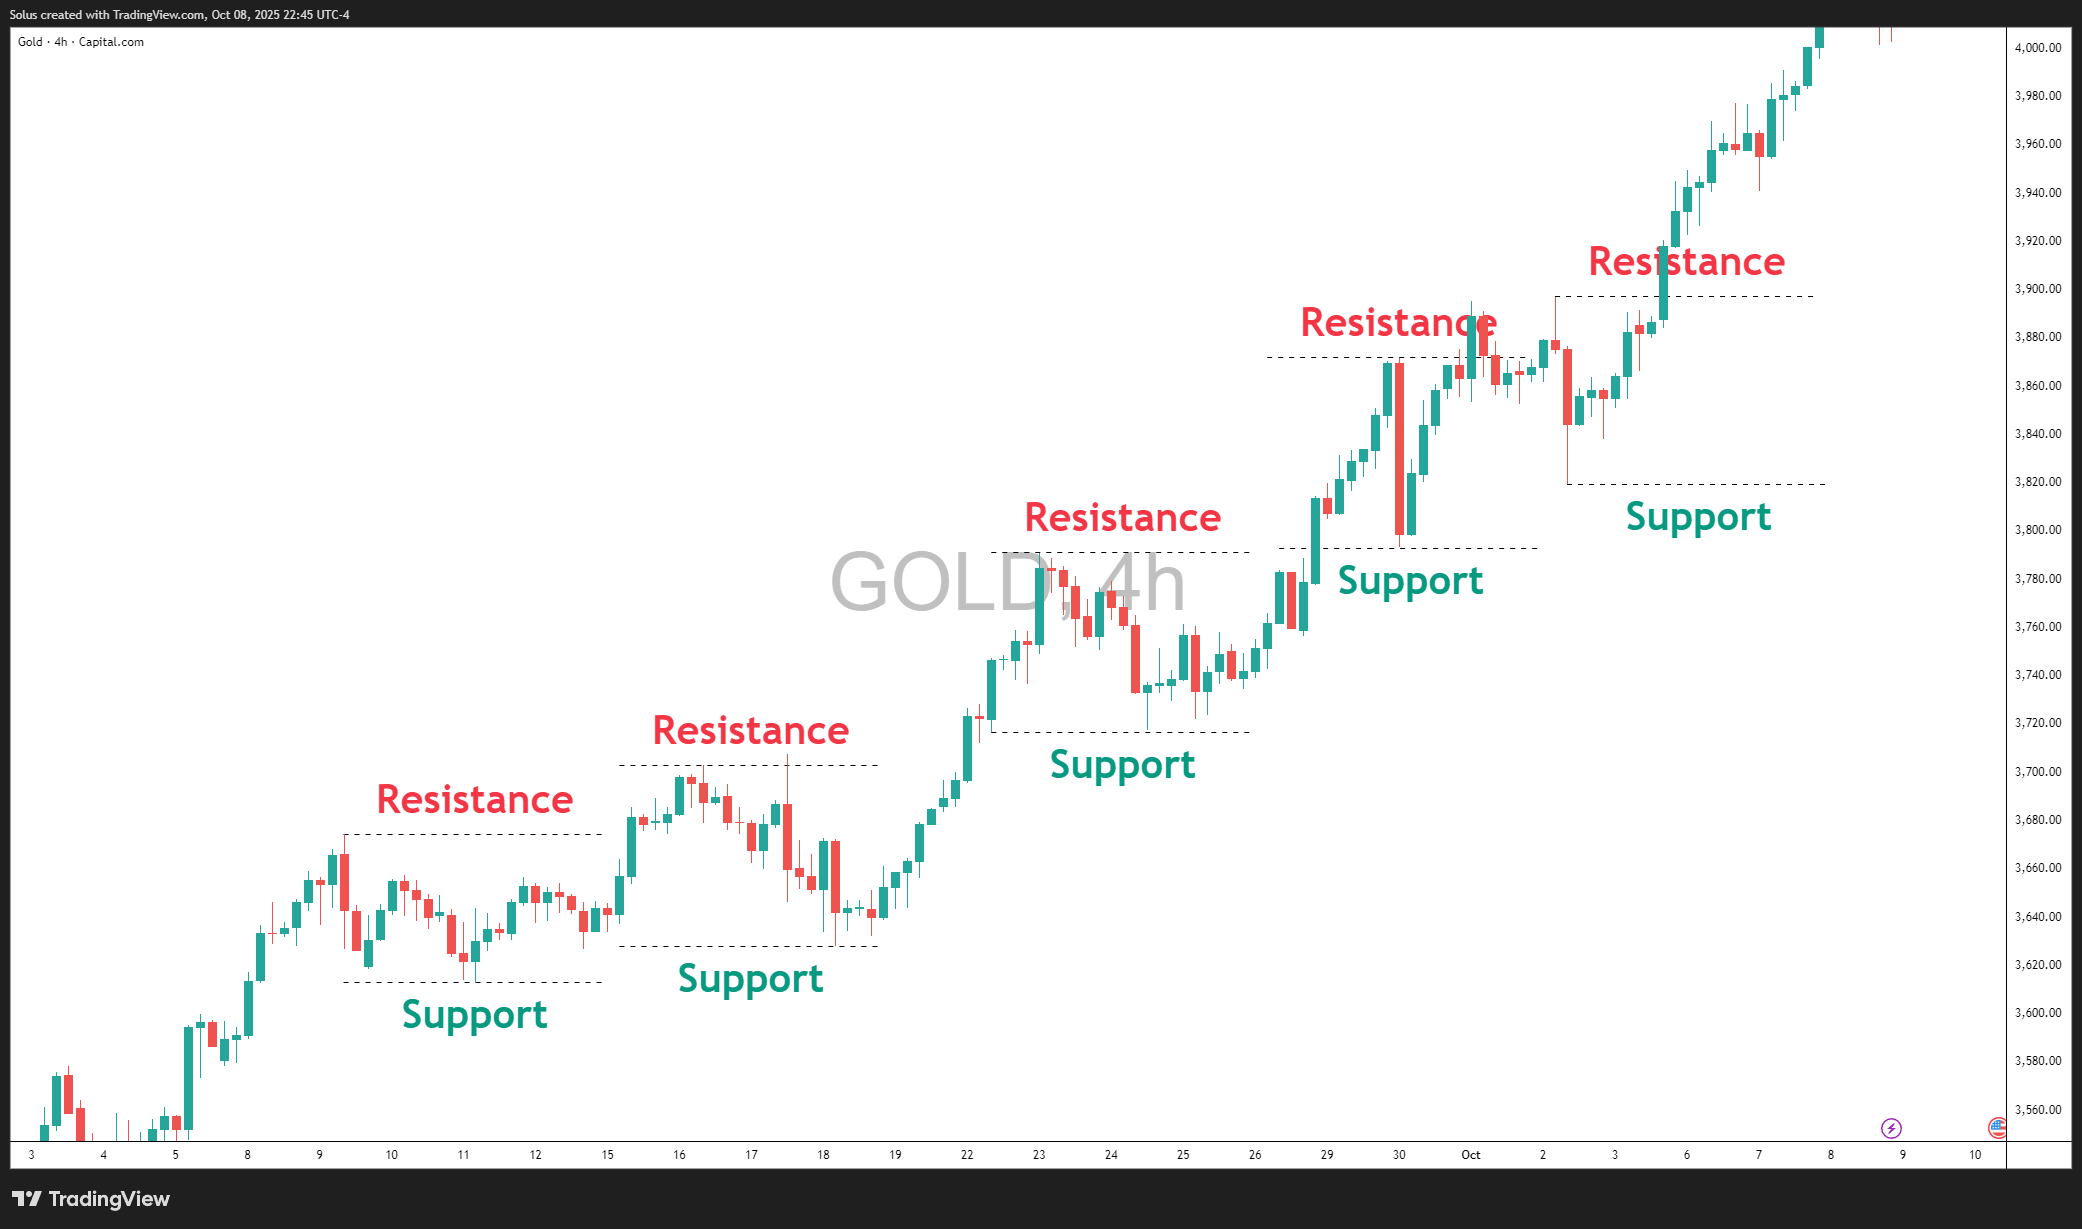
The chart above (Gold 4H) perfectly illustrates how support and resistance form the backbone of technical structure.
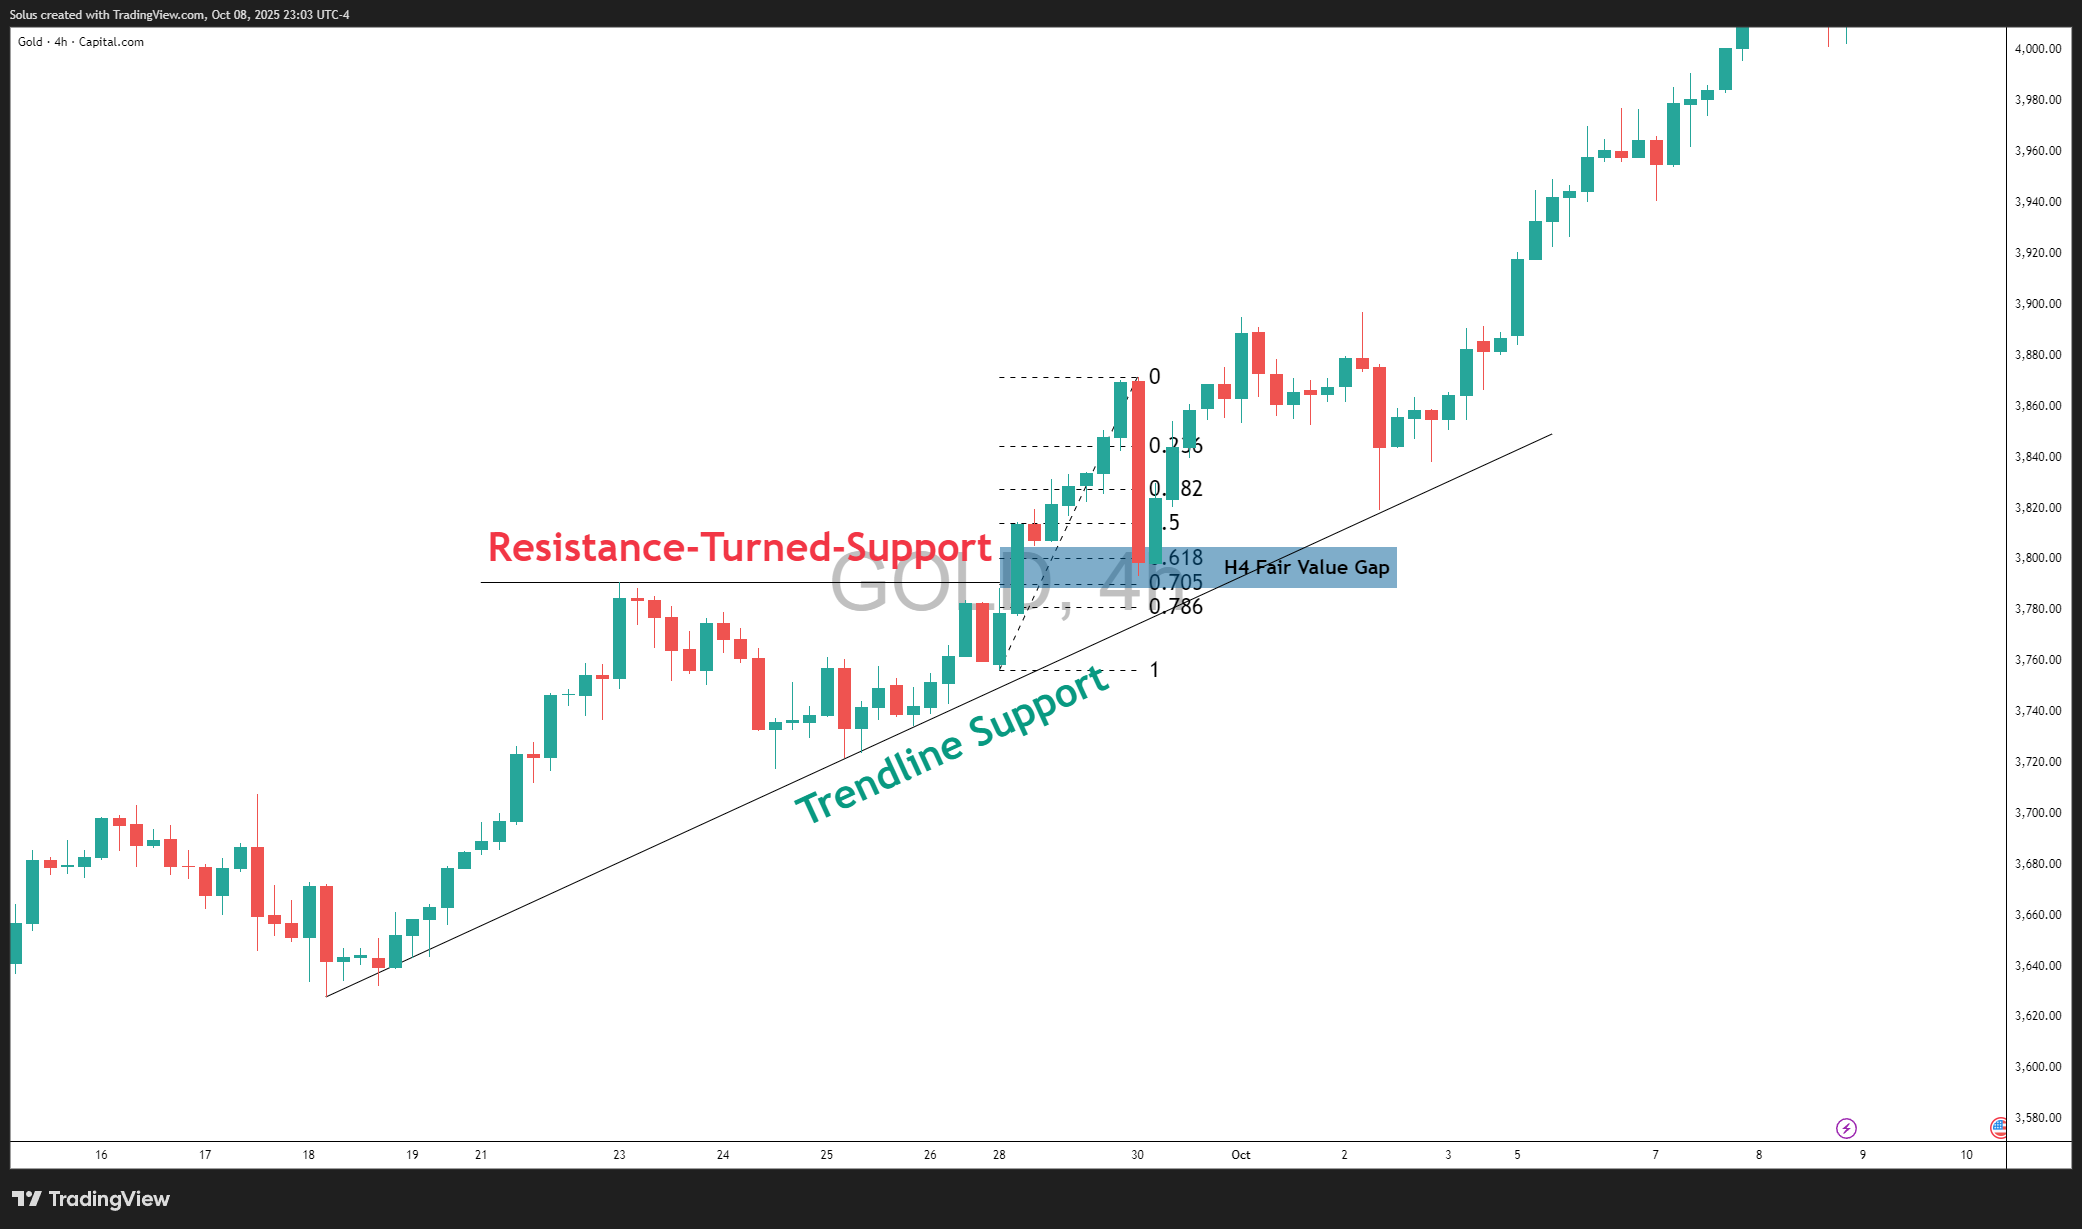
Each time price rallies into a ceiling and stalls, we mark that level as resistance. When price later breaks above it and retests from above, it transforms into support - a concept known as role reversal.
Notice how gold respects this rhythm. Every breakout to a new high eventually finds its footing on the previous resistance, confirming that buyers are defending prior battle zones. These recurring reactions are what we call memory zones - areas where liquidity previously exchanged hands.
For example, when price broke above the mid-$3,700 resistance, it later came back to retest that same area before launching again toward $3,900+. This behavior shows institutional footprints - where large players defend their earlier positions.
To dive deeper into setups like these, study Mastering Price Action at Key Levels - which explains how to identify high-probability zones - and Mastering Retests, which breaks down the psychology of entering after confirmation instead of impulsively chasing breakouts.

Swing traders who align these levels with key sessions often find cleaner and more predictable entries. For instance, the New York Session SMC Guide shows how liquidity tends to interact with support and resistance during high-volume windows - when smart money is most active.
Trendlines & Channels - Giving Shape to Flow

A trendline connects swing lows in uptrends (or highs in downtrends). Duplicate it to the opposite side to form a channel-your visual corridor of movement. When price accelerates outside the channel with displacement, you may be seeing a new phase unfold. If you prefer a momentum-first view of those phases, the Moving Averages Playbook shows how EMAs can frame the same structure without replacing it.
And if you trade indices where rhythm changes quickly at the open, blend channels with the Indices-at-the-open SMC guide so your line work respects the real drivers of early volatility.
Indicators (EMA, RSI, MACD): Tools, Not Crutches
Indicators are derivatives of price. They’re best for context, not commands.
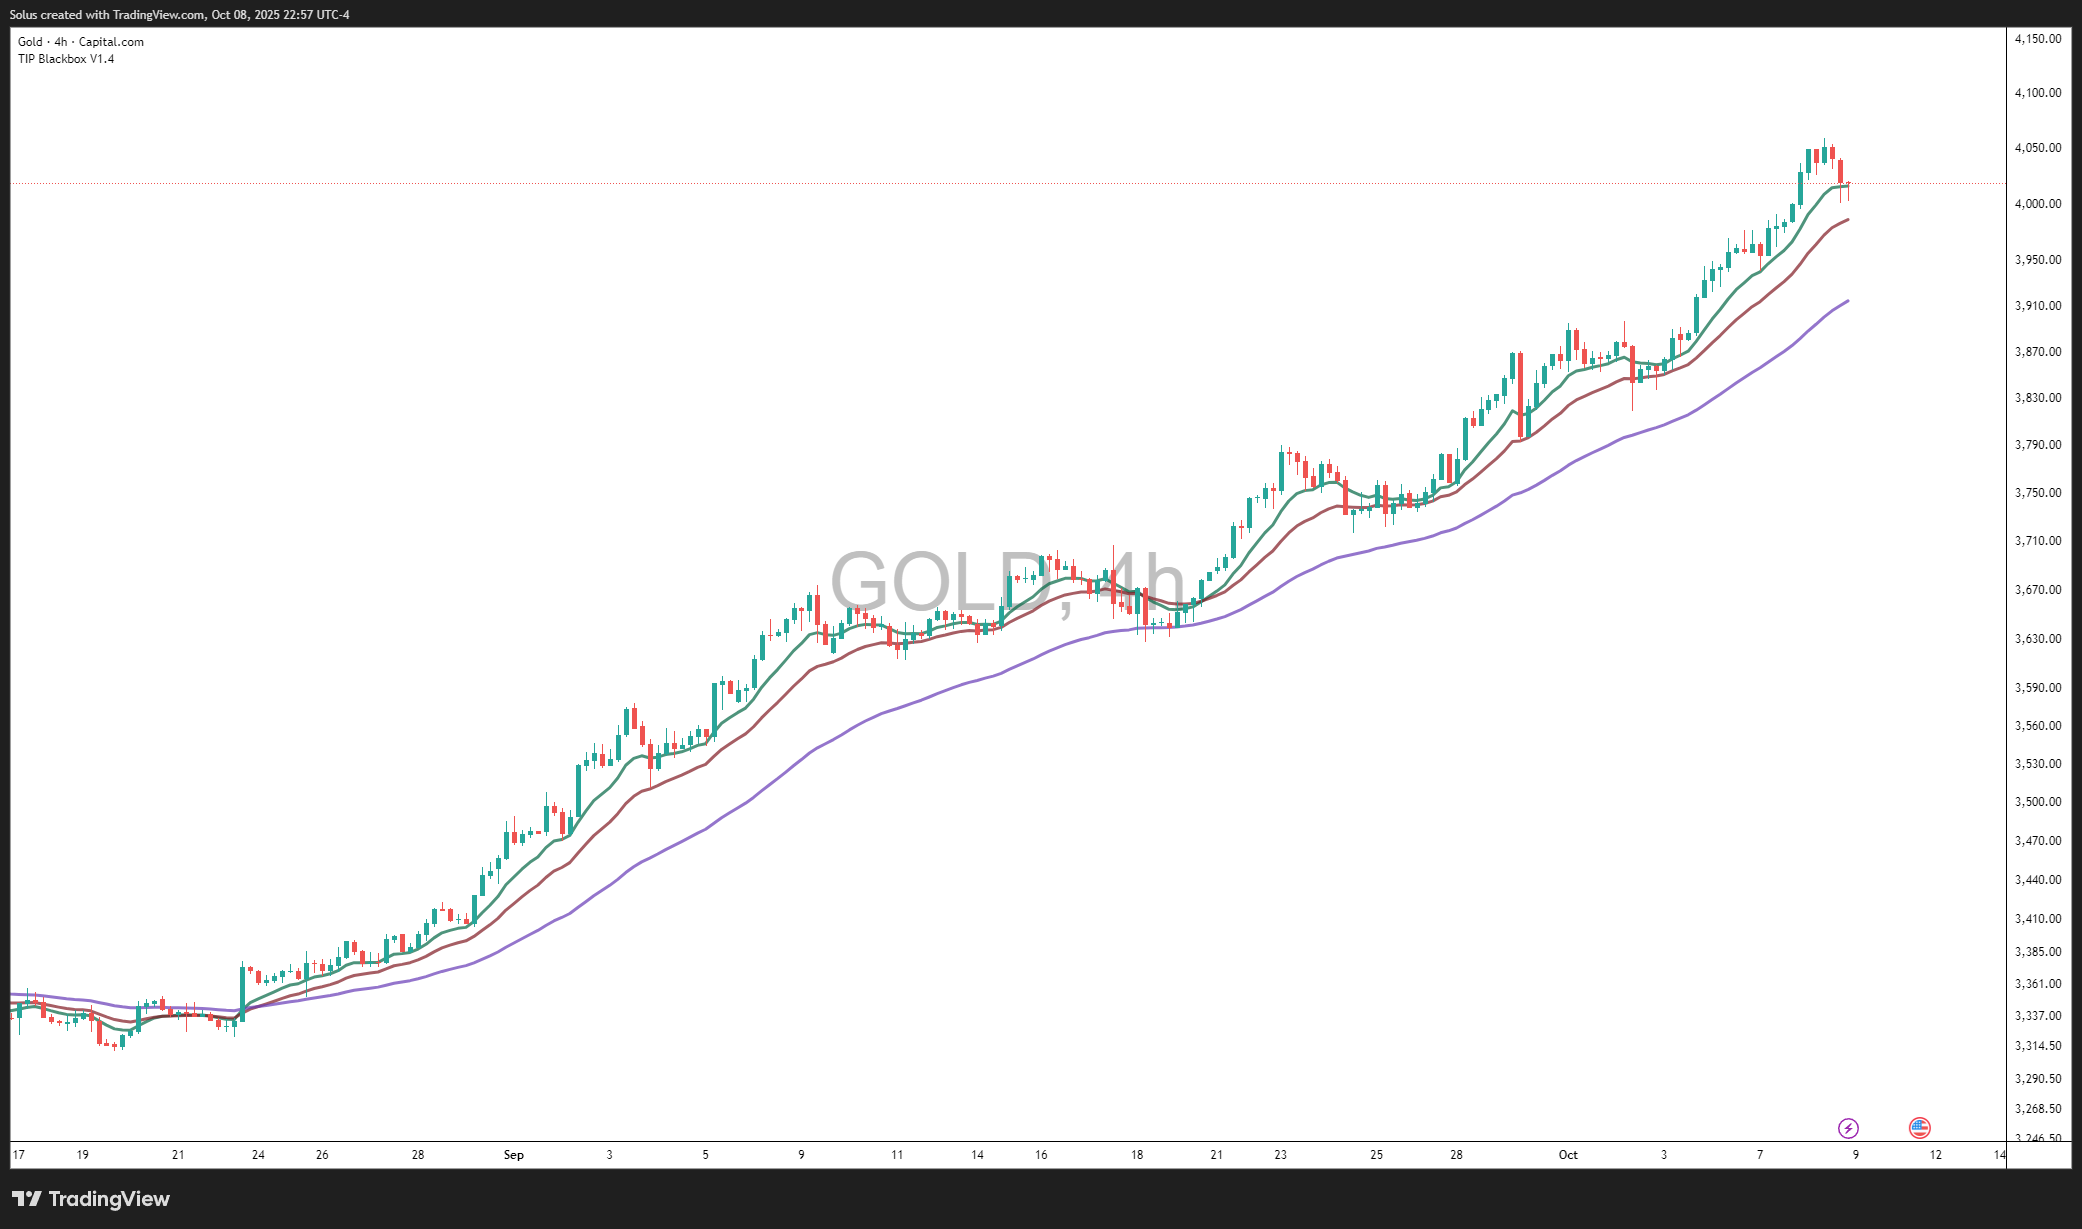
- EMA: Smooths trend and acts as dynamic S/R; pairs well with structure (see the Moving Averages Playbook).
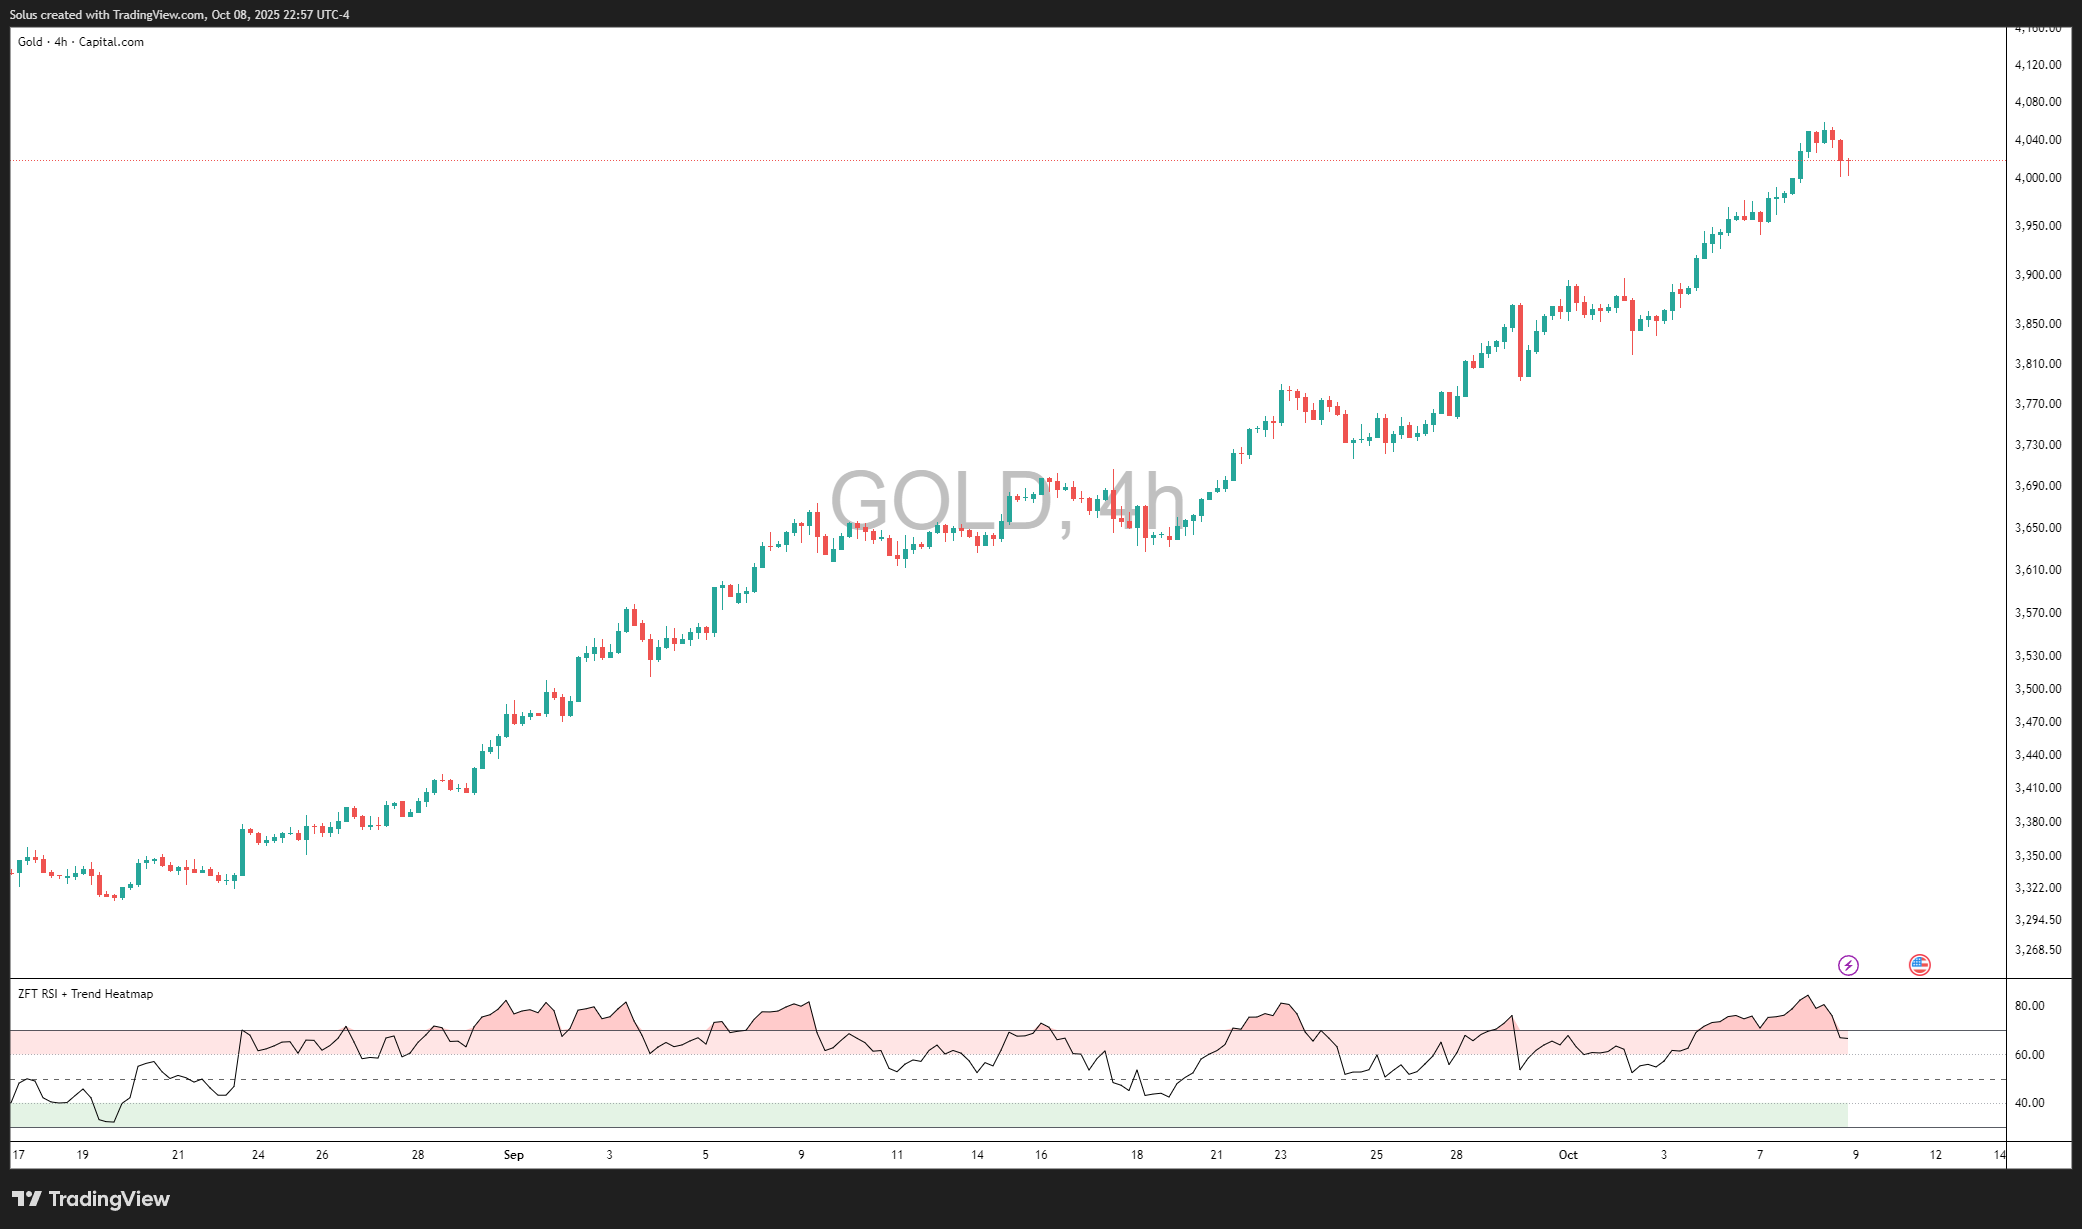
- RSI: Captures momentum extremes and divergence; apply it with intentionality via RSI Divergence for Gold or RSI Hidden Divergence for trend continuations.
- MACD: Helps confirm momentum shifts; combine with structure to avoid late entries.
If you like confluence-heavy exits, How to Use Fibonacci to Set Targets & Stops plus EMAs/RSI gives you mechanical landmarks without losing sight of the story price tells. And when the market is news-charged, layer that with How to Trade CPI Like Smart Money to avoid false reads during data spikes.
Why Price Action > Indicators Over Time

Indicators lag. They confirm what already happened. Price-especially when read with liquidity and order-flow context-shows what’s happening now. If you’ve ever been wicked out before a move you “knew” was coming, study Stop Hunting 101 and the follow-ups on lessening stop-hunt risk and the psychology behind traps-you’ll start seeing why “naked” charts often feel more honest.
If you want a structured mental model for this thinking style, read How to Think Like a Price Action Trader so your decisions anchor to narrative first, tools second.
The Power of Confluence
Great trades cluster around agreement: higher-timeframe bias, key level, trendline/channel touch, plus momentum context. One practical recipe: align MTF bias with Power of Multi-Timeframe Analysis in SMC, build your level plan with Price Action at Key Levels, then time confirmation with Retests or RSI divergence. If you’re trading Gold, wire that plan to the asset’s character with How to Swing Trade Gold Using SMC or the Complete Day Trading Gold Guide.
Real-Life Analogy: The Musician and the Sheet Music

Indicators are sheet music-they give rhythm and timing-but the performance lives in the feel. A seasoned trader, like a pianist, senses when to pause, emphasize, or let a phrase breathe. If you relate to this, the mindset layer in Mastering Fibonacci Trading Psychology pairs beautifully with the technicals so your execution stays composed when price “changes tempo.”
Risk Is the Only Edge That Lasts
No technical foundation survives poor risk. Keep your sizing, stops, and daily loss limits in check with Mastering Risk Management, then build a durable plan via Why Risk Management Is the Only Edge That Lasts and How Much Should You Risk per Trade?. When volatility spikes around macro events, stay systematic with Why SMC Works in News-Driven Markets and the NFP/CPI playbooks.
Final Thoughts - The Art Beneath the Charts
Indicators help you see. Price action helps you understand.
Support/resistance are landmarks; trendlines and EMAs are roads; market structure is the map. When you learn to read liquidity, timing, and context, you stop chasing signals and start letting high-quality setups come to you. If you want to practice this without overcomplicating, try a focused path: review Core Principles of Swing Trading, then drill entries with How to Trade Breakouts Effectively and Mastering Retests-you’ll feel the edge compound.
Start Practicing with Confidence - Risk-Free!
- Trade forex, indices, gold, and more
- Access ACY, MT4, MT5, & Copy Trading Platforms
- Practice with zero risk
It’s time to go from theory to execution - risk-free.
Create an Account. Start Your Free Demo!
Check Out My Contents:
Strategies That You Can Use
Looking for step-by-step approaches you can plug straight into the charts? Start here:
- How To Trade & Scalp Indices at the Open Using Smart Money Concepts (SMC)
- How to Trade Breakouts Effectively in Day Trading with Smart Money Concepts
- Complete Step-by-Step Guide to Day Trading Gold (XAU/USD) with Smart Money Concepts (SMC)
- The Power of Multi-Timeframe Analysis in Smart Money Concepts (SMC)
- Forex Trading Strategy for Beginners
- Mastering Candlestick Pattern Analysis with the SMC Strategy for Day Trading
- How to Use Fibonacci to Set Targets & Stops (Complete Guide)
- RSI Divergence Trading Strategy for Gold: How to Identify and Trade Trend Reversals
- Stochastics Trading Secrets: How to Time Entries in Trending Markets using Stochastics
- Gold Trading Stochastics Strategy: How to Trade Gold with 2R - 3R Targets
- RSI Hidden Divergence Explained: How to Spot Trend Continuations Like a Pro
- Moving Averages Trading Strategy Playbook
- Mastering Fibonacci Trading Psychology - Trusting the Levels, Managing the Mind
- Mastering Price Action at Key Levels - How to Spot, Trade, and Win at the Most Crucial Zones
- Mastering Retests: How to Enter with Confirmation After a Breakout
Indicators / Tools for Trading
Sharpen your edge with proven tools and frameworks:
- The Ultimate Guide to Risk Management in Trading - A Complete Compilation for 2026
- Moving Averages Trading Strategy Playbook
- How to Think Like a Price Action Trader
- Mastering Fibonacci Trading Psychology - Trusting the Levels, Managing the Mind
How To Trade News
News moves markets fast. Learn how to keep pace with SMC-based playbooks:
- Why Smart Money Concepts Work in News-Driven Markets - CPI, NFP, and More
- How to Trade NFP Using Smart Money Concepts (SMC)-A Proven Strategy for Forex Traders
- How to Trade CPI Like Smart Money - A Step-by-Step Guide Using SMC
Learn How to Trade US Indices
From NASDAQ opens to DAX trends, here’s how to approach indices like a pro:
- How to Start Trading Indices and Get into the Stock Market with Low Capital (2026 Guide)
- Best Indices to Trade for Day Traders | NASDAQ, S&P 500, DAX + Best Times to Trade Them
- How To Trade & Scalp Indices at the Open Using Smart Money Concepts (SMC)
- NAS100 - How to Trade the Nasdaq Like a Pro (Smart Money Edition)
How to Start Trading Gold
Gold remains one of the most traded assets - - here’s how to approach it with confidence:
- How to Swing Trade Gold (XAU/USD) Using Smart Money Concepts: A Simple Guide for Traders
- Complete Step-by-Step Guide to Day Trading Gold (XAU/USD) with Smart Money Concepts (SMC)
- The Ultimate Guide to Backtesting and Trading Gold (XAU/USD) Using Smart Money Concepts (SMC)
- Why Gold Remains the Ultimate Security in a Shifting World
- How to Exit & Take Profits in Trading Gold Like a Pro: Using RSI, Range Breakdowns, and MAs as Your Confluence
How to Trade Japanese Candlesticks
Candlesticks are the building blocks of price action. Master the most powerful ones:
- Mastering the Top Japanese Candlesticks: The Top 5 Candlesticks To Trade + Top SMC Candlestick Pattern
- How to Trade Candlestick Patterns with High Probability: A Complete Guide for Beginners
- The Top Japanese Candlestick Guide: What is an Engulfing Pattern and How to Trade It?
- Piercing Pattern Candlestick Explained: How to Trade It - Step-By-Step Guide
- Morning & Evening Star Candlestick Patterns - How to Trade Market Reversals with Confidence
How to Start Day Trading
Ready to go intraday? Here’s how to build consistency step by step:
- 5 Steps to Start Day Trading: A Strategic Guide for Beginners
- 8 Steps How to Start Forex Day Trading in 2026: A Beginner’s Step-by-Step Guide
- 3 Steps to Build a Trading Routine for Consistency and Discipline - Day Trading Edition
- The Ultimate Guide to Understanding Market Trends and Price Action
- Trading with Momentum: The Best Trading Session to Trade Forex, Gold and Indices
Learn how to navigate yourself in times of turmoil
Markets swing between calm and chaos. Learn to read risk-on vs risk-off like a pro:
- How to Identify Risk-On and Risk-Off Market Sentiment: A Complete Trader’s Guide
- How to Trade Risk-On and Risk-Off Sentiment - With Technical Confirmation
- The Ultimate Guide to Understanding Market Trends and Price Action
Want to learn how to trade like the Smart Money?
Step inside the playbook of institutional traders with SMC concepts explained:
- Why Smart Money Concepts Work: The Truth Behind Liquidity and Price Action
- Mastering the Market with Smart Money Concepts: 5 Strategic Approaches
- Understanding Liquidity Sweep: How Smart Money Trades Liquidity Zones in Forex, Gold, US Indices
- The SMC Playbook Series Part 1: What Moves the Markets? Key Drivers Behind Forex, Gold & Stock Indices
- The SMC Playbook Series Part 2: How to Spot Liquidity Pools in Trading-Internal vs External Liquidity Explained
- Fair Value Gaps Explained: How Smart Money Leaves Footprints in the Market
- Accumulation, Manipulation, Distribution: The Hidden Cycle That Runs Every Market
- Institutional Order Flow - Reading the Market Through the Eyes of the Big Players
- London Session Trading Secrets: How Smart Money Sets the High & Low of the Day
- Mastering the New York Session - Smart Money Concepts Guide
Master the World’s Most Popular Forex Pairs
Forex pairs aren’t created equal - - some are stable, some are volatile, others tied to commodities or sessions.
- The Top 5 All-Time Best Forex Pairs to Trade
- Top Forex Pairs Beyond the Big Five
- EUR/USD: The King of Forex
- USD/JPY: The Fast Mover
- GBP/USD: The Volatile Cable
- AUD/USD: The Commodity Currency
- USD/CAD: The Oil-Backed Pair
- GBP/JPY: How to Trade The Beast
- Asian & London Session Secrets
- Mastering the New York Session
Stop Hunting 101
If you’ve ever been stopped out right before the market reverses - - this is why:
- Stop Hunting 101: How Swing Highs and Lows Become Liquidity Traps
- Outsmarting Stop Hunts: The Psychology Behind the Trap
- How to Lessen Risk From Stop Hunts in Trading
- How Stop Hunts Trigger Revenge Trading - Breaking the Pain Cycle
- How to Accept Stop Hunts Without Losing Discipline - Shifting From Frustration to Focus
Trading Psychology
Mindset is the deciding factor between growth and blowups. Explore these essentials:
- The Mental Game of Execution - Debunking the Common Trading Psychology
- Managing Trading Losses: Why You Can Be Wrong and Still Win Big in Trading
- The Hidden Threat in Trading: How Performance Anxiety Sabotages Your Edge
- Why 90% of Retail Traders Fail Even with Profitable Trading Strategies
- Top 10 Habits Profitable Traders Follow Daily to Stay Consistent
- Top 10 Trading Rules of the Most Successful Traders
- Top 10 Ways to Prevent Emotional Trading and Stay Disciplined in the Markets
- Why Most Traders Fail - Trading Psychology & The Hidden Mental Game
- Emotional Awareness in Trading - Naming Your Triggers
- Discipline vs. Impulse in Trading - Step-by Step Guide How to Build Control
- Trading Journal & Reflection - The Trader’s Mirror
- Overcoming FOMO & Revenge Trading in Forex - Why Patience Pays
- Risk of Ruin in Trading - Respect the Math of Survival
- Identity-Based Trading: Become Your Trading System for Consistency
- Trading Psychology: Aligning Emotions with Your System
- Mastering Fear in Trading: Turn Doubt into a Protective Signal
- Mastering Greed in Trading: Turn Ambition into Controlled Growth
- Mastering Boredom in Trading: From Restless Clicking to Patient Precision
- Mastering Doubt in Trading: Building Confidence Through Backtesting and Pattern Recognition
- Mastering Impatience in Trading: Turn Patience Into Profit
- Mastering Frustration in Trading: Turning Losses Into Lessons
- Mastering Hope in Trading: Replacing Denial With Discipline
- When to Quit on Trading - Read This!
- The Math of Compounding in Trading
- Why Daily Wins Matter More Than Big Wins
- Scaling in Trading: When & How to Increase Lot Sizes
- Why Patience in Trading Fuels the Compounding Growth
- Step-by-Step Guide on How to Manage Losses for Compounding Growth
- The Daily Habits of Profitable Traders: Building Your Compounding Routine
- Trading Edge: Definition, Misconceptions & Casino Analogy
- Finding Your Edge: From Chaos to Clarity
- Proving Your Edge: Backtesting Without Bias
- Forward Testing in Trading: How to Prove Your Edge Live
- Measuring Your Edge: Metrics That Matter
- Refining Your Edge: Iteration Without Overfitting
- The EDGE Framework: Knowing When and How to Evolve as a Trader
- Scaling Your Edge: From Small Account to Consistency
Market Drivers
- Central Banks and Interest Rates: How They Move Your Trades
- Inflation & Economic Data: CPI Trading Strategy and PPI Indicator Guide
- Geopolitical Risks & Safe Havens in Trading (Gold, USD, JPY, CHF)
- Jobs, Growth & Recession Fears: NFP, GDP & Unemployment in Trading
- Commodities & Global Trade: Oil, Gold, and Forex Explained
- Market Correlations & Intermarket Analysis for Traders
Swing Trading 101
Risk Management
The real edge in trading isn’t strategy - it’s how you protect your capital:
- Mastering Risk Management: Stop Loss, Take Profit, and Position Sizing
- Why Risk Management Is the Only Edge That Lasts
- How Much Should You Risk per Trade? (1%, 2%, or Less?)
- The Ultimate Risk Management Plan for Prop Firm Traders - Updated 2026
- Mastering Position Sizing: Automate or Calculate Your Risk Like a Pro
- Martingale Strategy in Trading: Compounding Power or Double-Edged Sword?
- How to Add to Winners Using Cost Averaging and Martingale Principle with Price Confirmation
Suggested Learning Path
If you’re not sure where to start, follow this roadmap:
- Start with Trading Psychology → Build the mindset first.
- Move into Risk Management → Learn how to protect capital.
- Explore Strategies & Tools → Candlesticks, Fibonacci, MAs, Indicators.
- Apply to Assets → Gold, Indices, Forex sessions.
- Advance to Smart Money Concepts (SMC) → Learn how institutions trade.
- Specialize → Stop Hunts, News Trading, Turmoil Navigation.
This way, you’ll grow from foundation → application → mastery, instead of jumping around randomly.
Follow me for more daily market insights!
Jasper Osita - LinkedIn - FXStreet - YouTube
This content may have been written by a third party. ACY makes no representation or warranty and assumes no liability as to the accuracy or completeness of the information provided, nor any loss arising from any investment based on a recommendation, forecast or other information supplies by any third-party. This content is information only, and does not constitute financial, investment or other advice on which you can rely.
Try These Next

