Master Candlestick Entries: Reading Price Action at Key Levels
2025-12-02 09:29:42


Candlesticks are the language of the market.
Key levels are the grammar.
When you combine the two, you finally understand what price is trying to do - not based on hope, not based on signals, not based on someone’s post on social media, but based on raw, unfiltered market behavior.
This is where structure turns into execution - the same execution logic taught in guides like Mastering Price Action at Key Levels and the institutional breakdowns in Fair Value Gaps Explained.
This module teaches you how to interpret candlesticks in context, which is exactly how they are used inside SMC concepts, liquidity sweeps, breaker structures, FVGs, order blocks, and multi-timeframe confirmation models like The Confirmation Matrix.
This is execution - the real kind.
Why Candlesticks Are Still the Best Chart Type (The Honest Comparison Most Beginners Never Get)
Before diving into engulfings or wicks, we need to answer a question you probably never asked:
Why do professional traders use candlesticks instead of line charts, Heiken Ashi, or Renko?
Let’s break it down in real, trader-to-trader language.
Line Chart - Clean, Simple, and Sadly Blind
The line chart is comforting.
It’s clean.
It’s minimalistic.
It makes the market look friendlier than it actually is.
But a line chart hides the most important information:
- liquidity wicks
- rejection spikes
- stop-hunt shadows
- engulfing takeover candles
- displacement
- manipulation
- the candle that broke structure
- the wick that swept liquidity
A line chart will NEVER show you what smart money is doing - the core focus of guides like Why Smart Money Concepts Work.
It’s clean, yes.
But it hides the truth.
Heiken Ashi - Smooth Trends, Filtered Reality
Heiken Ashi candles smooth out price movement by averaging data.
They remove noise.
They make trends look perfect.
This is why trend traders pair them with concepts found in Moving Averages Strategy Playbook.
But the smoothing hides the information you need for precise entries:
- the liquidity sweep wick
- the retest rejection
- the micro engulfing
- the BOS candle
- the manipulation candle
- the FVG creation candle
Heiken Ashi is great for visualizing trends…
Terrible for precision execution.
Renko - Beautiful Structure, Horrible Timing
Renko removes time.
It builds bricks only when price moves a fixed amount.
Renko is powerful for big-picture directional bias.
Pairs well with concepts in How to Trade Breakouts Effectively and Swing Trading Market Basics.
But Renko hides:
- the rejection wick that signaled reversal
- the breaker candle
- the liquidity sweep
- the displacement impulse
- the manipulation entry candle
Renko can help you “see the trend,”
but it will not help you enter the trend.
Candlesticks - The Market’s Unfiltered Voice
Candlesticks show:
- where buyers stepped in
- where sellers rejected price
- where institutions absorbed liquidity
- where retail got trapped
- where displacement occurred
- where momentum shifted
- where manipulation happened
- where orders sat
- where stops were hunted
This is why nearly every real price-action or SMC guide - from Mastering Candlestick Pattern Analysis to How to Think Like a Price Action Trader - bases its execution rules on candlesticks at key levels.
They don’t just show data.
They show emotion.
They show the battle between buyers and sellers.
The hesitation before news.
The aggression after a sweep.
The exhaustion before reversal.
The manipulation before expansion.
Candlesticks reveal the truth.
Everything else summarizes it.
The Execution Patterns You’ll Use (At Real Levels)
1. Engulfing Patterns - When One Side Takes Full Control
An engulfing candle wipes out the previous candle.
It shows aggression.
It shows intent.
This is why engulfings often appear before or after:
- liquidity sweeps
- breaker flips
- FVG creation
- BOS / CHoCH
- order block confirmation
And why they show up repeatedly in SMC-based guides like Order Blocks and AMD Market Structure and The Confirmation Model.
An engulfing at a key level is not a pattern.
It’s a data point of control.
2. Rejection Wicks - When Price Says “No.”

A long wick is a message.
Price tapped a level…
one side rejected it aggressively…
and sentiment flipped instantly.
Rejection wicks reveal:
- liquidity takers
- failed breakouts
- manipulations
- absorption zones
- stop-hunts
- institutional reaction points
These are the exact behaviors taught in Mastering Price Action at Key Levels.
Wicks are truth-tellers.
3. Breaker Candles - The Market Fakes You Out, Then Flips
A breaker is institutional trickery at its finest.
Price “breaks” a structure, retail traders jump in, price reverses, their stops become liquidity.
This is why breaker behavior is deeply tied with the concepts behind Anatomy of a Valid Order Block.
A breaker isn’t just a reversal.
It’s a trap.
4. Inside Bars & Outside Bars - Pressure and Release
Inside bar = the calm.
Outside bar = the explosion.

You see these constantly before news-driven displacement, explained in guides like:
Inside bars = compression.
Outside bars = expansion.
Learn them, and volatility stops surprising you.
All the Candlestick Patterns (Mentioned Only - No Need to Memorize)
Here are the classic patterns you’ll see in books and online:
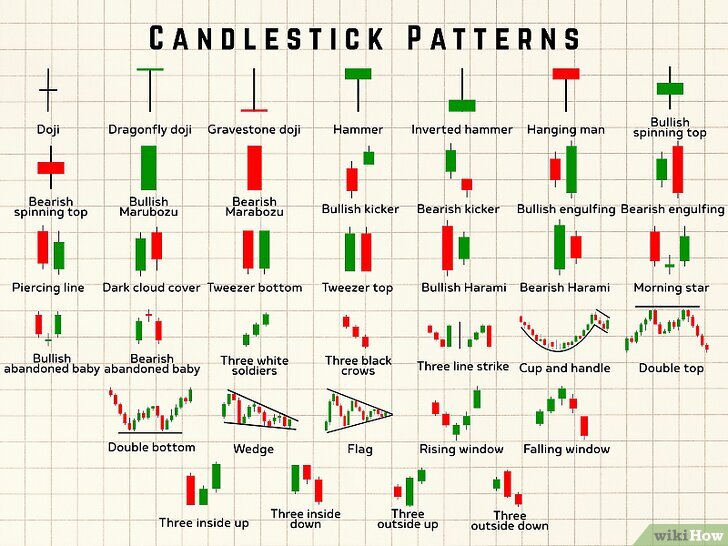
- Doji
- Hammer
- Shooting Star
- Engulfing
- Inside Bar
- Outside Bar
- Tweezer Top / Bottom
- Morning Star / Evening Star
- Harami
- Piercing Line
- Dark Cloud Cover
- Dragonfly Doji
- Gravestone Doji
- Spinning Top
- Marubozu
- Three Black Crows
- Three White Soldiers
- Hanging Man
- Inverted Hammer
Now here’s the truth:
You don’t need to memorize ANY of them to trade profitably.
Nearly all high-probability execution comes from just four:
- Engulfings
- Rejection Wicks
- Breaker Candles
- Inside Bars
Why?
Because when placed at the right level,
these patterns reveal liquidity, manipulation, and intent - the core of Smart Money Concepts.
Don’t be a candlestick encyclopedia.
Be a price interpreter.
Momentum: The Candle Shows It Before the Indicator Does
Momentum reveals itself visually long before an indicator reacts:
- thick candle bodies
- consecutive direction candles
- tiny pullbacks
- strong displacement
- fresh FVG creation
- fast reactions after sweeps
These behaviors form the foundation of guides like Ultimate Guide to Market Trends & Price Action and Flow State Trading.
Indicators lag.
Candles lead.
Final Thoughts - This Is Where Trading Becomes Real
This module is the first one that teaches you to execute.
To stop guessing.
To stop reacting emotionally.
To start reading the story price is telling.
When you understand candlesticks at key levels:
- confidence rises
- confusion fades
- clarity sharpens
- hesitation drops
- discipline becomes easier
- execution becomes cleaner
You don’t need 20 indicators.
You don’t need 30 patterns.
You don’t need predictions.
You only need:
Candles + Key Levels + Context.
This is the foundation of professional trading - in Forex, Gold, Indices, and every market you’ll ever trade.
FAQs
1. What makes a candlestick pattern “valid”?
A candlestick becomes valid only when it forms at the right location - near liquidity, imbalance, order blocks, or major support/resistance. An engulfing pattern in the middle of nowhere is just noise. The same pattern at a key level becomes a high-probability signal. This is why guides like Mastering Price Action at Key Levels emphasize context over memorization.
2. Are candlestick patterns reliable without indicators?
Yes - and often more reliable. Indicators lag, but candlesticks reveal buyers vs sellers in real time. When combined with clean structure or liquidity concepts (like in Fair Value Gaps Explained), candlesticks become one of the clearest ways to confirm execution.
3. What if two candlestick patterns appear together - which one should I trust?
Trust the one that aligns with direction, momentum, and the higher timeframe bias.
For example:
An engulfing pattern against the trend is weaker
A rejection wick aligned with higher timeframe direction is stronger
This is why multi-timeframe clarity matters, as taught in The Power of Multi-Timeframe Analysis.
4. How do I avoid false signals at key levels?
Wait for confirmation - not just the first candle that touches a level.
Confirmation can be:
A sweep followed by a strong close
A clean engulfing
A breaker candle flipping structure
A retest of the zone
If you want a full confirmation framework, use the structure in The Confirmation Model: OB + FVG + Liquidity Sweep.
5. How do I practice reading candlesticks faster?
Instead of memorizing 30+ patterns, choose one core pattern - such as engulfings or rejection wicks - and mark 30 examples at real levels, as the exercise suggests.
You can speed this up with backtesting software using the **Forex Tester program.**
Repetition builds recognition - which builds confidence.
Start Trading Live!
- Trade forex, indices, gold, and more
- Access ACY, MT4, MT5, & Copy Trading Platforms
It’s time to go from theory to execution!
Create an Account. Start Your Live Trading Now!
Check Out My Contents:
Beginners Path
- Learn Trading From Scratch: Clean, Simple, Zero-Noise
- Introduction to Trading: What Beginners Must Understand
- Choosing Your Trading Market: Forex, Gold, or Indices
- Beginner Trading Strategy: How to Choose One Setup and Commit
- Minimalist Trading Indicators: The Only Tools Beginners Need
Strategies That You Can Use
Looking for step-by-step approaches you can plug straight into the charts? Start here:
- How To Trade & Scalp Indices at the Open Using Smart Money Concepts (SMC)
- How to Trade Breakouts Effectively in Day Trading with Smart Money Concepts
- Complete Step-by-Step Guide to Day Trading Gold (XAU/USD) with Smart Money Concepts (SMC)
- The Power of Multi-Timeframe Analysis in Smart Money Concepts (SMC)
- Forex Trading Strategy for Beginners
- Mastering Candlestick Pattern Analysis with the SMC Strategy for Day Trading
- How to Use Fibonacci to Set Targets & Stops (Complete Guide)
- RSI Divergence Trading Strategy for Gold: How to Identify and Trade Trend Reversals
- Stochastics Trading Secrets: How to Time Entries in Trending Markets using Stochastics
- Gold Trading Stochastics Strategy: How to Trade Gold with 2R - 3R Targets
- RSI Hidden Divergence Explained: How to Spot Trend Continuations Like a Pro
- Moving Averages Trading Strategy Playbook
- Mastering Fibonacci Trading Psychology - Trusting the Levels, Managing the Mind
- Mastering Price Action at Key Levels - How to Spot, Trade, and Win at the Most Crucial Zones
- Mastering Retests: How to Enter with Confirmation After a Breakout
Indicators / Tools for Trading
Sharpen your edge with proven tools and frameworks:
- The Ultimate Guide to Risk Management in Trading - A Complete Compilation for 2026
- Moving Averages Trading Strategy Playbook
- How to Think Like a Price Action Trader
- Mastering Fibonacci Trading Psychology - Trusting the Levels, Managing the Mind
How To Trade News
News moves markets fast. Learn how to keep pace with SMC-based playbooks:
- Why Smart Money Concepts Work in News-Driven Markets - CPI, NFP, and More
- How to Trade NFP Using Smart Money Concepts (SMC) - A Proven Strategy for Forex Traders
- How to Trade CPI Like Smart Money - A Step-by-Step Guide Using SMC
- Learn to Trade News by Backtesting it with Forex Tester
Learn How to Trade US Indices
From NASDAQ opens to DAX trends, here’s how to approach indices like a pro:
- How to Start Trading Indices and Get into the Stock Market with Low Capital (2026 Guide)
- Best Indices to Trade for Day Traders | NASDAQ, S&P 500, DAX + Best Times to Trade Them
- How To Trade & Scalp Indices at the Open Using Smart Money Concepts (SMC)
- NAS100 - How to Trade the Nasdaq Like a Pro (Smart Money Edition)
How to Start Trading Gold
Gold remains one of the most traded assets - here’s how to approach it with confidence:
- How to Swing Trade Gold (XAU/USD) Using Smart Money Concepts: A Simple Guide for Traders
- Complete Step-by-Step Guide to Day Trading Gold (XAU/USD) with Smart Money Concepts (SMC)
- The Ultimate Guide to Backtesting and Trading Gold (XAU/USD) Using Smart Money Concepts (SMC)
- Why Gold Remains the Ultimate Security in a Shifting World
- How to Exit & Take Profits in Trading Gold Like a Pro: Using RSI, Range Breakdowns, and MAs as Your Confluence
- Backtest Gold using Forex Tester Online
How to Trade Japanese Candlesticks
Candlesticks are the building blocks of price action. Master the most powerful ones:
- Mastering the Top Japanese Candlesticks: The Top 5 Candlesticks To Trade + Top SMC Candlestick Pattern
- How to Trade Candlestick Patterns with High Probability: A Complete Guide for Beginners
- The Top Japanese Candlestick Guide: What is an Engulfing Pattern and How to Trade It?
- Piercing Pattern Candlestick Explained: How to Trade It - Step-By-Step Guide
- Morning & Evening Star Candlestick Patterns - How to Trade Market Reversals with Confidence
How to Start Day Trading
Ready to go intraday? Here’s how to build consistency step by step:
- 5 Steps to Start Day Trading: A Strategic Guide for Beginners
- 8 Steps How to Start Forex Day Trading in 2026: A Beginner’s Step-by-Step Guide
- 3 Steps to Build a Trading Routine for Consistency and Discipline - Day Trading Edition
- The Ultimate Guide to Understanding Market Trends and Price Action
- Trading with Momentum: The Best Trading Session to Trade Forex, Gold and Indices
Swing Trading 101
- Introduction to Swing Trading
- The Market Basics for Swing Trading
- Core Principles of Swing Trading
- The Technical Foundations Every Swing Trader Must Master
- Swing Trader’s Toolkit: Multi-Timeframe & Institutional Confluence
- The Psychology of Risk Management in Swing Trading
- Swing Trading Concepts To Know In Trading with Smart Money Concepts
- Becoming a Consistent Swing Trader: Trading Structure & Scaling Strategy
Learn how to navigate yourself in times of turmoil
Markets swing between calm and chaos. Learn to read risk-on vs risk-off like a pro:
- How to Identify Risk-On and Risk-Off Market Sentiment: A Complete Trader’s Guide
- How to Trade Risk-On and Risk-Off Sentiment - With Technical Confirmation
- The Ultimate Guide to Understanding Market Trends and Price Action
- Metals in Risk-On and Risk-Off Environments: How Sentiment Moves Gold and Commodities
Want to learn how to trade like the Smart Money?
Step inside the playbook of institutional traders with SMC concepts explained:
- Why Smart Money Concepts Work: The Truth Behind Liquidity and Price Action
- Mastering the Market with Smart Money Concepts: 5 Strategic Approaches
- Understanding Liquidity Sweep: How Smart Money Trades Liquidity Zones in Forex, Gold, US Indices
- The SMC Playbook Series Part 1: What Moves the Markets? Key Drivers Behind Forex, Gold & Stock Indices
- The SMC Playbook Series Part 2: How to Spot Liquidity Pools in Trading - Internal vs External Liquidity Explained
- Fair Value Gaps Explained: How Smart Money Leaves Footprints in the Market
- Accumulation, Manipulation, Distribution: The Hidden Cycle That Runs Every Market
- Institutional Order Flow - Reading the Market Through the Eyes of the Big Players
- London Session Trading Secrets: How Smart Money Sets the High & Low of the Day
- Mastering the New York Session - Smart Money Concepts Guide
- Anatomy of a Perfect Execution: How SMC Traders Trade with Precision
- Step-by-Step Trading Confirmation Guide for Precise Execution
- Execution Psychology: Turning Hesitation into Confidence
- What Is an Order Block? The Institutional Footprint Explained
- Anatomy of a Valid Order Block in Smart Money Concepts
- How to Draw Order Blocks Accurately - Day Trading Style
- Order Blocks and AMD Market Structure (Smart Money Concepts)
- The Confirmation Model: OB + FVG + Liquidity Sweep (Smart Money Concepts)
Master the World’s Most Popular Forex Pairs
Forex pairs aren’t created equal - some are stable, some are volatile, others tied to commodities or sessions.
- The Top 5 All-Time Best Forex Pairs to Trade
- Top Forex Pairs Beyond the Big Five
- EUR/USD: The King of Forex
- USD/JPY: The Fast Mover
- GBP/USD: The Volatile Cable
- AUD/USD: The Commodity Currency
- USD/CAD: The Oil-Backed Pair
- GBP/JPY: How to Trade The Beast
- Asian & London Session Secrets
- Mastering the New York Session
Metals Trading
- Metals Trading: Why Gold and Metals Are Rising Again
- Silver Trading: The Underdog with Dual Identity
- Gold vs Silver: Institutional Demand Breakdown Explained
- How to Day Trade Silver Like a Pro: Smart Money Tactics for XAG/USD
- Platinum & Palladium: The Quiet Power Duo of Industrial Metals
- How to Trade Metals with SMC and Fundamentals - Gold Trading Strategy
- Metals in Risk-On and Risk-Off Environments: How Sentiment Moves Gold and Commodities
- Future of Metals Market: Gold Forecast 2026 & Long-Term Commodities Outlook
Stop Hunting 101
If you’ve ever been stopped out right before the market reverses - this is why:
- Stop Hunting 101: How Swing Highs and Lows Become Liquidity Traps
- Outsmarting Stop Hunts: The Psychology Behind the Trap
- How to Lessen Risk From Stop Hunts in Trading
- How Stop Hunts Trigger Revenge Trading - Breaking the Pain Cycle
- How to Accept Stop Hunts Without Losing Discipline - Shifting From Frustration to Focus
Trading Psychology
Mindset is the deciding factor between growth and blowups. Explore these essentials:
- The Mental Game of Execution - Debunking the Common Trading Psychology
- Managing Trading Losses: Why You Can Be Wrong and Still Win Big in Trading
- The Hidden Threat in Trading: How Performance Anxiety Sabotages Your Edge
- Why 90% of Retail Traders Fail Even with Profitable Trading Strategies
- Top 10 Habits Profitable Traders Follow Daily to Stay Consistent
- Top 10 Trading Rules of the Most Successful Traders
- Top 10 Ways to Prevent Emotional Trading and Stay Disciplined in the Markets
- Why Most Traders Fail - Trading Psychology & The Hidden Mental Game
- Emotional Awareness in Trading - Naming Your Triggers
- Discipline vs. Impulse in Trading - Step-by Step Guide How to Build Control
- Trading Journal & Reflection - The Trader’s Mirror
- Overcoming FOMO & Revenge Trading in Forex - Why Patience Pays
- Risk of Ruin in Trading - Respect the Math of Survival
- Identity-Based Trading: Become Your Trading System for Consistency
- Trading Psychology: Aligning Emotions with Your System
- Mastering Fear in Trading: Turn Doubt into a Protective Signal
- Mastering Greed in Trading: Turn Ambition into Controlled Growth
- Mastering Boredom in Trading: From Restless Clicking to Patient Precision
- Mastering Doubt in Trading: Building Confidence Through Backtesting and Pattern Recognition
- Mastering Impatience in Trading: Turn Patience Into Profit
- Mastering Frustration in Trading: Turning Losses Into Lessons
- Mastering Hope in Trading: Replacing Denial With Discipline
- When to Quit on Trading - Read This!
- The Math of Compounding in Trading
- Why Daily Wins Matter More Than Big Wins
- Scaling in Trading: When & How to Increase Lot Sizes
- Why Patience in Trading Fuels the Compounding Growth
- Step-by-Step Guide on How to Manage Losses for Compounding Growth
- The Daily Habits of Profitable Traders: Building Your Compounding Routine
- Trading Edge: Definition, Misconceptions & Casino Analogy
- Finding Your Edge: From Chaos to Clarity
- Proving Your Edge: Backtesting Without Bias
- Forward Testing in Trading: How to Prove Your Edge Live
- Measuring Your Edge: Metrics That Matter
- Refining Your Edge: Iteration Without Overfitting
- The EDGE Framework: Knowing When and How to Evolve as a Trader
- Scaling Your Edge: From Small Account to Consistency
- Trading in the Zone: Execution Through Habit and Structure
- Trading in the Zone: Thinking in Probabilities
- The Inner War: Fear, Greed, and the Illusion of Control
- Detachment Discipline in Trading: How to Let Go of the Need to Be Right
- Trading Hack: Why You Keep Breaking Your Own Rules (And How to Stop)
- Trading Mindset Mastery: Building Confidence Through Data
- Flow State Trading: Entering the Zone Through Structure
- Cognitive Traps in Trading: Overconfidence, Recency Bias & Revenge Trades
- The Psychology of Risk in Trading: Fear of Loss vs Fear of Missing Out
- Self-Trust in Trading – Building Confidence from Repetition, Not Just Results
- The Zen of Trading: Becoming the Observer, Not the Reactor
- The Market Is Always Right: Why You Must Adapt, Not Demand
- The Three Stages to Becoming a Consistent Trader
- The Enemy Within: Limiting Beliefs and Emotional Conflict in Trading
- Self-Discipline in Trading: A Skill, Not a Personality Trait
- Mental Energy Management in Trading: Controlling Impulse, Stress, and Overwhelm
- Creating the Disciplined Trader Identity
- The Disciplined Trader: The Complete Blueprint for Consistency
Market Drivers
- Central Banks and Interest Rates: How They Move Your Trades
- Inflation & Economic Data: CPI Trading Strategy and PPI Indicator Guide
- Geopolitical Risks & Safe Havens in Trading (Gold, USD, JPY, CHF)
- Jobs, Growth & Recession Fears: NFP, GDP & Unemployment in Trading
- Commodities & Global Trade: Oil, Gold, and Forex Explained
- Market Correlations & Intermarket Analysis for Traders
Risk Management
The real edge in trading isn’t strategy - it’s how you protect your capital:
- Mastering Risk Management: Stop Loss, Take Profit, and Position Sizing
- Why Risk Management Is the Only Edge That Lasts
- How Much Should You Risk per Trade? (1%, 2%, or Less?)
- The Ultimate Risk Management Plan for Prop Firm Traders - Updated 2026
- Mastering Position Sizing: Automate or Calculate Your Risk Like a Pro
- Martingale Strategy in Trading: Compounding Power or Double-Edged Sword?
- How to Add to Winners Using Cost Averaging and Martingale Principle with Price Confirmation
- Managing Imperfect Entries in Trading - How Professionals Stay Composed
Suggested Learning Path
If you’re not sure where to start, follow this roadmap:
- Start with Trading Psychology → Build the mindset first.
- Move into Risk Management → Learn how to protect capital.
- Explore Strategies & Tools → Candlesticks, Fibonacci, MAs, Indicators.
- Apply to Assets → Gold, Indices, Forex sessions.
- Advance to Smart Money Concepts (SMC) → Learn how institutions trade.
- Specialize → Stop Hunts, News Trading, Turmoil Navigation.
This way, you’ll grow from foundation → application → mastery, instead of jumping around randomly.
Follow me for more daily market insights!
Jasper Osita - LinkedIn - FXStreet - YouTube
This content may have been written by a third party. ACY makes no representation or warranty and assumes no liability as to the accuracy or completeness of the information provided, nor any loss arising from any investment based on a recommendation, forecast or other information supplies by any third-party. This content is information only, and does not constitute financial, investment or other advice on which you can rely.
Try These Next

