Measuring Your Edge: Metrics That Matter
2025-09-23 10:51:02


Every trader wants an edge. But unless you can measure it, you’re guessing. A three-trade win streak can make you feel unstoppable, and a rough Monday can shake your confidence - but neither variance swing tells the truth. The truth lives in your trading metrics: win rate, risk/reward, expectancy, equity curve stability, and drawdowns. Track them well and you’ll see whether your method is healthy and scalable - or fragile and luck-dependent.

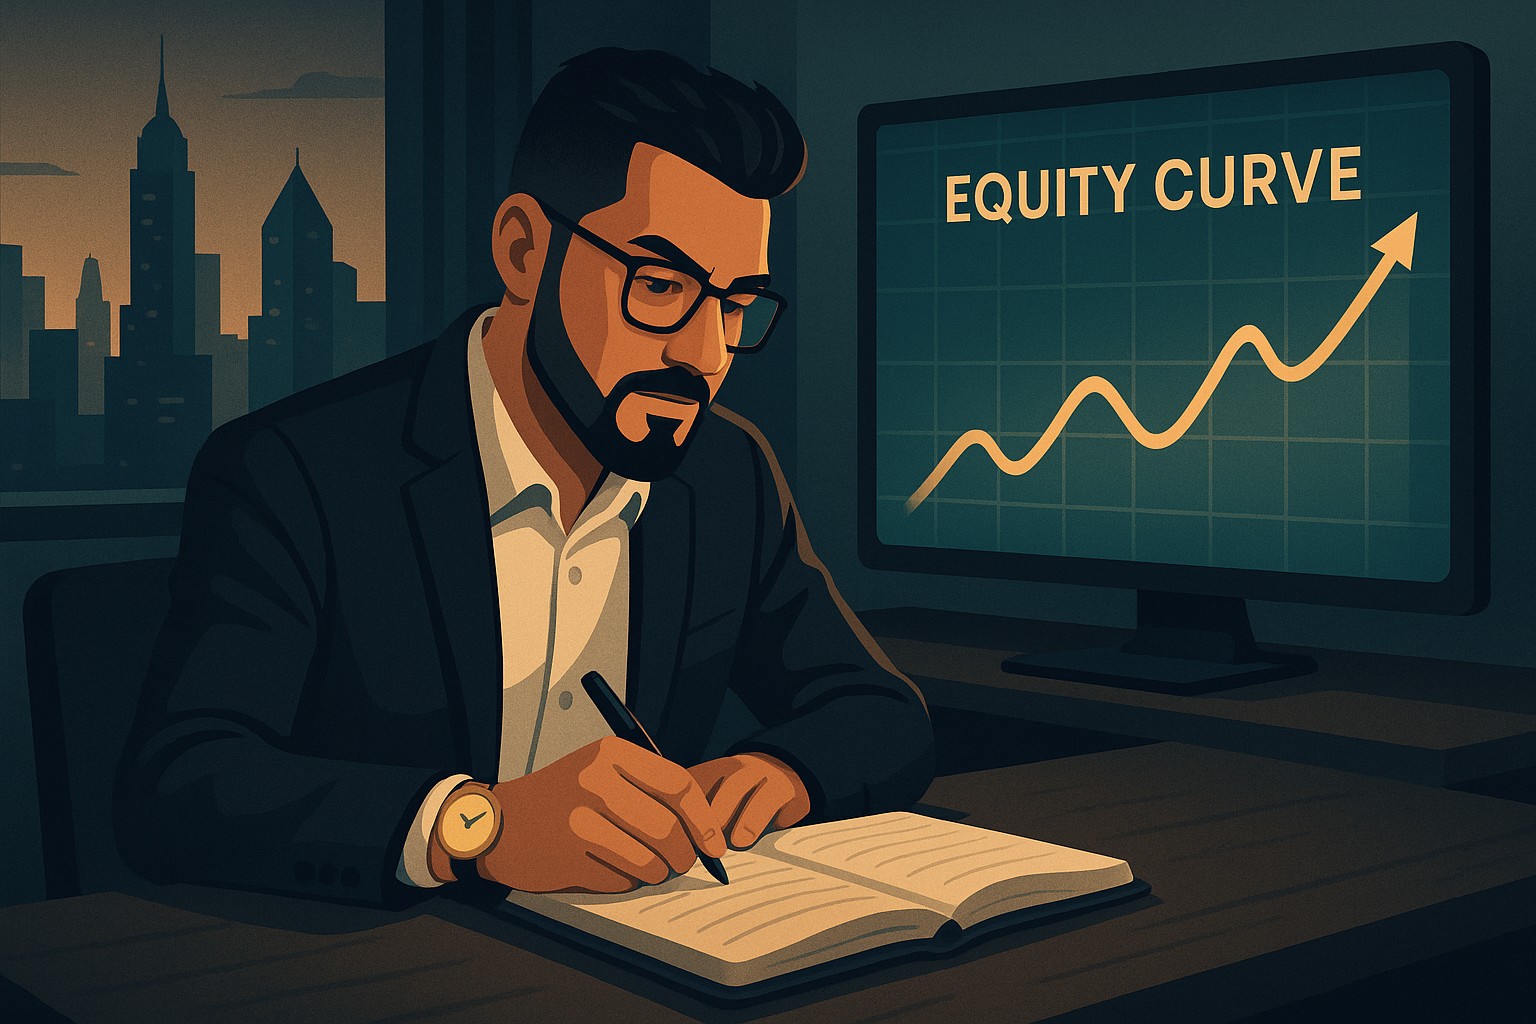
If you’ve never pulled all those vital signs into one place, create a lightweight dashboard (the picture above is an example) and let it summarize your system’s health at a glance. Like a doctor who won’t judge fitness by weight alone, you should never judge your trading by a single stat. The goal is a full diagnostic: several metrics, one coherent story.
Win rate feels good because it’s simple: “I win 60%.” But trading metrics are a package deal. A high win rate paired with tiny average winners and large losing trades can still sink a strategy. Conversely, a 40% win rate can thrive if winners are 2–3× larger than losers. That leverage is encoded in your risk/reward ratio (RRR).
The most honest judge is expectancy - how much you can expect to make on average per trade over a large sample:

If you’re still defining rules and want a clean way to keep bias out of the math, start with my workflow in Proving Your Edge: Backtesting Without Bias. Once the paper test looks solid, validate it in the wild with small size using Forward Testing in Trading. And because many edges are built around liquidity and timing, this primer on why order-flow concepts hold up during catalysts - Why Smart Money Concepts Work in News-Driven Markets - will help you protect RRR without forcing more signals.
Equity Curve Stability and Drawdowns

Expectancy is the engine; your equity curve is the road-trip log. Two systems can post the same total return while feeling completely different to trade. One stair-steps upward with shallow pullbacks; the other ricochets between spikes and slumps. The first is easier to execute - especially under prop-style daily loss limits.
To reduce equity volatility without gutting expectancy, focus on when you trade and how you confirm. If you prefer trend-following confirmation, the Moving Averages Trading Strategy Playbook can help you filter chop so your curve is steadier. If you thrive on session momentum, target the window with the cleanest burst using How To Trade & Scalp Indices at the Open Using SMC.
Drawdowns are the other half of the story. Before you scale size, understand survival math and why a small, consistent risk beats heroics: see Risk of Ruin in Trading.
Trade Like a Doctor (Not a Gambler)

Imagine a physician declaring you “healthy” after seeing only your weight. You’d demand more tests. Trading’s no different:
- Win rate is like weight - a snapshot, not a story.
- Risk/reward is like blood pressure - it frames stress and strain.
- Expectancy is like heart-rate variability - it reveals adaptability over time.
- Equity curve & drawdowns are the treadmill stress test - can you withstand pressure without breaking?
When those vitals agree, you have data-driven conviction. When they diverge, you have a roadmap for improvement. If exits are the weak link, learn to set targets without guesswork in How to Use Fibonacci to Set Targets & Stops or reinforce confirmation timing via Mastering Retests.
And if stop hunts keep enlarging your losers, this field guide - How to Lessen Risk From Stop Hunts in Trading - shows how to position around liquidity instead of becoming it.
Practical Build: Your Metrics Dashboard

Keep it simple and auditable. In one sheet:
- Inputs per trade: date, asset, direction, entry/stop/exit, risk (R), result (R), setup tag, session.
- Auto-calcs: win rate, average win/loss (in R), RRR, expectancy, profit factor, max drawdown, and a rolling equity curve.
- Slices: by day/session (e.g., London vs New York), by setup (breakout, pullback, liquidity sweep), and by market (NAS100, XAUUSD, EURUSD).
Once the picture is clear, optimize one lever at a time. If expectancy is slightly positive but the curve’s too jagged, reduce frequency on low-quality hours. If win rate is fine yet expectancy lags, work on exits; if losers are oversized due to noise, revisit stop placement and confirmation.
Example dashboard: The image above is purely illustrative - use it as inspiration for your own build.
Putting It Together
- Prove expectancy on paper with a bias-free test (Backtesting Without Bias).
- Validate live with small size and strict journaling (Forward Testing in Trading).
- Stabilize execution with a clear session plan - if you trade indices, leverage open-volatility edges (Trade & Scalp Indices at the Open).
- Protect the base with a durable risk framework (Mastering Risk Management: SL/TP/Position Sizing).
- Refine psychology so you can actually follow the plan (start with The Mental Game of Execution).
Final Thoughts
At the end of the day, trading isn’t about chasing wins - it’s about building a repeatable process you can trust. Numbers strip away illusions, exposing whether your edge is real or just a lucky streak.
Think of your metrics as your compass. Expectancy tells you if the journey is worth taking, your equity curve shows how smooth the road will be, and drawdowns reveal the bumps you’ll have to endure. When those three align, you don’t just trade - you trade with confidence.
The picture above is just an example, but the principle is universal: your edge isn’t defined by one stat, one trade, or one week. It’s defined by how consistently you measure, adapt, and protect your capital over time.
Trade like a doctor, not a gambler. Check your vital signs regularly, refine your plan where needed, and let your numbers - not emotions - be the proof that you truly have an edge.
Start Practicing with Confidence - Risk-Free!
- Trade forex, indices, gold, and more
- Access ACY, MT4, MT5, & Copy Trading Platforms
- Practice with zero risk
It’s time to go from theory to execution - risk-free.
Create an Account. Start Your Free Demo!
Check Out My Contents:
Strategies That You Can Use
Looking for step-by-step approaches you can plug straight into the charts? Start here:
- How To Trade & Scalp Indices at the Open Using Smart Money Concepts (SMC)
- How to Trade Breakouts Effectively in Day Trading with Smart Money Concepts
- Complete Step-by-Step Guide to Day Trading Gold (XAU/USD) with Smart Money Concepts (SMC)
- The Power of Multi-Timeframe Analysis in Smart Money Concepts (SMC)
- Forex Trading Strategy for Beginners
- Mastering Candlestick Pattern Analysis with the SMC Strategy for Day Trading
- How to Use Fibonacci to Set Targets & Stops (Complete Guide)
- RSI Divergence Trading Strategy for Gold: How to Identify and Trade Trend Reversals
- Stochastics Trading Secrets: How to Time Entries in Trending Markets using Stochastics
- Gold Trading Stochastics Strategy: How to Trade Gold with 2R - 3R Targets
- RSI Hidden Divergence Explained: How to Spot Trend Continuations Like a Pro
- Moving Averages Trading Strategy Playbook
- Mastering Fibonacci Trading Psychology - Trusting the Levels, Managing the Mind
- Mastering Price Action at Key Levels - How to Spot, Trade, and Win at the Most Crucial Zones
- Mastering Retests: How to Enter with Confirmation After a Breakout
Indicators / Tools for Trading
Sharpen your edge with proven tools and frameworks:
- The Ultimate Guide to Risk Management in Trading - A Complete Compilation for 2026
- Moving Averages Trading Strategy Playbook
- How to Think Like a Price Action Trader
- Mastering Fibonacci Trading Psychology - Trusting the Levels, Managing the Mind
How To Trade News
News moves markets fast. Learn how to keep pace with SMC-based playbooks:
- Why Smart Money Concepts Work in News-Driven Markets - CPI, NFP, and More
- How to Trade NFP Using Smart Money Concepts (SMC)-A Proven Strategy for Forex Traders
- How to Trade CPI Like Smart Money - A Step-by-Step Guide Using SMC
Learn How to Trade US Indices
From NASDAQ opens to DAX trends, here’s how to approach indices like a pro:
- How to Start Trading Indices and Get into the Stock Market with Low Capital (2026 Guide)
- Best Indices to Trade for Day Traders | NASDAQ, S&P 500, DAX + Best Times to Trade Them
- How To Trade & Scalp Indices at the Open Using Smart Money Concepts (SMC)
- NAS100 - How to Trade the Nasdaq Like a Pro (Smart Money Edition)
How to Start Trading Gold
Gold remains one of the most traded assets - - here’s how to approach it with confidence:
- How to Swing Trade Gold (XAU/USD) Using Smart Money Concepts: A Simple Guide for Traders
- Complete Step-by-Step Guide to Day Trading Gold (XAU/USD) with Smart Money Concepts (SMC)
- The Ultimate Guide to Backtesting and Trading Gold (XAU/USD) Using Smart Money Concepts (SMC)
- Why Gold Remains the Ultimate Security in a Shifting World
- How to Exit & Take Profits in Trading Gold Like a Pro: Using RSI, Range Breakdowns, and MAs as Your Confluence
How to Trade Japanese Candlesticks
Candlesticks are the building blocks of price action. Master the most powerful ones:
- Mastering the Top Japanese Candlesticks: The Top 5 Candlesticks To Trade + Top SMC Candlestick Pattern
- How to Trade Candlestick Patterns with High Probability: A Complete Guide for Beginners
- The Top Japanese Candlestick Guide: What is an Engulfing Pattern and How to Trade It?
- Piercing Pattern Candlestick Explained: How to Trade It - Step-By-Step Guide
- Morning & Evening Star Candlestick Patterns - How to Trade Market Reversals with Confidence
How to Start Day Trading
Ready to go intraday? Here’s how to build consistency step by step:
- 5 Steps to Start Day Trading: A Strategic Guide for Beginners
- 8 Steps How to Start Forex Day Trading in 2026: A Beginner’s Step-by-Step Guide
- 3 Steps to Build a Trading Routine for Consistency and Discipline - Day Trading Edition
- The Ultimate Guide to Understanding Market Trends and Price Action
- Trading with Momentum: The Best Trading Session to Trade Forex, Gold and Indices
Learn how to navigate yourself in times of turmoil
Markets swing between calm and chaos. Learn to read risk-on vs risk-off like a pro:
- How to Identify Risk-On and Risk-Off Market Sentiment: A Complete Trader’s Guide
- How to Trade Risk-On and Risk-Off Sentiment - With Technical Confirmation
- The Ultimate Guide to Understanding Market Trends and Price Action
Want to learn how to trade like the Smart Money?
Step inside the playbook of institutional traders with SMC concepts explained:
- Why Smart Money Concepts Work: The Truth Behind Liquidity and Price Action
- Mastering the Market with Smart Money Concepts: 5 Strategic Approaches
- Understanding Liquidity Sweep: How Smart Money Trades Liquidity Zones in Forex, Gold, US Indices
- The SMC Playbook Series Part 1: What Moves the Markets? Key Drivers Behind Forex, Gold & Stock Indices
- The SMC Playbook Series Part 2: How to Spot Liquidity Pools in Trading-Internal vs External Liquidity Explained
- Fair Value Gaps Explained: How Smart Money Leaves Footprints in the Market
- Accumulation, Manipulation, Distribution: The Hidden Cycle That Runs Every Market
- Institutional Order Flow - Reading the Market Through the Eyes of the Big Players
- London Session Trading Secrets: How Smart Money Sets the High & Low of the Day
- Mastering the New York Session - Smart Money Concepts Guide
Master the World’s Most Popular Forex Pairs
Forex pairs aren’t created equal - - some are stable, some are volatile, others tied to commodities or sessions.
- The Top 5 All-Time Best Forex Pairs to Trade
- Top Forex Pairs Beyond the Big Five
- EUR/USD: The King of Forex
- USD/JPY: The Fast Mover
- GBP/USD: The Volatile Cable
- AUD/USD: The Commodity Currency
- USD/CAD: The Oil-Backed Pair
- GBP/JPY: How to Trade The Beast
- Asian & London Session Secrets
- Mastering the New York Session
Stop Hunting 101
If you’ve ever been stopped out right before the market reverses - - this is why:
- Stop Hunting 101: How Swing Highs and Lows Become Liquidity Traps
- Outsmarting Stop Hunts: The Psychology Behind the Trap
- How to Lessen Risk From Stop Hunts in Trading
- How Stop Hunts Trigger Revenge Trading - Breaking the Pain Cycle
- How to Accept Stop Hunts Without Losing Discipline - Shifting From Frustration to Focus
Trading Psychology
Mindset is the deciding factor between growth and blowups. Explore these essentials:
- The Mental Game of Execution - Debunking the Common Trading Psychology
- Managing Trading Losses: Why You Can Be Wrong and Still Win Big in Trading
- The Hidden Threat in Trading: How Performance Anxiety Sabotages Your Edge
- Why 90% of Retail Traders Fail Even with Profitable Trading Strategies
- Top 10 Habits Profitable Traders Follow Daily to Stay Consistent
- Top 10 Trading Rules of the Most Successful Traders
- Top 10 Ways to Prevent Emotional Trading and Stay Disciplined in the Markets
- Why Most Traders Fail - Trading Psychology & The Hidden Mental Game
- Emotional Awareness in Trading - Naming Your Triggers
- Discipline vs. Impulse in Trading - Step-by Step Guide How to Build Control
- Trading Journal & Reflection - The Trader’s Mirror
- Overcoming FOMO & Revenge Trading in Forex - Why Patience Pays
- Risk of Ruin in Trading - Respect the Math of Survival
- Identity-Based Trading: Become Your Trading System for Consistency
- Trading Psychology: Aligning Emotions with Your System
- Mastering Fear in Trading: Turn Doubt into a Protective Signal
- Mastering Greed in Trading: Turn Ambition into Controlled Growth
- Mastering Boredom in Trading: From Restless Clicking to Patient Precision
- Mastering Doubt in Trading: Building Confidence Through Backtesting and Pattern Recognition
- Mastering Impatience in Trading: Turn Patience Into Profit
- Mastering Frustration in Trading: Turning Losses Into Lessons
- Mastering Hope in Trading: Replacing Denial With Discipline
- When to Quit on Trading - Read This!
- The Math of Compounding in Trading
- Why Daily Wins Matter More Than Big Wins
- Scaling in Trading: When & How to Increase Lot Sizes
- Why Patience in Trading Fuels the Compounding Growth
- Step-by-Step Guide on How to Manage Losses for Compounding Growth
- The Daily Habits of Profitable Traders: Building Your Compounding Routine
- Trading Edge: Definition, Misconceptions & Casino Analogy
- Finding Your Edge: From Chaos to Clarity
- Proving Your Edge: Backtesting Without Bias
- Forward Testing in Trading: How to Prove Your Edge Live
Risk Management
The real edge in trading isn’t strategy - it’s how you protect your capital:
- Mastering Risk Management: Stop Loss, Take Profit, and Position Sizing
- Why Risk Management Is the Only Edge That Lasts
- How Much Should You Risk per Trade? (1%, 2%, or Less?)
- The Ultimate Risk Management Plan for Prop Firm Traders - Updated 2026
- Mastering Position Sizing: Automate or Calculate Your Risk Like a Pro
- Martingale Strategy in Trading: Compounding Power or Double-Edged Sword?
- How to Add to Winners Using Cost Averaging and Martingale Principle with Price Confirmation
Suggested Learning Path
If you’re not sure where to start, follow this roadmap:
- Start with Trading Psychology → Build the mindset first.
- Move into Risk Management → Learn how to protect capital.
- Explore Strategies & Tools → Candlesticks, Fibonacci, MAs, Indicators.
- Apply to Assets → Gold, Indices, Forex sessions.
- Advance to Smart Money Concepts (SMC) → Learn how institutions trade.
- Specialize → Stop Hunts, News Trading, Turmoil Navigation.
This way, you’ll grow from foundation → application → mastery, instead of jumping around randomly.
Follow me for more daily market insights!
Jasper Osita - LinkedIn - FXStreet - YouTube
This content may have been written by a third party. ACY makes no representation or warranty and assumes no liability as to the accuracy or completeness of the information provided, nor any loss arising from any investment based on a recommendation, forecast or other information supplies by any third-party. This content is information only, and does not constitute financial, investment or other advice on which you can rely.
Try These Next

