Best Trend Indicators: Top Tools to Trade Trending Markets
2022-04-29 15:00:00


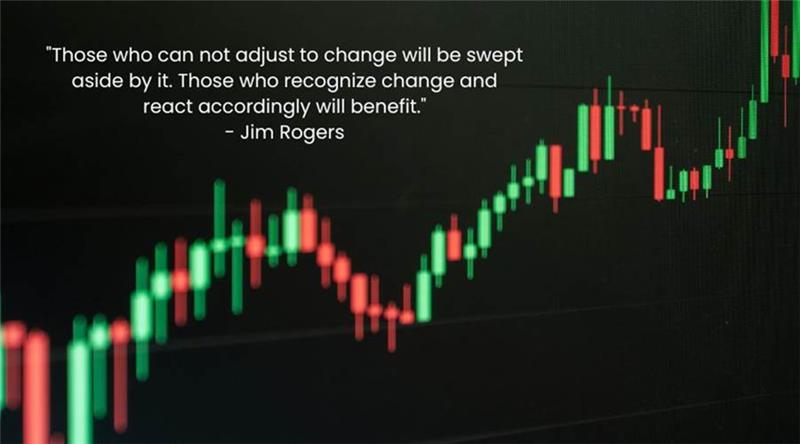
Best Indicators To Use In Trending Markets
Spotting trends early is key to making informed trading decisions. Best trend indicators like EMA, SMA, and the Golden Cross help traders navigate trending markets with confidence.
These indicators used in technical analysis help traders navigate trending markets, price trends and identify potential trend reversals. By using multiple indicators, traders can enhance their market analysis and confirm trend direction more effectively.
Learn how these tools reveal momentum shifts and identify the long-term trends. Discover how to use them effectively and know the current trend.
Understanding Trend Indicators in Financial Markets
Trend indicators are essential tools for traders who seek to measure trend strength, confirm trend direction, and identify potential trading opportunities in the forex markets.
These technical analysis tools provide trend confirmation and allow traders to determine whether the market is trending or moving within a ranging market.
Key Benefits of Using Trend Indicators
- Aid traders in recognising market trends and potential trend changes.
- Provide trading signals based on trend direction.
- Improve market analysis by confirming whether the trend is bullish or bearish.
- Assist in spotting trend shifts before significant price movements.
- Allow traders to analyse market movement with greater precision.
Popular Trend Indicators and How to Use Them
1. Moving Averages (MA)
A moving average smooths out market trends by filtering short-term price fluctuations. It helps traders determine the direction of a trend over a specified period.
- Simple Moving Average (SMA): Measures the average trend over a fixed number of periods.
- Exponential Moving Average (EMA): Places more weight on recent prices to reflect current market trends.
The Gold daily chart below is trading way above its 200-day EMA indicating a very strong bullish trend.

- 30 EMA & 200 EMA: Used to identify trend strength and possible trend reversals.
- Golden Cross & Death Cross: Signals the start of a new trend or a potential trend reversal.
- 200 EMA as Dynamic Support or Resistance: A key level that traders watch for potential trend changes.
2. Moving Average Convergence Divergence (MACD)
The MACD indicator is a widely used momentum indicator that identifies potential trend changes and measures trend shifts.
- MACD Line & Signal Line: The crossover of these lines provides trading signals.
- Histogram: Measures the strength of market movement and indicates trend confirmation.
- Used in conjunction with other indicators for stronger trend detection.
3. Trend Line and Trend Channel
A trend line connects key price points to determine the direction of the trend.
- Upward Trend Line: Connects higher lows in a bullish trend.
- Downward Trend Line: Connects lower highs in a bearish market.
- Trend Channel: Represents the trend detection within a specific price range.
- Breakout Strategy: A strong move beyond the channel signals a potential new trend.
4. Volume Indicators for Trend Confirmation
Trading volume helps confirm whether the trend has strong momentum or if a possible trend reversal is near.
- On-Balance Volume (OBV): Assesses the intensity of buying and selling activity.
- Volume Weighted Average Price (VWAP): Helps traders determine the trend with volume-based analysis.
- Volume Spikes: Often indicate the start of a new trend or trend continuation.
Matching Indicators to Your Trading Style
Different indicators suit different market conditions and trading styles. Some traders prefer lagging and leading indicators to measure trend detection, while others rely on analysis indicators to confirm key trend reversals.
- Trend-following traders: Use moving averages and MACD to identify long-term market trends.
Going back to the Gold daily chart below, the very strong bullish trend is seen by its daily MACD histogram.

- Short-term traders: Prefer momentum indicators and trading volume analysis for quick trades.
- Swing traders: Rely on trend lines and trend channels to capture medium-term trend shifts.
- Breakout traders: Look for trend confirmation using volume indicators and MACD crossovers.
Identifying Trend Reversals with Leading Indicators
While lagging indicators confirm a trend, leading indicators help predict potential trend reversals.
- Relative Strength Index (RSI): Measures momentum and identifies overbought or oversold market conditions.
- Stochastic Oscillator: Helps determine trend strength by comparing closing prices to past movements.
- Average Directional Index (ADX): Indicates whether a trend is bullish or bearish and its overall strength.
Key Takeaways and Next Steps
- Identify the trend using popular trend indicators like EMA, MACD, and trend lines.
- Confirm the trend direction with volume indicators and trend analysis tools.
- Adjust your trading strategy based on market trends and trend shifts.
- Monitor potential trend reversals using leading indicators.
- Enhance your trading with ACY’s technical analysis tools and expert insights.
Understanding trading indicators is essential for navigating financial markets.
Stay ahead by refining your trend analysis techniques and using the right technical indicators to guide your trades. Incorporate these strategies, monitor market conditions, and stay informed to make well-calculated trading decisions in trending markets.
Watch the video below to learn more about the best indicators to use in trending markets.
Using ACY for a Better Trading Experience
Choosing the right broker is crucial for effective trend trading. ACY provides trend traders with advanced technical analysis tools, real-time market trends, and high-speed trade execution.
Benefits of Trading with ACY
- Access to advanced indicators for trending markets.
- Fast order execution for trend-following strategies.
- Low spreads to support trading decisions based on trend analysis.
- Educational resources on trend trading and technical analysis.
- Robust trading platforms equipped with multiple trend indicators.
With ACY, you have access to over 2200 instruments, benefit from lightning-fast execution, and can start your trading journey with as little as $50, choosing between our MT4/MT5 or LogixTrader trading platforms.
Plus, enhance your skills through live weekly trading webinars hosted by our expert team of analysts, or download our latest eBooks here.
Open a live account today and experience the ACY advantage.
Try These Next

