Forex Trading Guide: Mastering Support & Resistance
2023-07-05 17:23:08


Are you an aspiring forex exchange trader looking to navigate the volatile financial market? At ACY Securities, we understand the importance of mastering the skill of identifying support and resistance levels using technical analysis tools. Technical analysis uses mathematical indicators based on historical price data to predict future trends. The underlying principle is that markets exhibit predictable behaviour, and once a trend is established, it often continues in the same direction for a period.
Traders aim to buy when prices are low and sell at a higher price in the future. By conducting technical analysis, traders can identify potential low-price levels. It is important to note that there is no one-size-fits-all approach to technical analysis, as each trader has their own preferred indicators and interpretations. Additionally, it is essential to understand that technical analysis does not provide absolute predictions.
At ACY Securities, we provide valuable resources and insights to help you identify support and resistance levels effectively. In this update, we will explore one of the most widely used and effective technical analysis tools: support and resistance levels. We will discuss various methods for identifying these key levels.
What are Support and Resistance?
Support and resistance zones are fundamental concepts widely utilized in forex and crypto trading, and at ACY Securities, we recognize their significance. Interestingly, there is no universally agreed-upon method for measuring support and resistance levels, as traders often have their own unique approaches.
To understand these concepts, imagine bouncing a ball within your house. The floor and ceiling act as barriers that restrict the ball's movement. Similarly, in trading, support and resistance function as barriers that limit the price action's trajectory.
Price action tends to remember its past, and these trading barriers can have long-lasting effects on an asset. Suppose traders perceive a specific price level as an optimal entry or exit point. In that case, it will likely continue to serve as a significant price barrier until the demands associated with it are fulfilled.
At ACY Securities, we provide valuable insights and resources to help traders effectively identify and navigate support and resistance zones. By understanding these concepts and their impact on price movement, traders can make more informed decisions in the dynamic world of forex trading.

Let us begin by laying the foundation.
Resistance Levels
In the provided illustration, we can see a zigzag pattern that indicates a bullish market or uptrend. This pattern shows how the price of a trading asset rises to a new high and then experiences a pullback. The previous high, known as resistance, acts as a barrier to further upward movement. Resistance levels represent areas where there is an abundance of sellers in the market.
For example, if a particular forex pair is perceived as overvalued, bearish traders will continue selling their holdings to take profits. Moreover, if there is significant selling pressure below a specific price level, investors may engage in short-selling the currency pair. This creates a scenario with limited demand below that price level, leading new investors to enter short positions. The collective selling activity of investors increases the supply of the currency, resulting in a downtrend and driving its price downward.
Understanding resistance levels and the behaviour of sellers is crucial for traders in navigating the forex market and making informed trading decisions. By identifying and analysing these patterns, traders can gain valuable insights into market dynamics and adjust their strategies accordingly.
Support Levels
When the price in the forex market begins to rise again after a pullback, the lowest point reached before the rise will act as support. Support levels indicate areas in the market where there is a significant presence of buyers.
For instance, if a currency pair is considered undervalued, bullish traders will continue buying at that price until their demand is fully absorbed by the market.
Suppose a buyer enters the market at a specific price level (X), and the price of the currency pair rises before retracing back to the same entry price. In that case, the buyer will likely defend their positions at X and may even add to their holdings.
Consequently, new buyers in the forex market will notice that the price does not drop below X, which they interpret as a safe and favourable entry point. The concentration of buyer demand at this level is a barrier, preventing the price from falling further. This creates a temporary floor in the market known as support.
Understanding support levels and buyers' behaviour is crucial for forex traders, as it provides insights into potential entry points and helps manage risk. By recognizing these levels and their significance, traders can make more informed decisions and navigate the forex market with greater confidence.
Identifying Support and Resistance Levels
In the forex market, support and resistance levels are continually established as prices fluctuate. There are various techniques to identify these key levels in the market.
Using Recent Highs and Lows
One of the most widely used methods to spot support and resistance zones is by analysing recent high and low-price points in price action trading. By examining the latest high, traders can determine a level where buying pressure subsided, and selling pressure increased, creating a resistance level.
On the other hand, in the forex market, the immediate low represents a level where selling pressure diminished and buyers gained control. Therefore, when a currency pair revisits the same high and low levels, it is often regarded as a robust support and resistance level.
Trend Indicators - Trend line and Channel
I hope you have already gone through our trading guide on trend lines and channels in the forex market. You may already know these technical tools function as support and resistance levels.
Trend Line: Support and Resistance
A trend in the forex market refers to the prevailing direction of price movement, characterized by a series of higher highs and higher lows in an uptrend or lower lows and lower highs in a downtrend.

During market retracements, price action often finds support and resistance at specific zones before continuing with the subsequent movement, as illustrated above. In a downward or descending trend line, the trend line serves as a resistance zone, while an upward or ascending trend line represents a support zone.
Trend Channel: Support and Resistance
In our trading guide for trend lines and channels in the forex market, we have provided comprehensive insights into how trend channels function as support and resistance lines.
A trend channel consists of two parallel lines drawn based on the highs and lows of price action. It is also known as a price channel, as it encompasses the range within which a currency pair moves.
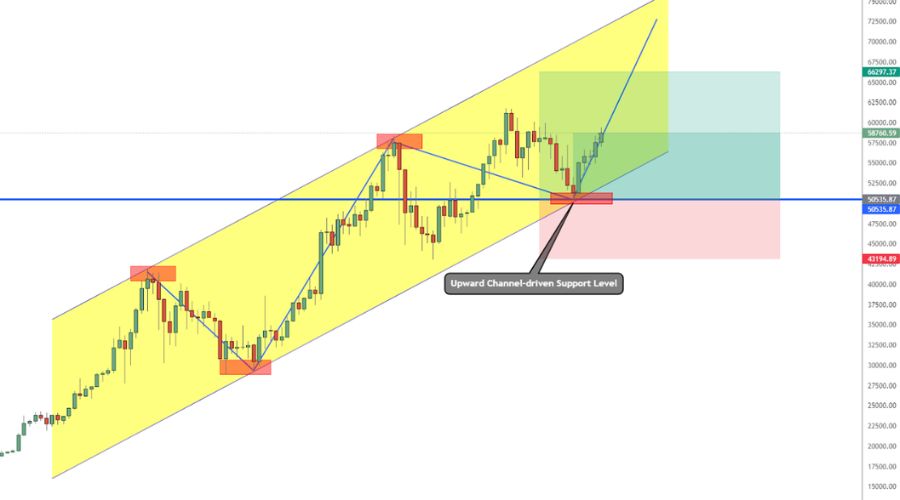
These trend channels serve as significant support and resistance levels, guiding traders in identifying potential entry and exit points in both forex and cryptocurrency trading.
Fibonacci Retracement: Support and Resistance
In forex trading, Fibonacci levels are widely used as support and resistance levels derived from the Fibonacci sequence, which is an infinite sequence of natural numbers. The Fibonacci retracement indicator provides a range of ratios, with key levels including 23.6%, 38.2%, 50%, and 61.8%.

Traders can utilize these Fibonacci lines as potential support and resistance levels based on the prevailing market price of a currency pair.
Trading Strategies for Forex Trading Support and Resistance
Having understood the concept of support and resistance and how to identify them, it is now time to implement these valuable technical indicators in your forex trading. At ACY Securities, we believe in simplicity, so we have categorized the trading strategies for support and resistance into two straightforward concepts:
- Bounce-off
- Breakout
Bounce-off
Trading the bounce-off of support and resistance is a widely used approach in forex trading. Instead of setting buy or sell limits at these levels, traders patiently wait for the market price to test a specific level before entering a trade. It is crucial to confirm the trade setup by observing candlestick closes above the support line or below the resistance line.
For instance, in the EUR/USD chart below, the price of the currency pair dropped to test the support level. Traders should wait for the price to close above the support level before considering a potential bounce-off trade in the EUR/USD.

Similarly, in forex trading, investors look for instances where digital assets are rejected at resistance lines before initiating a trade.

In the provided chart, significant price points of the digital asset were consistently rejected under the downward resistance line. This suggests that shorting the asset would be a favourable trading strategy.
Breakout
In an ideal scenario, support and resistance levels would remain constant, providing forex market participants with ease and profitability. However, the forex market is far from constant, characterized by high volatility and frequent breakouts of support and resistance zones. Hence, forex traders cannot solely rely on bounce-off trading strategies.

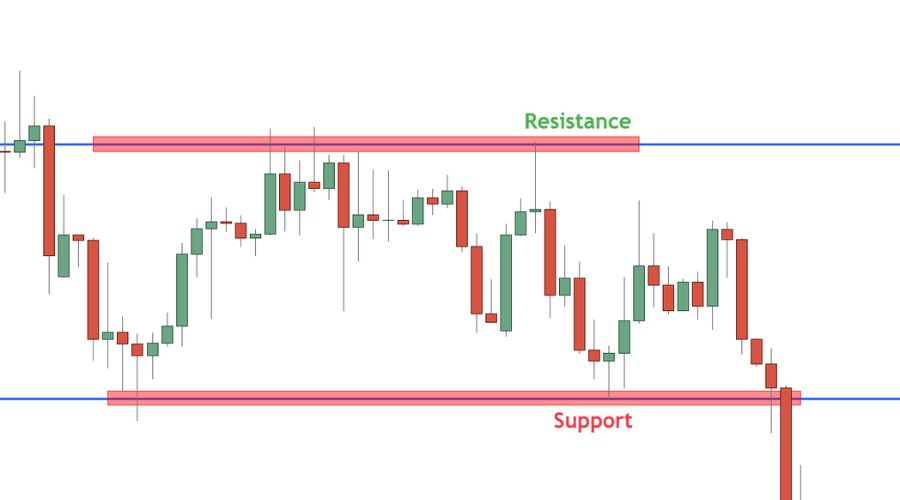
This is where breakout trading around support or resistance areas becomes relevant. The simplest approach to trade breakouts is to patiently wait for the market to break above or below-established support and resistance levels. In the provided chart, the digital asset's price level breaks below a robust support level.
Therefore, if the asset's price closes below the previous support level, it presents a favourable breakout trade opportunity for market participants.
Closing Thoughts
Support and resistance levels are vital in forex trading, regardless of whether you follow a swing or day trading approach. Mastering the concepts of trading support and resistance zones is essential for every investor. Many traders rely heavily on support and resistance as key components of their forex trading strategies. It is crucial to recognize that these zones can be identified using various technical tools, allowing us to trade the market profitably even if we possess knowledge of only one trading strategy among many.
You can learn more about trading in our trading education section.
Try These Next

