Trading Journal Strategy Metrics: How to Measure Setup Quality & System Edge
2025-12-11 13:19:47


A Trading Journal has three major layers:
- Execution Metrics – Did you follow your rules?
- Behavior Metrics – Did your mindset help or sabotage you?
- System Metrics – Does your strategy actually have an edge?
Parts 1 to 4 focused on you - your clarity, your emotions, your biases, your actions.
But Part 5 shifts attention to something equally important:
Is your strategy statistically profitable?
Most traders unknowingly blame themselves for problems that come from one source:
Their system doesn’t have a measurable edge.
They think:
- “Maybe I need more discipline.”
- “Maybe I need better entries.”
- “Maybe I need to stop hesitating.”
But the truth is often simpler:
The system itself is flawed or incomplete - and they never measured it.
To avoid this trap, your Trading Journal must track System Metrics, helping you evaluate:
- Which setups work?
- Which setups fail?
- Which market conditions they work best in?
- How much R each setup produces?
- The consistency of each pattern over time
- Which parts of your strategy need refinement
Think of this part as a strategy audit - similar to what institutional desks do before risking large capital.
To help reinforce these concepts, revisit the following foundational lessons:
- Understanding Liquidity Sweep (SMC)
- The Confirmation Model: OB + FVG + Sweep
- Mastering Price Action at Key Levels
- Anatomy of a Valid Order Block
- The Confirmation Matrix
These concepts form the technical backbone of a measurable system.
Let’s begin the deep dive.
1. Setup Quality Scoring - Grading Your Entries Like a Professional Desk

Before taking a trade, you rank the setup from A+ to C using criteria such as:
- HTF alignment
- Liquidity taken
- Fair Value Gap present
- Structure shift confirmed
- Session timing
- Market volatility condition
- Clean POI
Your Trading Journal must record:
Setup Grade (Before Entry)
How clean the setup appears.
Setup Outcome (After Trade)
How clean the setup really was.
Over 20–50 trades, you will discover:
- A+ trades carry most of your profit
- C setups are responsible for most drawdowns
- Poor-quality trades drain mental capital
- Higher-quality setups have smoother R-distributions
This is the first step in reducing noise from your strategy.
2. Setup Performance Breakdown - Which Patterns Actually Deliver?

Your strategy likely includes several types of entries:
- OB + FVG + Liquidity Sweep
- MSS with FVG retracement
- Asian liquidity grab + NY continuation
- Break-and-retest at key level
- Range deviation reversal
- Trend continuation using dynamic support/resistance
Each setup must be tracked separately with:
- Win rate
- Average R
- Profit factor
- Expectancy
- Best market conditions
- Worst market conditions
After tracking, you often see surprising truths:
- Setup A works only in trending markets
- Setup B works only during specific sessions
- Setup C provides high R but low win rate
- Setup D works best after news
- Setup E fails completely during high volatility periods
This is how professional traders refine their edge - not by guessing, but by measuring.
3. Market Condition Metrics - When Your System Performs Best
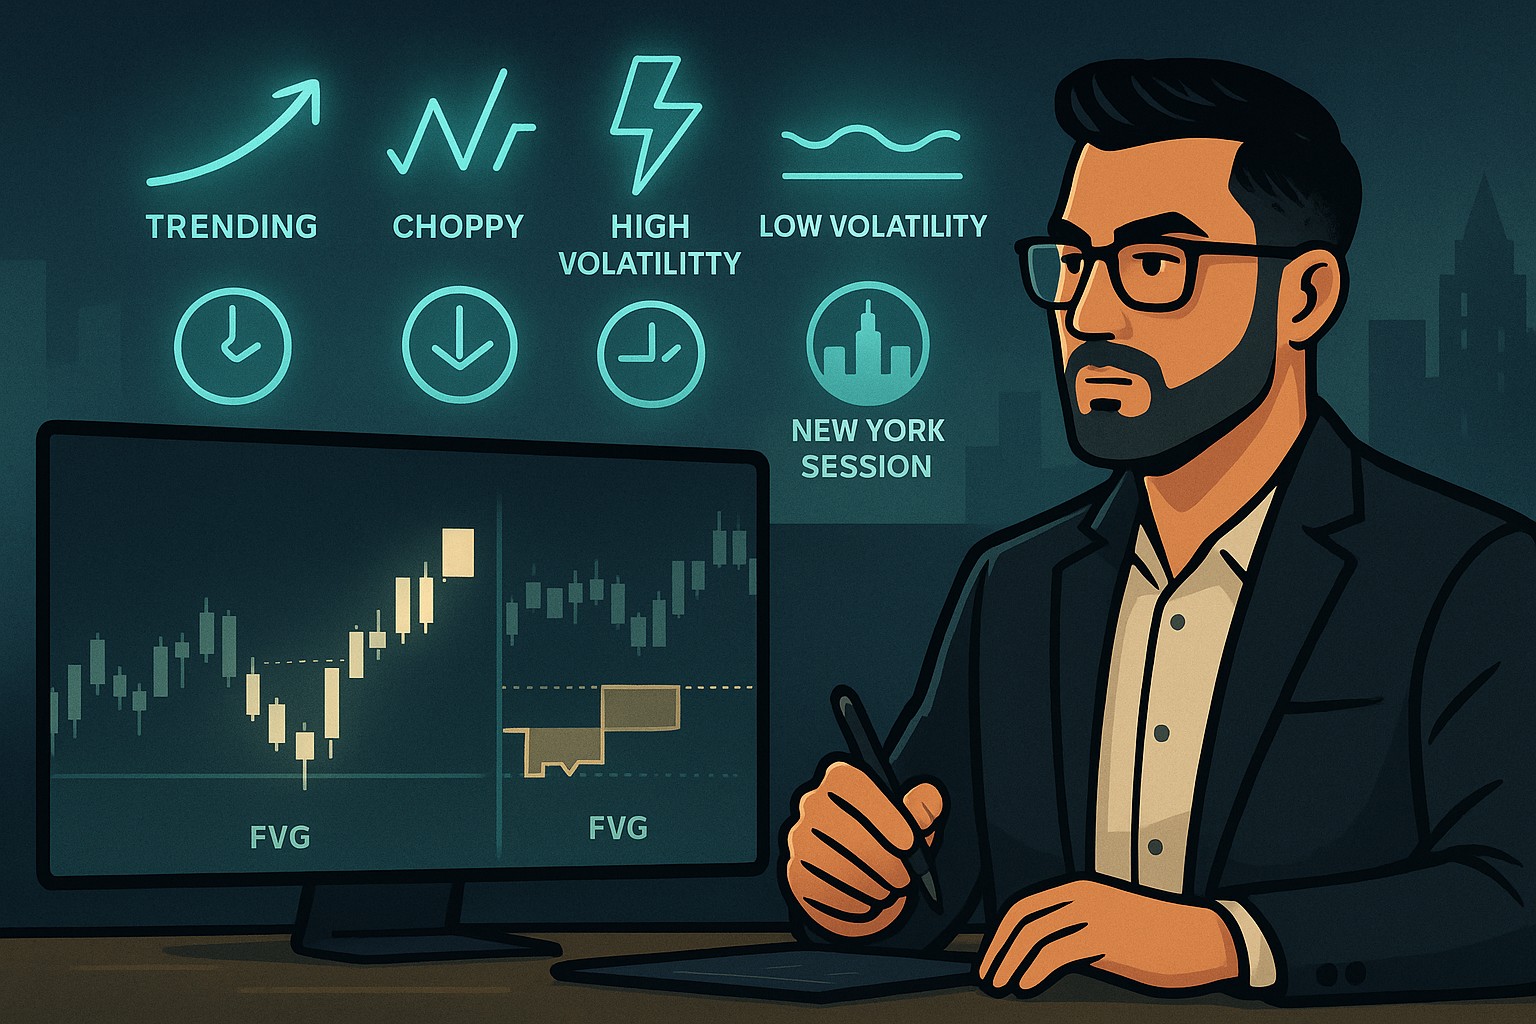
Your setup may not work in all conditions.
Your Trading Journal should include a toggle or tag for:
- Trending
- Choppy
- High volatility
- Low volatility
- Session type (London, NY, Asia)
- Pre-news vs post-news
- HTF premium/discount context
You will soon discover:
- Most strategies fail in chop
- Strong setups work best after liquidity grabs
- Certain pairs behave differently at each session
- NY open favors volatility-based setups
- London favors sweep-and-reverse setups
This aligns with SMC-based session guides such as:
Market conditions matter more than most traders realize.
4. Entry Confirmation Metrics - The Precision Layer

This part tracks whether your setup includes all required confirmations:
Key confirmations to log:
- FVG tap or mitigation
- BOS or MSS
- Liquidity sweep
- Clean order block formation
- Breaker or change of delivery
- Rejection wick confirmation
- Volume spike (optional)
- Session timing alignment
Your Trading Journal should answer:
- Did the setup have all confirmations?
- If not - which ones were missing?
- What is the win rate when confirmations are incomplete?
You will soon find:
Lack of confirmation is the #1 cause of unnecessary losses.
5. Stop-Loss Quality Metrics - Was the SL Placed at a Valid Invalidational Point?
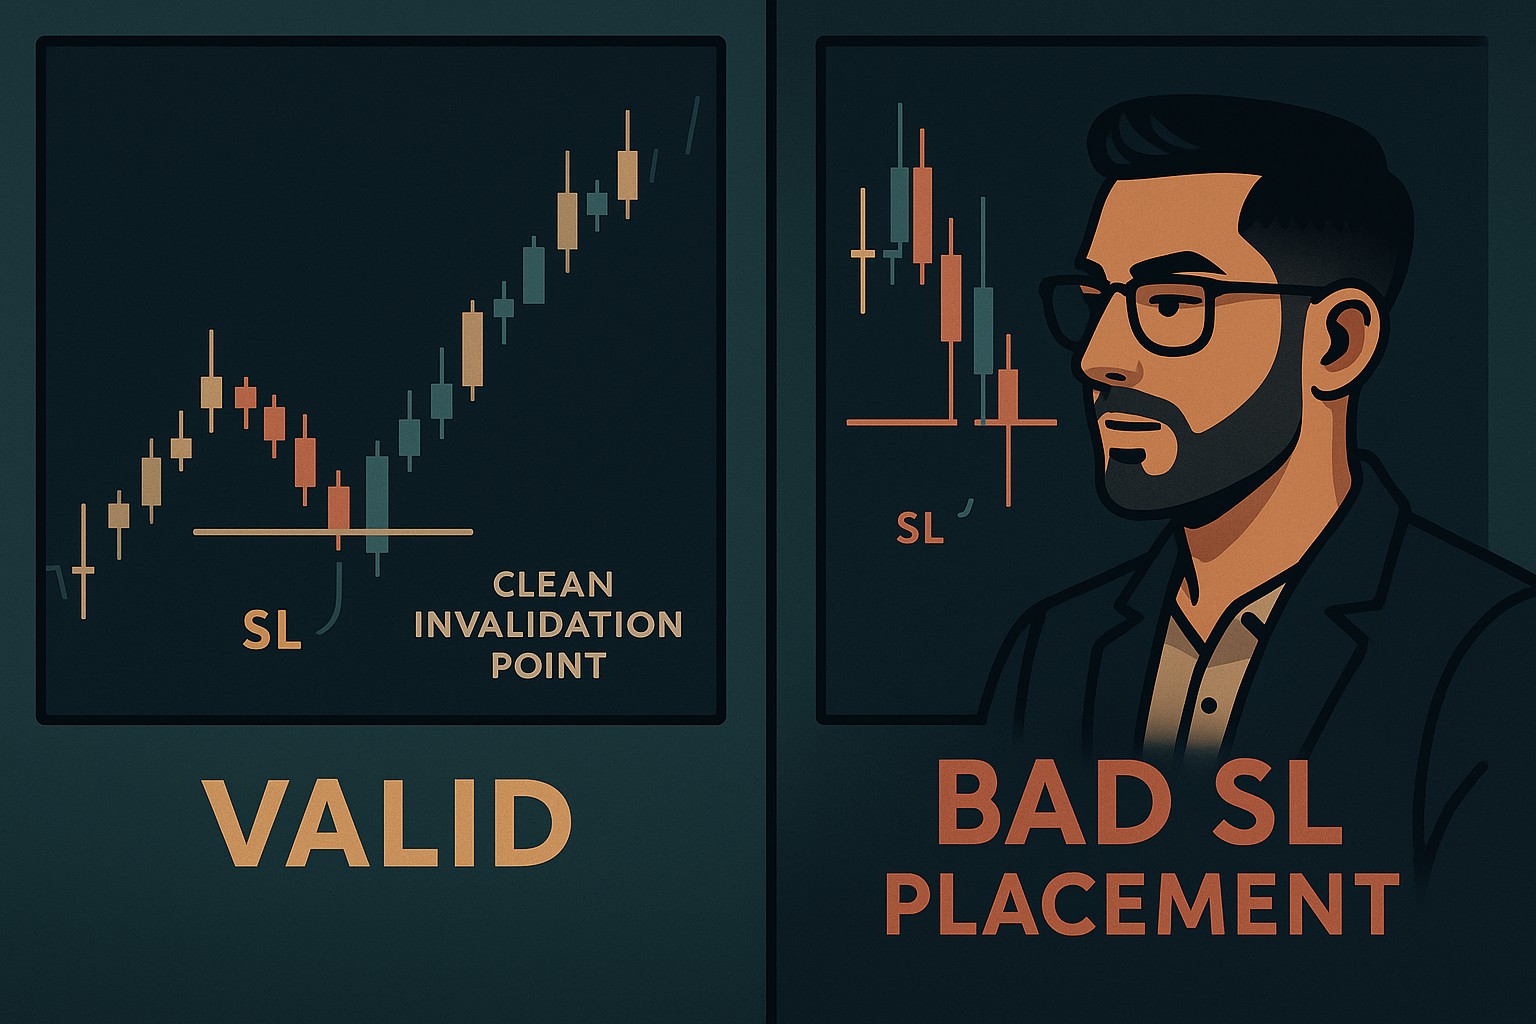
Professionals distinguish between a bad loss and a valid loss.
A valid loss happens when:
- SL was placed at a logical invalidation zone
- System structure was respected
- Market simply didn’t continue
A bad loss happens when:
- SL was too tight
- SL was placed inside the wick zone
- SL wasn’t adjusted to market structure
- The entry itself wasn’t clean
Tracking stop-loss behavior helps you improve R-multiples without changing your strategy.
6. Take-Profit Consistency - Are You Capturing the System’s True Edge?

Some traders have a profitable system but never realize it because:
- They take profits too early
- They ignore structural TP zones
- They get spooked after a loss
- They fail to use HTF target alignment
Your Trading Journal must log:
- TP type (fixed R, HTF level, range deviation, liquidity pool)
- TP consistency score
- Favorable excursion (MFE) vs actual exit
- Whether premature exit reduced profitability
After 30–50 logs, you’ll see the truth:
Your system might be capable of 2R–4R, but you are only capturing 0.8R.
This is where you recover lost edge.
7. System Error Metrics - Failures of the Strategy Itself
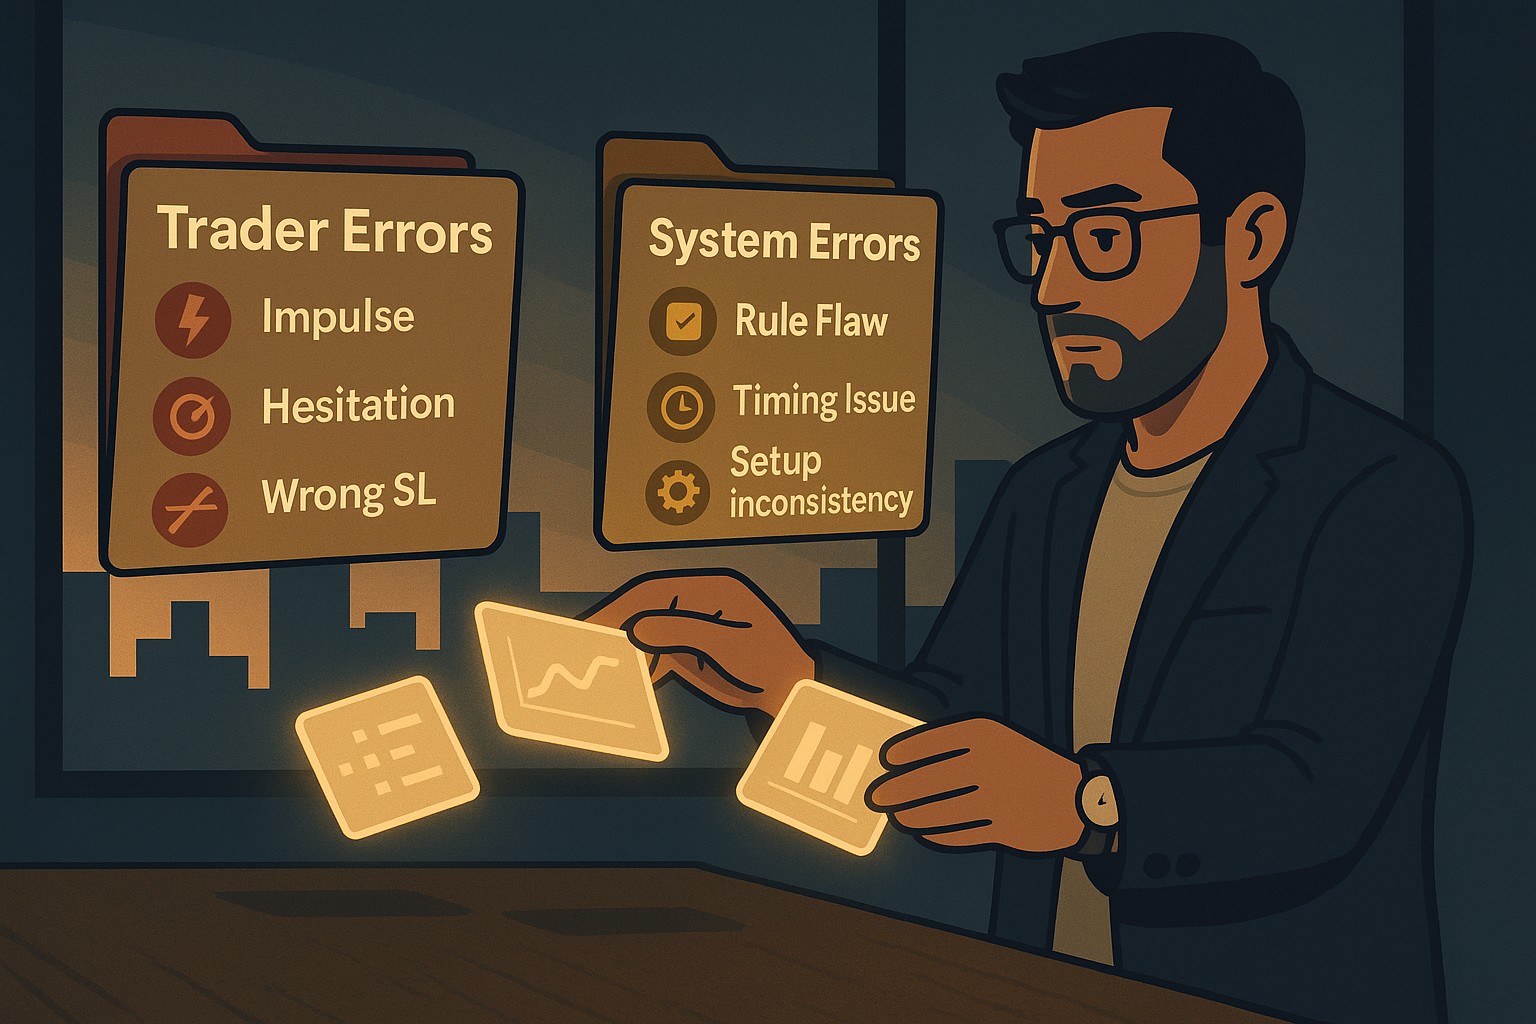
A system error is different from a trader error.
System Error:
The setup met all rules but still fails consistently.
This means the rule itself needs revision.
Examples of system errors:
- FVG retracement fails during high volatility
- OB taps work only when liquidity is taken
- MSS entries fail without time-of-day alignment
- Trend continuation setups fail in discount/premium zones
- Breakouts fail without internal range liquidity sweep
Your Trading Journal must isolate these failures so you can update your rulebook.
This aligns with professional iteration frameworks like:
8. System Evolution Matrix - How Your Strategy Improves Over Time
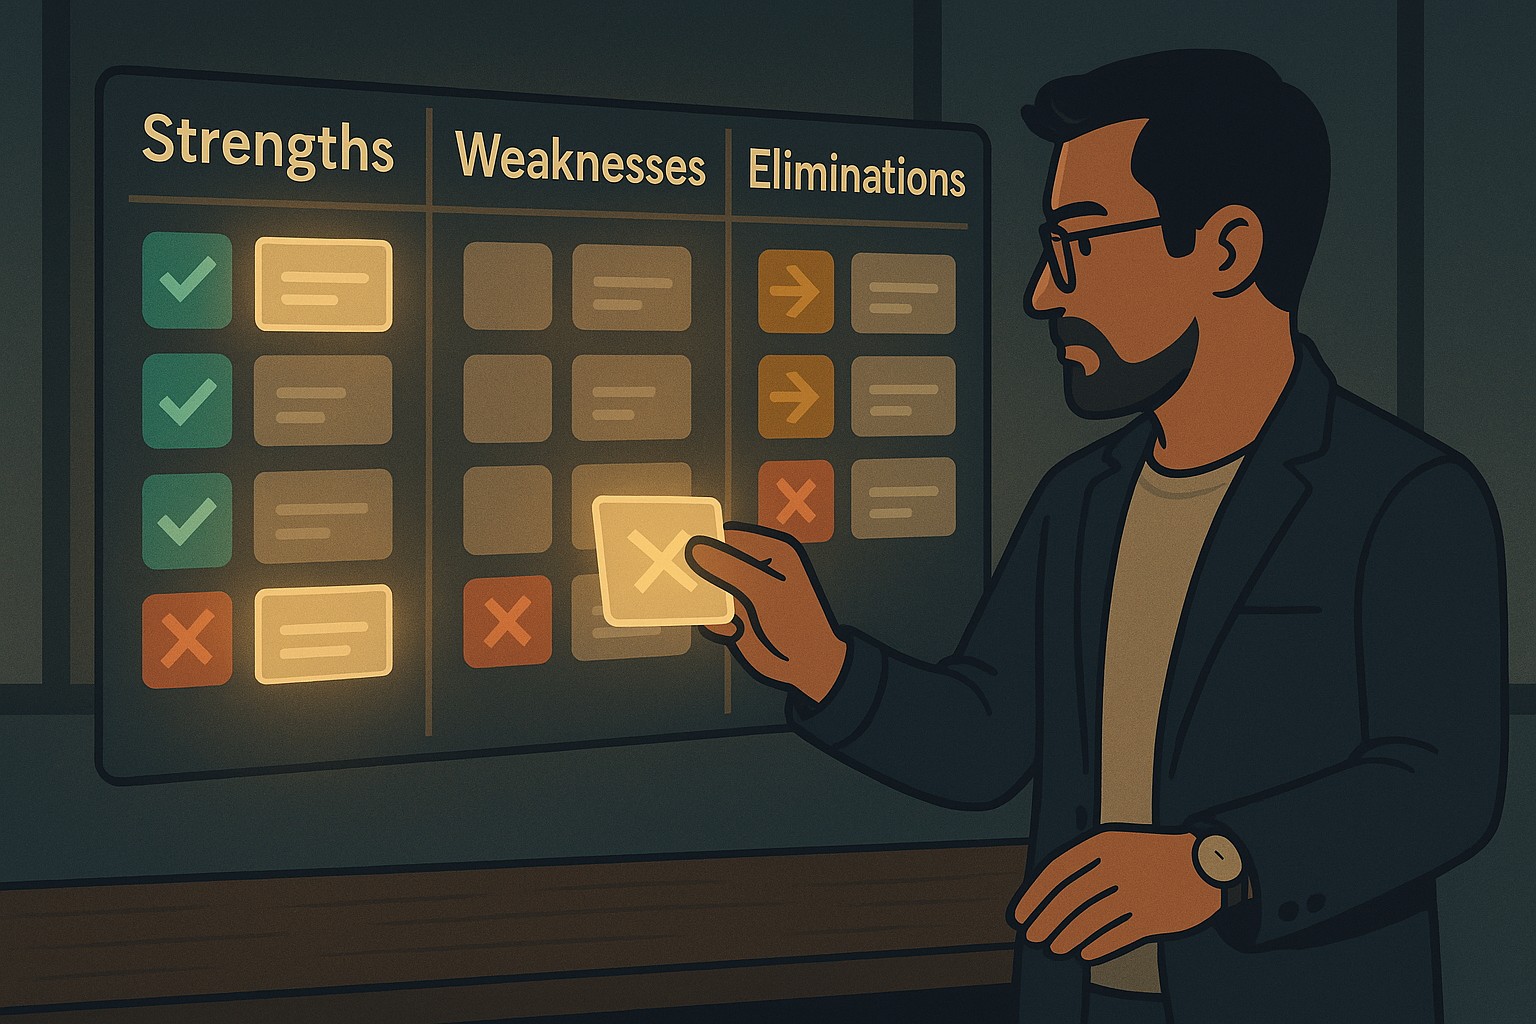
Every month, your Trading Journal should generate:
System Strengths:
What the data proves is working.
System Weaknesses:
Setups or rules that consistently fail.
System Refinements:
New rules, filters, or confirmations to add.
System Eliminations:
Setups or conditions you will stop trading.
System Enhancements:
Add-ons such as Fibonacci alignment, HTF bias filters, or time-based restrictions.
The goal:
Turn your system into something tight, clean, predictable, and high-probability.
The result:
A trading strategy that grows sharper with each month of journaling.
Real-Life Analogy - The Chef That Refines His Recipe

A chef doesn’t ask,
“Did I cook well today?”
He asks:
- Which ingredients worked?
- Which made the dish weaker?
- Was the timing perfect?
- Did the conditions change?
- Which techniques improved the flavor?
Over time, the recipe becomes world-class - not because he cooked more,
but because he measured every detail.
Your strategy works the same way.
The more data you track, the sharper your edge becomes.
Final Thoughts

You cannot improve a system you do not measure.
System metrics turn your journal into a strategy laboratory -
a place where ideas evolve, rules tighten, and your edge becomes something you can trust.
Once your system is measurable, your confidence increases.
Once it becomes repeatable, your consistency increases.
Once it becomes predictable, your profits increase.
This is how professional traders grow.
FAQs
How many trades do I need to measure system performance?
50 is ideal, 20 is the minimum for early insights.
Should I remove setups that don’t perform?
If the data consistently proves they fail - yes.
How do I know if I should adjust the system or my behavior?
If setups fail even when executed perfectly, it’s a system issue - not a behavior issue.
Should system metrics be reviewed daily or weekly?
Weekly for micro-adjustments, monthly for structural updates.
Start Trading Live!
- Trade forex, indices, gold, and more
- Access ACY, MT4, MT5, & Copy Trading Platforms
It’s time to go from theory to execution!
Create an Account. Start Your Live Trading Now!
Check Out My Contents:
Beginners Path
- Learn Trading From Scratch: Clean, Simple, Zero-Noise
- Introduction to Trading: What Beginners Must Understand
- Choosing Your Trading Market: Forex, Gold, or Indices
- Beginner Trading Strategy: How to Choose One Setup and Commit
- Minimalist Trading Indicators: The Only Tools Beginners Need
- Master Candlestick Entries: Reading Price Action at Key Levels
- Backtesting for Traders: How to Build Skill Fast
- Trading Risk Management: The Real Edge Behind Consistency
- Trading Psychology: How to Control Yourself in the Markets
- Daily Trading Routine: Build Consistency and Discipline Fast
- Scenario Planning: Expect Both Sides
- Beginner Trading Master Guide 2026: The Complete Roadmap to Consistency
Strategies That You Can Use
Looking for step-by-step approaches you can plug straight into the charts? Start here:
- How To Trade & Scalp Indices at the Open Using Smart Money Concepts (SMC)
- How to Trade Breakouts Effectively in Day Trading with Smart Money Concepts
- Complete Step-by-Step Guide to Day Trading Gold (XAU/USD) with Smart Money Concepts (SMC)
- The Power of Multi-Timeframe Analysis in Smart Money Concepts (SMC)
- Forex Trading Strategy for Beginners
- Mastering Candlestick Pattern Analysis with the SMC Strategy for Day Trading
- How to Use Fibonacci to Set Targets & Stops (Complete Guide)
- RSI Divergence Trading Strategy for Gold: How to Identify and Trade Trend Reversals
- Stochastics Trading Secrets: How to Time Entries in Trending Markets using Stochastics
- Gold Trading Stochastics Strategy: How to Trade Gold with 2R - 3R Targets
- RSI Hidden Divergence Explained: How to Spot Trend Continuations Like a Pro
- Moving Averages Trading Strategy Playbook
- Mastering Fibonacci Trading Psychology - Trusting the Levels, Managing the Mind
- Mastering Price Action at Key Levels - How to Spot, Trade, and Win at the Most Crucial Zones
- Mastering Retests: How to Enter with Confirmation After a Breakout
Indicators / Tools for Trading
Sharpen your edge with proven tools and frameworks:
- The Ultimate Guide to Risk Management in Trading - A Complete Compilation for 2026
- Moving Averages Trading Strategy Playbook
- How to Think Like a Price Action Trader
- Mastering Fibonacci Trading Psychology - Trusting the Levels, Managing the Mind
How To Trade News
News moves markets fast. Learn how to keep pace with SMC-based playbooks:
- Why Smart Money Concepts Work in News-Driven Markets - CPI, NFP, and More
- How to Trade NFP Using Smart Money Concepts (SMC) - A Proven Strategy for Forex Traders
- How to Trade CPI Like Smart Money - A Step-by-Step Guide Using SMC
- Learn to Trade News by Backtesting it with Forex Tester
Learn How to Trade US Indices
From NASDAQ opens to DAX trends, here’s how to approach indices like a pro:
- How to Start Trading Indices and Get into the Stock Market with Low Capital (2026 Guide)
- Best Indices to Trade for Day Traders | NASDAQ, S&P 500, DAX + Best Times to Trade Them
- How To Trade & Scalp Indices at the Open Using Smart Money Concepts (SMC)
- NAS100 - How to Trade the Nasdaq Like a Pro (Smart Money Edition)
How to Start Trading Gold
Gold remains one of the most traded assets - here’s how to approach it with confidence:
- How to Swing Trade Gold (XAU/USD) Using Smart Money Concepts: A Simple Guide for Traders
- Complete Step-by-Step Guide to Day Trading Gold (XAU/USD) with Smart Money Concepts (SMC)
- The Ultimate Guide to Backtesting and Trading Gold (XAU/USD) Using Smart Money Concepts (SMC)
- Why Gold Remains the Ultimate Security in a Shifting World
- How to Exit & Take Profits in Trading Gold Like a Pro: Using RSI, Range Breakdowns, and MAs as Your Confluence
- Backtest Gold using Forex Tester Online
How to Trade Japanese Candlesticks
Candlesticks are the building blocks of price action. Master the most powerful ones:
- Mastering the Top Japanese Candlesticks: The Top 5 Candlesticks To Trade + Top SMC Candlestick Pattern
- How to Trade Candlestick Patterns with High Probability: A Complete Guide for Beginners
- The Top Japanese Candlestick Guide: What is an Engulfing Pattern and How to Trade It?
- Piercing Pattern Candlestick Explained: How to Trade It - Step-By-Step Guide
- Morning & Evening Star Candlestick Patterns - How to Trade Market Reversals with Confidence
How to Start Day Trading
Ready to go intraday? Here’s how to build consistency step by step:
- 5 Steps to Start Day Trading: A Strategic Guide for Beginners
- 8 Steps How to Start Forex Day Trading in 2026: A Beginner’s Step-by-Step Guide
- 3 Steps to Build a Trading Routine for Consistency and Discipline - Day Trading Edition
- The Ultimate Guide to Understanding Market Trends and Price Action
- Trading with Momentum: The Best Trading Session to Trade Forex, Gold and Indices
Swing Trading 101
- Introduction to Swing Trading
- The Market Basics for Swing Trading
- Core Principles of Swing Trading
- The Technical Foundations Every Swing Trader Must Master
- Swing Trader’s Toolkit: Multi-Timeframe & Institutional Confluence
- The Psychology of Risk Management in Swing Trading
- Swing Trading Concepts To Know In Trading with Smart Money Concepts
- Becoming a Consistent Swing Trader: Trading Structure & Scaling Strategy
Learn how to navigate yourself in times of turmoil
Markets swing between calm and chaos. Learn to read risk-on vs risk-off like a pro:
- How to Identify Risk-On and Risk-Off Market Sentiment: A Complete Trader’s Guide
- How to Trade Risk-On and Risk-Off Sentiment - With Technical Confirmation
- The Ultimate Guide to Understanding Market Trends and Price Action
- Metals in Risk-On and Risk-Off Environments: How Sentiment Moves Gold and Commodities
Want to learn how to trade like the Smart Money?
Step inside the playbook of institutional traders with SMC concepts explained:
- Why Smart Money Concepts Work: The Truth Behind Liquidity and Price Action
- Mastering the Market with Smart Money Concepts: 5 Strategic Approaches
- Understanding Liquidity Sweep: How Smart Money Trades Liquidity Zones in Forex, Gold, US Indices
- The SMC Playbook Series Part 1: What Moves the Markets? Key Drivers Behind Forex, Gold & Stock Indices
- The SMC Playbook Series Part 2: How to Spot Liquidity Pools in Trading - Internal vs External Liquidity Explained
- Fair Value Gaps Explained: How Smart Money Leaves Footprints in the Market
- Accumulation, Manipulation, Distribution: The Hidden Cycle That Runs Every Market
- Institutional Order Flow - Reading the Market Through the Eyes of the Big Players
- London Session Trading Secrets: How Smart Money Sets the High & Low of the Day
- Mastering the New York Session - Smart Money Concepts Guide
- Anatomy of a Perfect Execution: How SMC Traders Trade with Precision
- Step-by-Step Trading Confirmation Guide for Precise Execution
- Execution Psychology: Turning Hesitation into Confidence
- What Is an Order Block? The Institutional Footprint Explained
- Anatomy of a Valid Order Block in Smart Money Concepts
- How to Draw Order Blocks Accurately - Day Trading Style
- Order Blocks and AMD Market Structure (Smart Money Concepts)
- The Confirmation Model: OB + FVG + Liquidity Sweep (Smart Money Concepts)
Master the World’s Most Popular Forex Pairs
Forex pairs aren’t created equal - some are stable, some are volatile, others tied to commodities or sessions.
- The Top 5 All-Time Best Forex Pairs to Trade
- Top Forex Pairs Beyond the Big Five
- EUR/USD: The King of Forex
- USD/JPY: The Fast Mover
- GBP/USD: The Volatile Cable
- AUD/USD: The Commodity Currency
- USD/CAD: The Oil-Backed Pair
- GBP/JPY: How to Trade The Beast
- Asian & London Session Secrets
- Mastering the New York Session
Metals Trading
- Metals Trading: Why Gold and Metals Are Rising Again
- Silver Trading: The Underdog with Dual Identity
- Gold vs Silver: Institutional Demand Breakdown Explained
- How to Day Trade Silver Like a Pro: Smart Money Tactics for XAG/USD
- Platinum & Palladium: The Quiet Power Duo of Industrial Metals
- How to Trade Metals with SMC and Fundamentals - Gold Trading Strategy
- Metals in Risk-On and Risk-Off Environments: How Sentiment Moves Gold and Commodities
- Future of Metals Market: Gold Forecast 2026 & Long-Term Commodities Outlook
Stop Hunting 101
If you’ve ever been stopped out right before the market reverses - this is why:
- Stop Hunting 101: How Swing Highs and Lows Become Liquidity Traps
- Outsmarting Stop Hunts: The Psychology Behind the Trap
- How to Lessen Risk From Stop Hunts in Trading
- How Stop Hunts Trigger Revenge Trading - Breaking the Pain Cycle
- How to Accept Stop Hunts Without Losing Discipline - Shifting From Frustration to Focus
Trading Psychology
Mindset is the deciding factor between growth and blowups. Explore these essentials:
- The Mental Game of Execution - Debunking the Common Trading Psychology
- Managing Trading Losses: Why You Can Be Wrong and Still Win Big in Trading
- The Hidden Threat in Trading: How Performance Anxiety Sabotages Your Edge
- Why 90% of Retail Traders Fail Even with Profitable Trading Strategies
- Top 10 Habits Profitable Traders Follow Daily to Stay Consistent
- Top 10 Trading Rules of the Most Successful Traders
- Top 10 Ways to Prevent Emotional Trading and Stay Disciplined in the Markets
- Why Most Traders Fail - Trading Psychology & The Hidden Mental Game
- Emotional Awareness in Trading - Naming Your Triggers
- Discipline vs. Impulse in Trading - Step-by Step Guide How to Build Control
- Trading Journal & Reflection - The Trader’s Mirror
- Overcoming FOMO & Revenge Trading in Forex - Why Patience Pays
- Risk of Ruin in Trading - Respect the Math of Survival
- Identity-Based Trading: Become Your Trading System for Consistency
- Trading Psychology: Aligning Emotions with Your System
- Mastering Fear in Trading: Turn Doubt into a Protective Signal
- Mastering Greed in Trading: Turn Ambition into Controlled Growth
- Mastering Boredom in Trading: From Restless Clicking to Patient Precision
- Mastering Doubt in Trading: Building Confidence Through Backtesting and Pattern Recognition
- Mastering Impatience in Trading: Turn Patience Into Profit
- Mastering Frustration in Trading: Turning Losses Into Lessons
- Mastering Hope in Trading: Replacing Denial With Discipline
- When to Quit on Trading - Read This!
- The Math of Compounding in Trading
- Why Daily Wins Matter More Than Big Wins
- Scaling in Trading: When & How to Increase Lot Sizes
- Why Patience in Trading Fuels the Compounding Growth
- Step-by-Step Guide on How to Manage Losses for Compounding Growth
- The Daily Habits of Profitable Traders: Building Your Compounding Routine
- Trading Edge: Definition, Misconceptions & Casino Analogy
- Finding Your Edge: From Chaos to Clarity
- Proving Your Edge: Backtesting Without Bias
- Forward Testing in Trading: How to Prove Your Edge Live
- Measuring Your Edge: Metrics That Matter
- Refining Your Edge: Iteration Without Overfitting
- The EDGE Framework: Knowing When and How to Evolve as a Trader
- Scaling Your Edge: From Small Account to Consistency
- Trading in the Zone: Execution Through Habit and Structure
- Trading in the Zone: Thinking in Probabilities
- The Inner War: Fear, Greed, and the Illusion of Control
- Detachment Discipline in Trading: How to Let Go of the Need to Be Right
- Trading Hack: Why You Keep Breaking Your Own Rules (And How to Stop)
- Trading Mindset Mastery: Building Confidence Through Data
- Flow State Trading: Entering the Zone Through Structure
- Cognitive Traps in Trading: Overconfidence, Recency Bias & Revenge Trades
- The Psychology of Risk in Trading: Fear of Loss vs Fear of Missing Out
- Self-Trust in Trading – Building Confidence from Repetition, Not Just Results
- The Zen of Trading: Becoming the Observer, Not the Reactor
- The Market Is Always Right: Why You Must Adapt, Not Demand
- The Three Stages to Becoming a Consistent Trader
- The Enemy Within: Limiting Beliefs and Emotional Conflict in Trading
- Self-Discipline in Trading: A Skill, Not a Personality Trait
- Mental Energy Management in Trading: Controlling Impulse, Stress, and Overwhelm
- Creating the Disciplined Trader Identity
- The Disciplined Trader: The Complete Blueprint for Consistency
Market Drivers
- Central Banks and Interest Rates: How They Move Your Trades
- Inflation & Economic Data: CPI Trading Strategy and PPI Indicator Guide
- Geopolitical Risks & Safe Havens in Trading (Gold, USD, JPY, CHF)
- Jobs, Growth & Recession Fears: NFP, GDP & Unemployment in Trading
- Commodities & Global Trade: Oil, Gold, and Forex Explained
- Market Correlations & Intermarket Analysis for Traders
Risk Management
The real edge in trading isn’t strategy - it’s how you protect your capital:
- Mastering Risk Management: Stop Loss, Take Profit, and Position Sizing
- Why Risk Management Is the Only Edge That Lasts
- How Much Should You Risk per Trade? (1%, 2%, or Less?)
- The Ultimate Risk Management Plan for Prop Firm Traders - Updated 2026
- Mastering Position Sizing: Automate or Calculate Your Risk Like a Pro
- Martingale Strategy in Trading: Compounding Power or Double-Edged Sword?
- How to Add to Winners Using Cost Averaging and Martingale Principle with Price Confirmation
- Managing Imperfect Entries in Trading - How Professionals Stay Composed
Suggested Learning Path
If you’re not sure where to start, follow this roadmap:
- Start with Trading Psychology → Build the mindset first.
- Move into Risk Management → Learn how to protect capital.
- Explore Strategies & Tools → Candlesticks, Fibonacci, MAs, Indicators.
- Apply to Assets → Gold, Indices, Forex sessions.
- Advance to Smart Money Concepts (SMC) → Learn how institutions trade.
- Specialize → Stop Hunts, News Trading, Turmoil Navigation.
This way, you’ll grow from foundation → application → mastery, instead of jumping around randomly.
Follow me for more daily market insights!
Jasper Osita - LinkedIn - FXStreet - YouTube
This content may have been written by a third party. ACY makes no representation or warranty and assumes no liability as to the accuracy or completeness of the information provided, nor any loss arising from any investment based on a recommendation, forecast or other information supplies by any third-party. This content is information only, and does not constitute financial, investment or other advice on which you can rely.
Try These Next

