How to Trade Trending Markets Using Moving Averages and RSI Confluence
2025-07-24 12:14:02


Goal of This Lesson
To help you trade strong market trends with more confidence and clarity — by using moving averages to find direction and RSI to confirm momentum strength before you enter.
Real-Life Analogy: A Car Accelerating on a Highway

Imagine you're driving on the highway.
- The lane markers are your moving averages — keeping you aligned in the right direction.
- Your speedometer is the RSI — telling you how much power the car (price) has at the moment.
- The moment you press the gas and accelerate smoothly is your price action confirmation — a sign it’s time to go with the flow.
You don’t accelerate in a traffic jam (sideways markets), and you don’t blindly press the gas if your engine (momentum) is weak.
You wait for the road to open (trend) and the power to kick in (RSI), then go full throttle (entry).
Why This Works So Well in Trending Markets
| Tool | What It Does |
|---|---|
| 20 EMA / 50 SMA | Identify trend direction and pullback zones |
| RSI (14) | Measures momentum strength in the trend |
When both tools point in the same direction, you have confluence — and higher probability setups.
How to Trade Momentum Using RSI
Most traders misuse RSI. They buy when it’s “oversold” or sell when it’s “overbought.” But in trend trading, we do the opposite.
RSI in Trending Markets:
| Market Trend | What RSI Should Do |
|---|---|
| Uptrend | RSI stays above 50 and makes higher lows |
| Downtrend | RSI stays below 50 and makes lower highs |
Key Insight:
- In uptrends, RSI > 50 = strong buyers still in control.
- In downtrends, RSI < 50 = sellers still dominate.
If RSI starts dropping below 50 in an uptrend → momentum is fading
If RSI starts rising above 50 in a downtrend → trend might reverse
Use this RSI 50 “midline” as your trend confirmation filter.
Step-by-Step Strategy for MA + RSI Trend Confluence
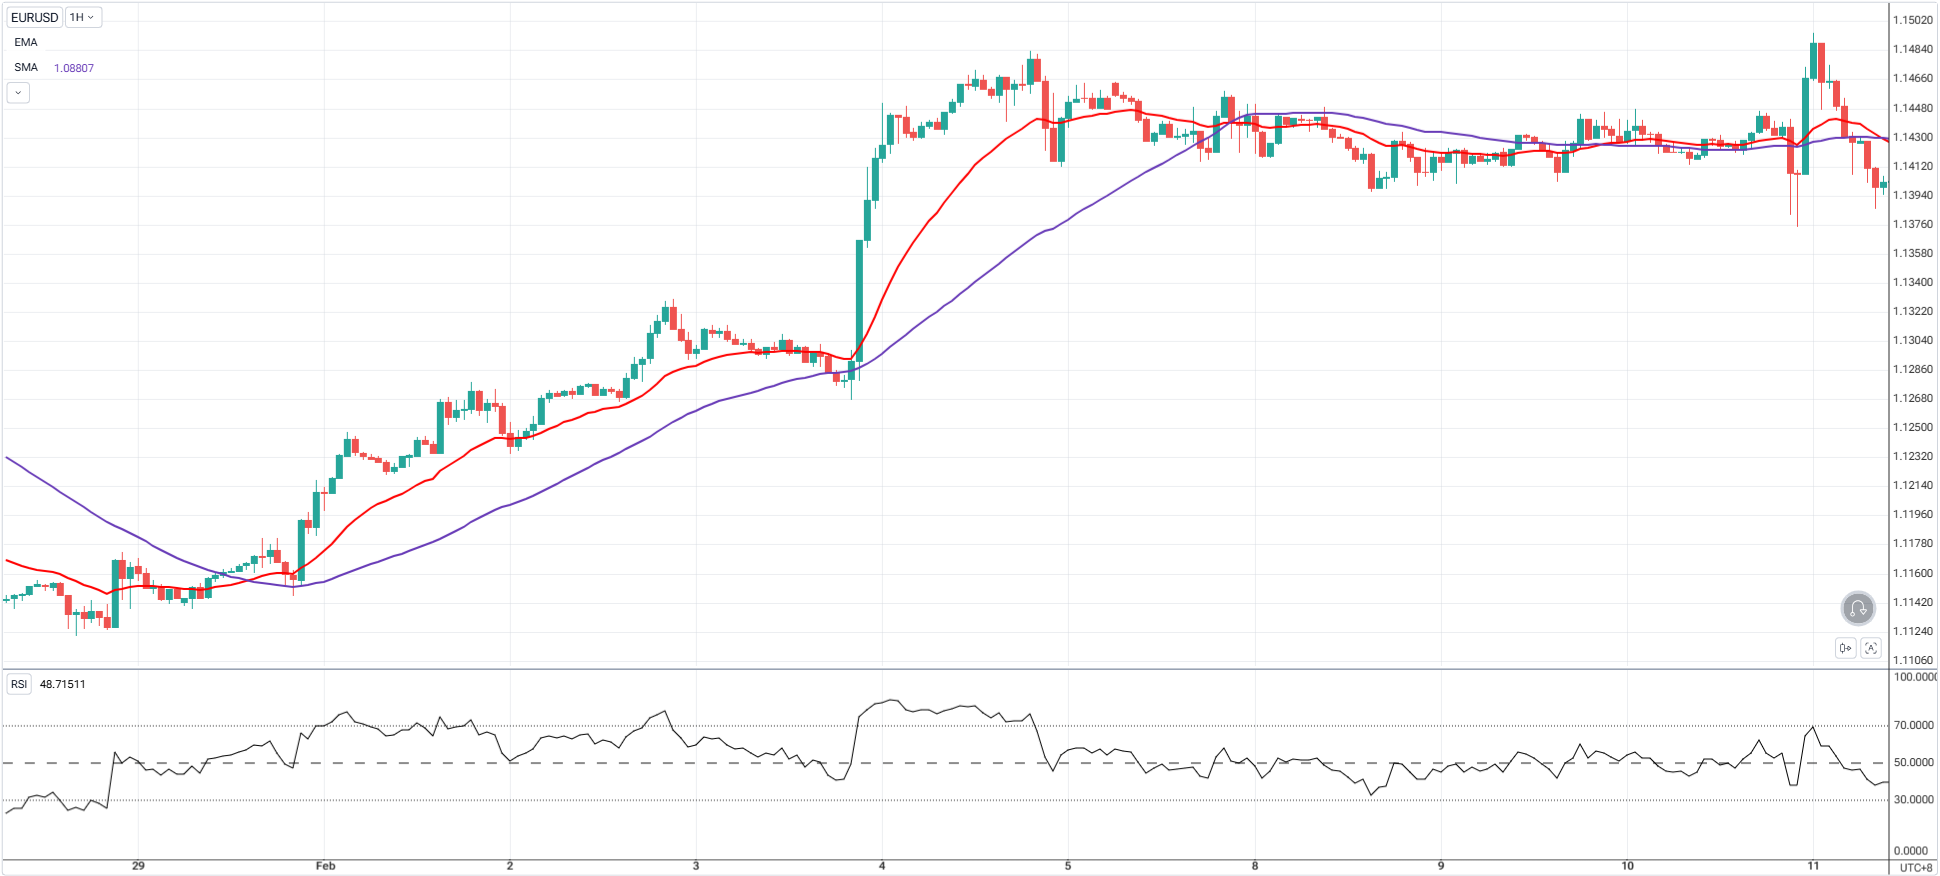
Step 1: Identify the Trend with Moving Averages
- Use 20 EMA for short-term flow
- Use 50 SMA for broader trend bias
Bullish Trend: Price above both, MAs sloping upward
Bearish Trend: Price below both, MAs sloping downward
Flat or twisted MAs = Ranging. Wait.
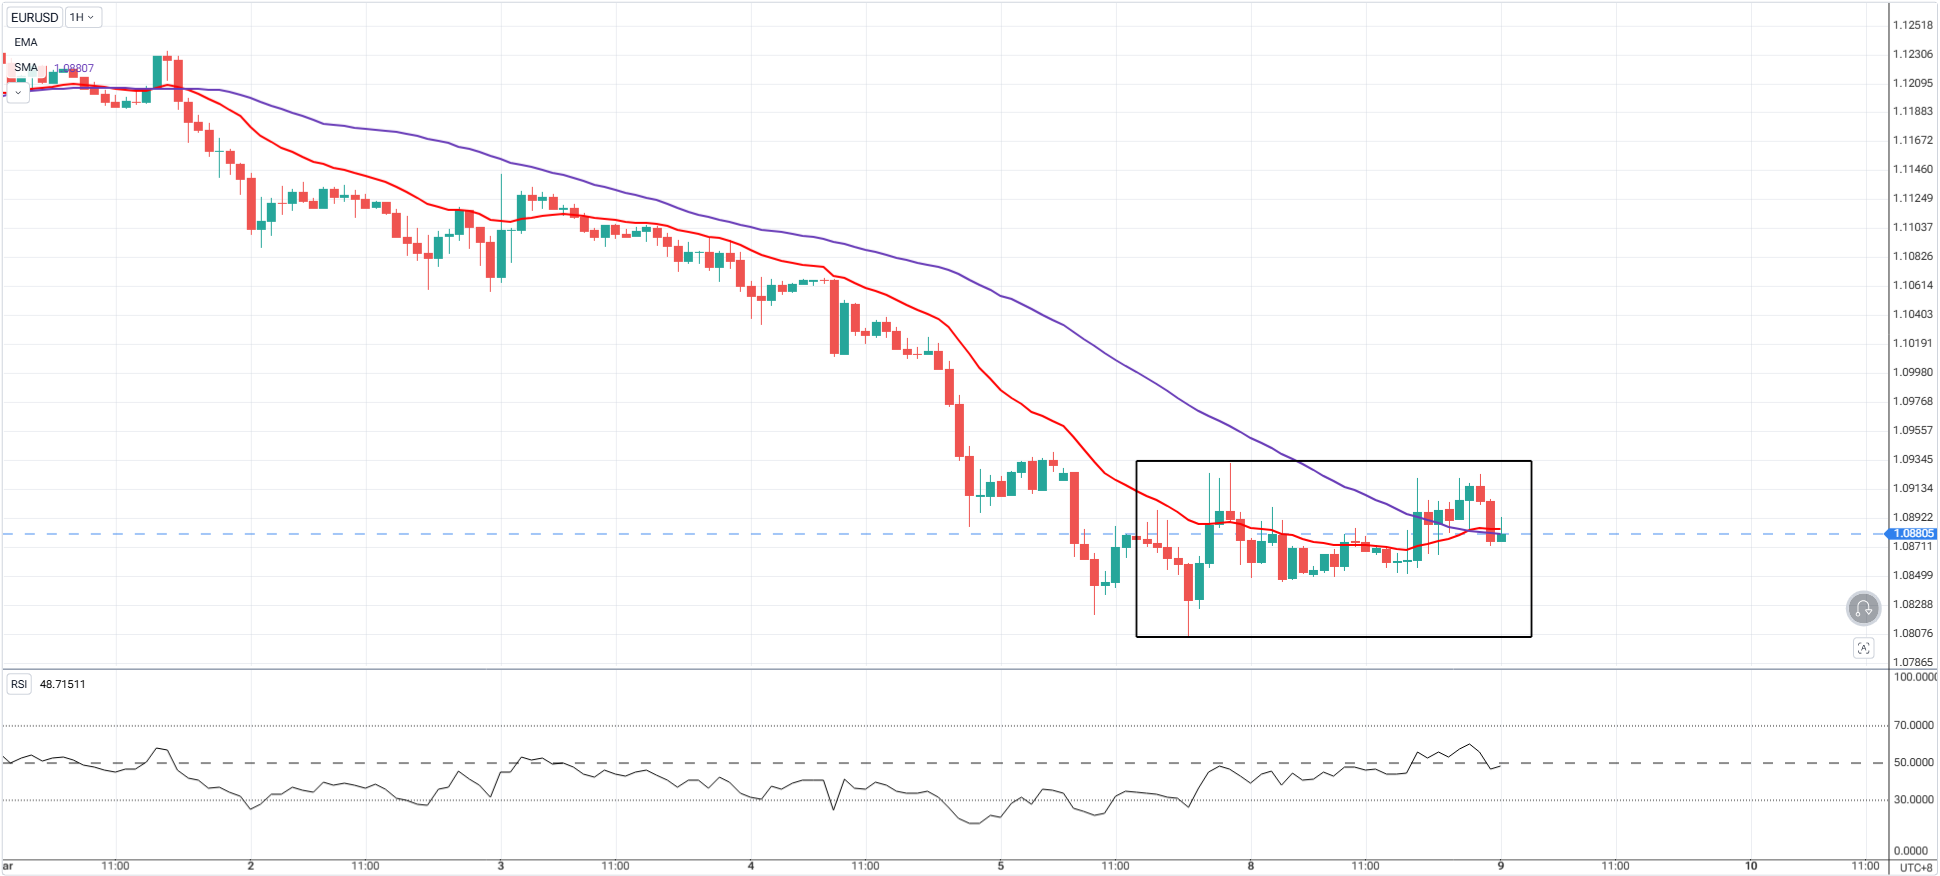
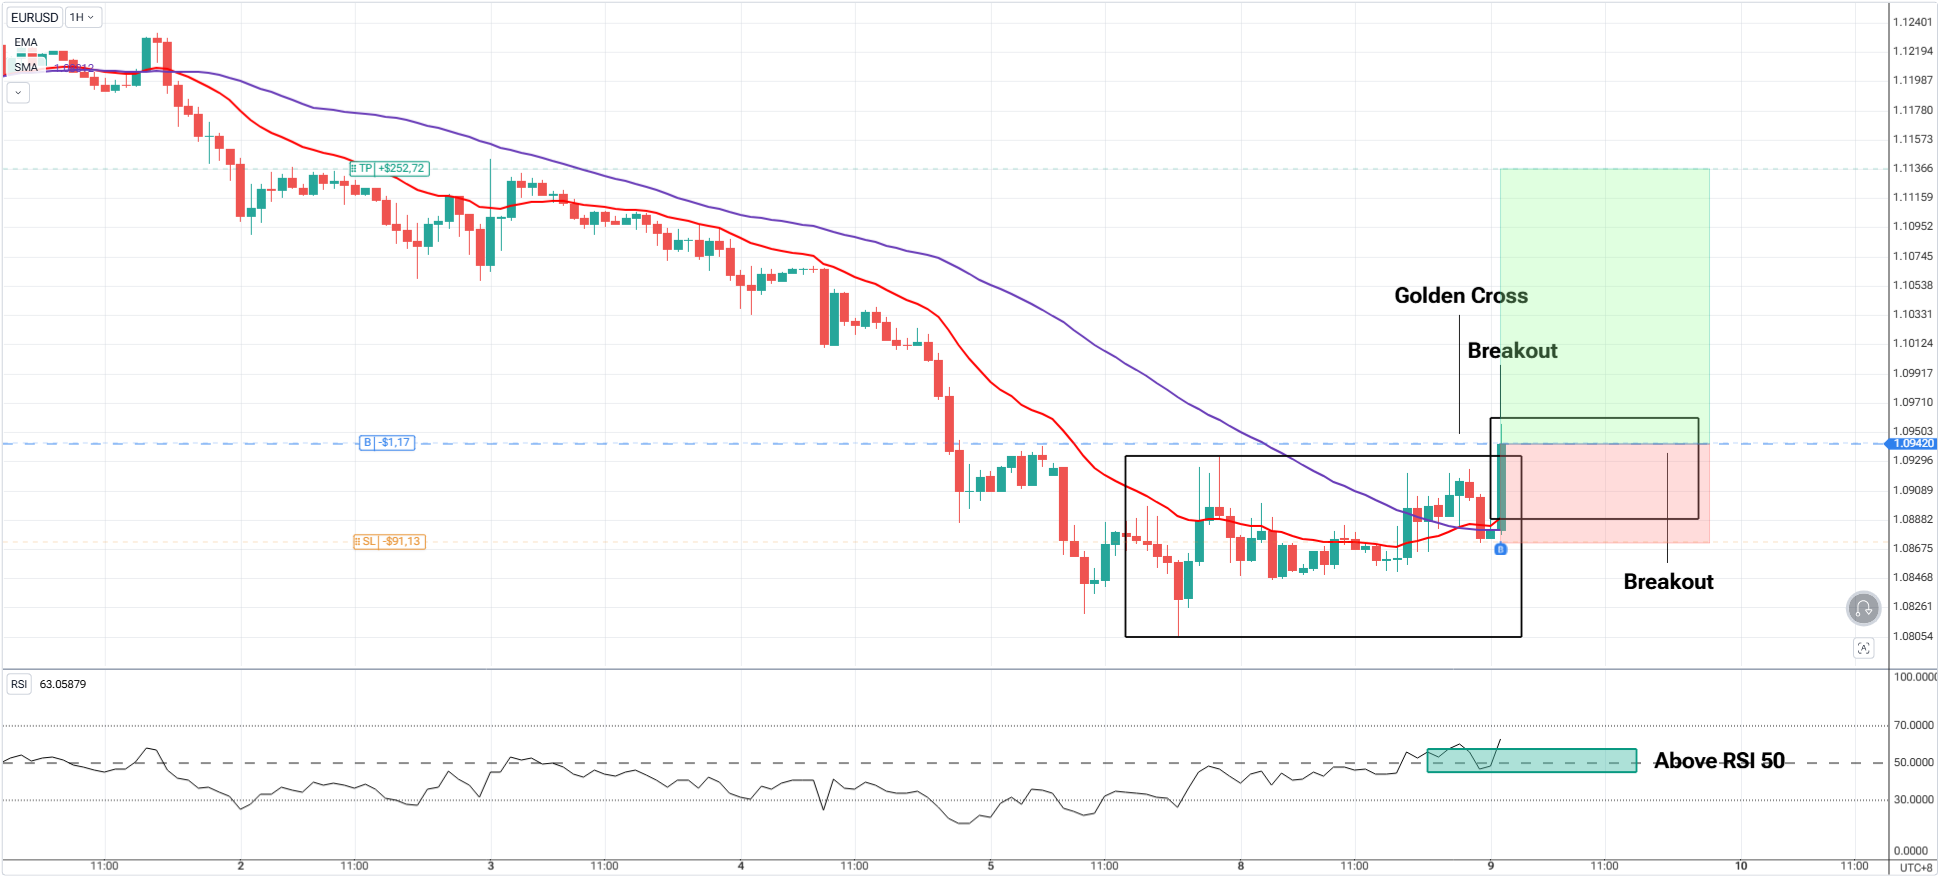
Step 2: Wait for a Breakout
Let price breakout of the range & price above the:
- The 20 EMA
- The 50 SMA
You will anticipate a Golden (Bullish) or Death (Bearish) Cross.
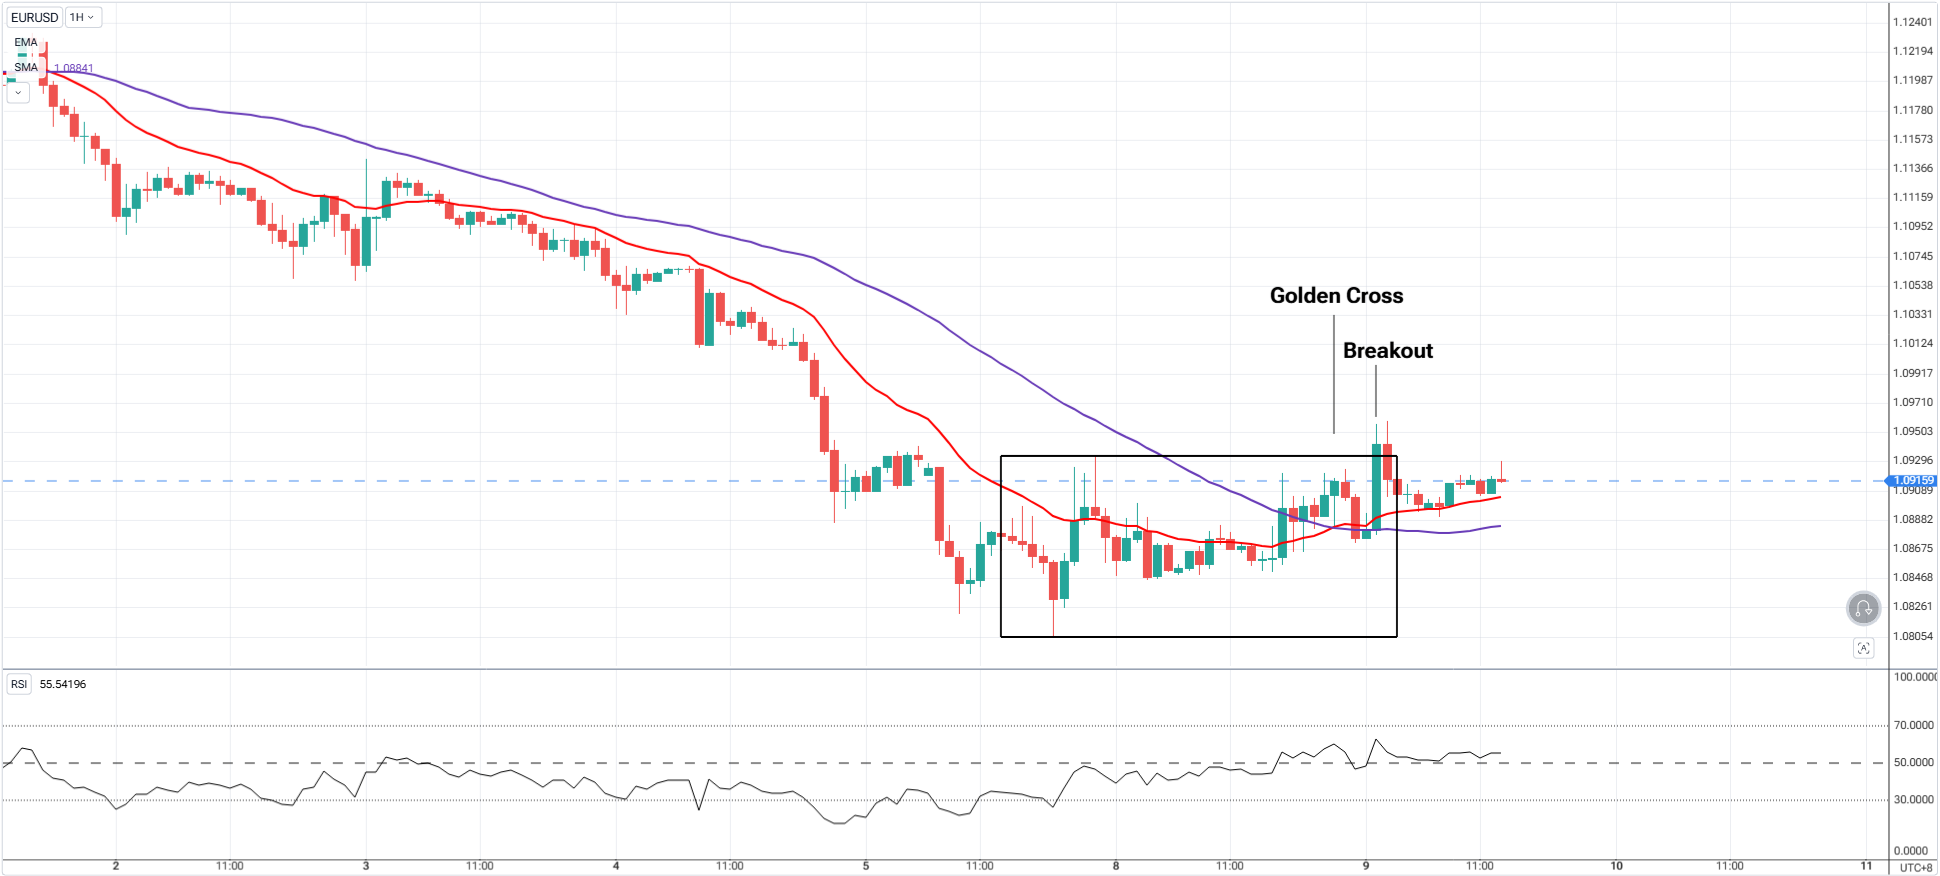
Step 3: Confirm Strength with RSI
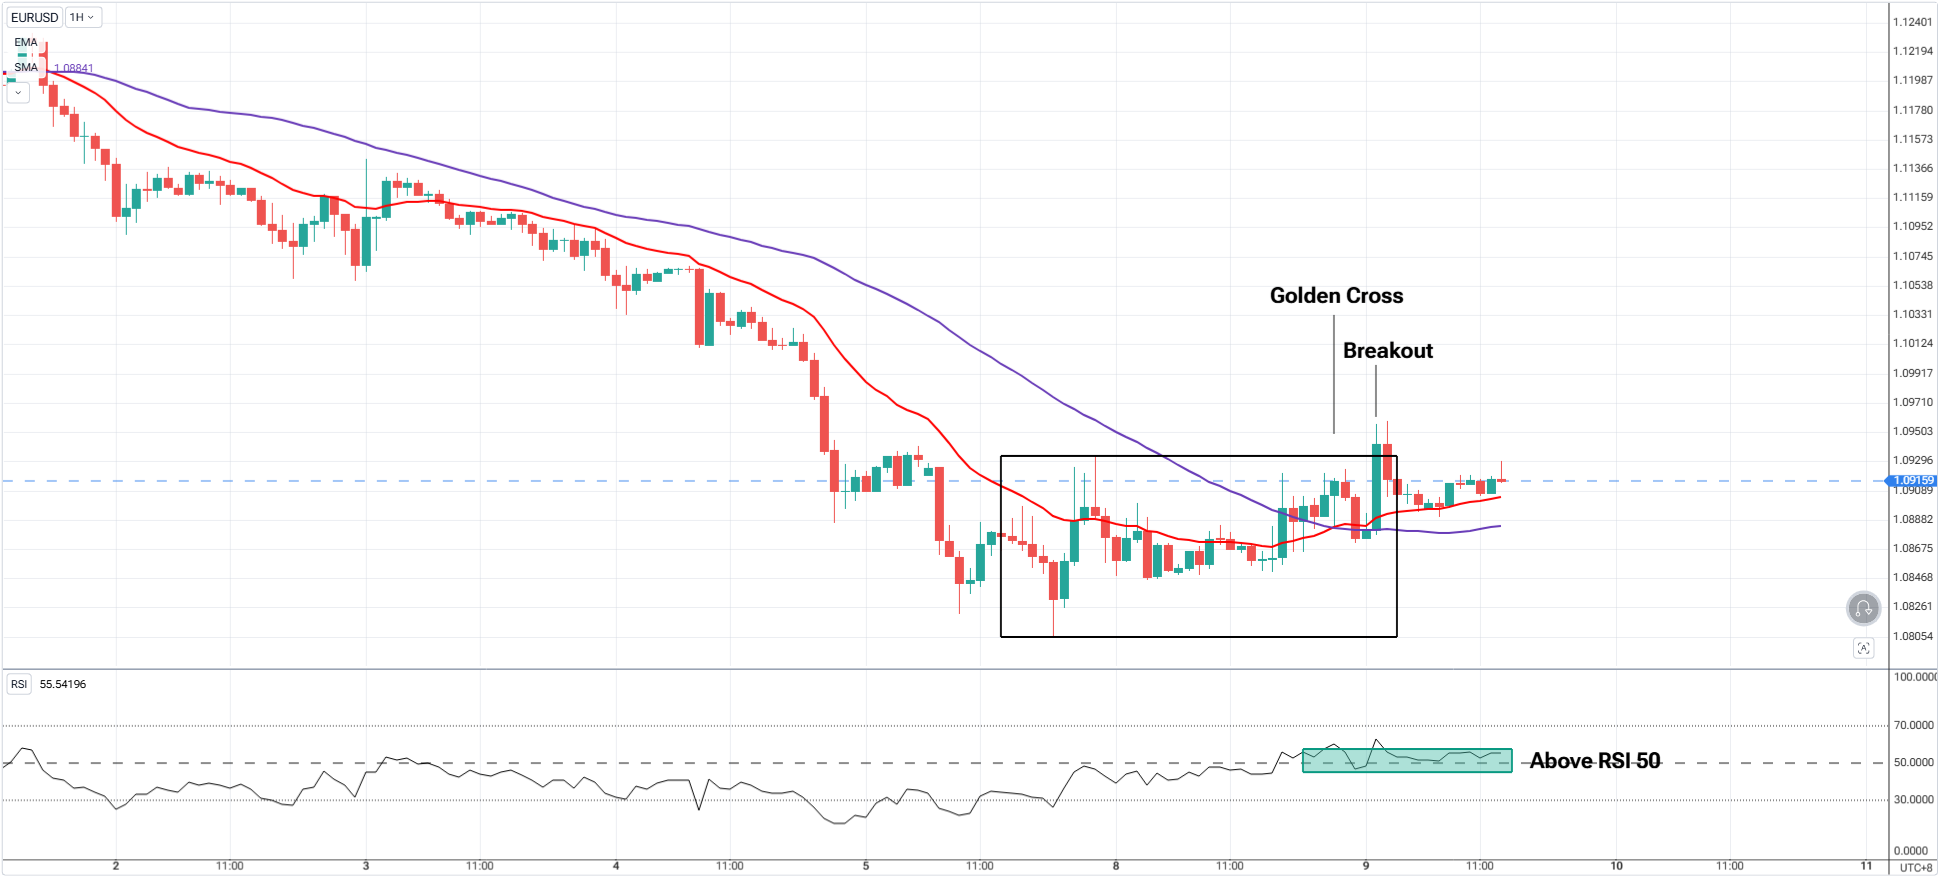
| Strong Momentum | Weak Momentum |
|---|---|
| RSI above 50 (uptrend) | RSI drops below 50 (no go) |
| RSI makes higher lows | RSI sideways or overbought |
| RSI supports breakout | RSI divergence or fading |
Don’t just trust RSI levels — watch the RSI trend itself.
Wait — Why Breakouts Now? I Thought We Were Trading Pullbacks?

Great question — and this is where context matters.
In the previous lesson, we focused on pullback entries — buying when price dips into moving averages or Fibonacci zones within a trend.
So why are we now telling you to look for breakouts?
Because sometimes, there is no clean pullback — and waiting for one means missing the move entirely.
Another: There are times that price will fall short in pulling back on the moving averages.
When to Trade Pullbacks vs. Breakouts
| Situation | What to Look For | Strategy |
|---|---|---|
| Clean trend, price returns to MA | Bounce at 20 EMA or 50 SMA | ✅ Pullback Entry |
| Strong trend, no deep pullback | Price keeps pushing and consolidates above MAs | ✅ Breakout Entry |
| Sideways chop or weak trend | MA and RSI not aligned | ❌ Wait |
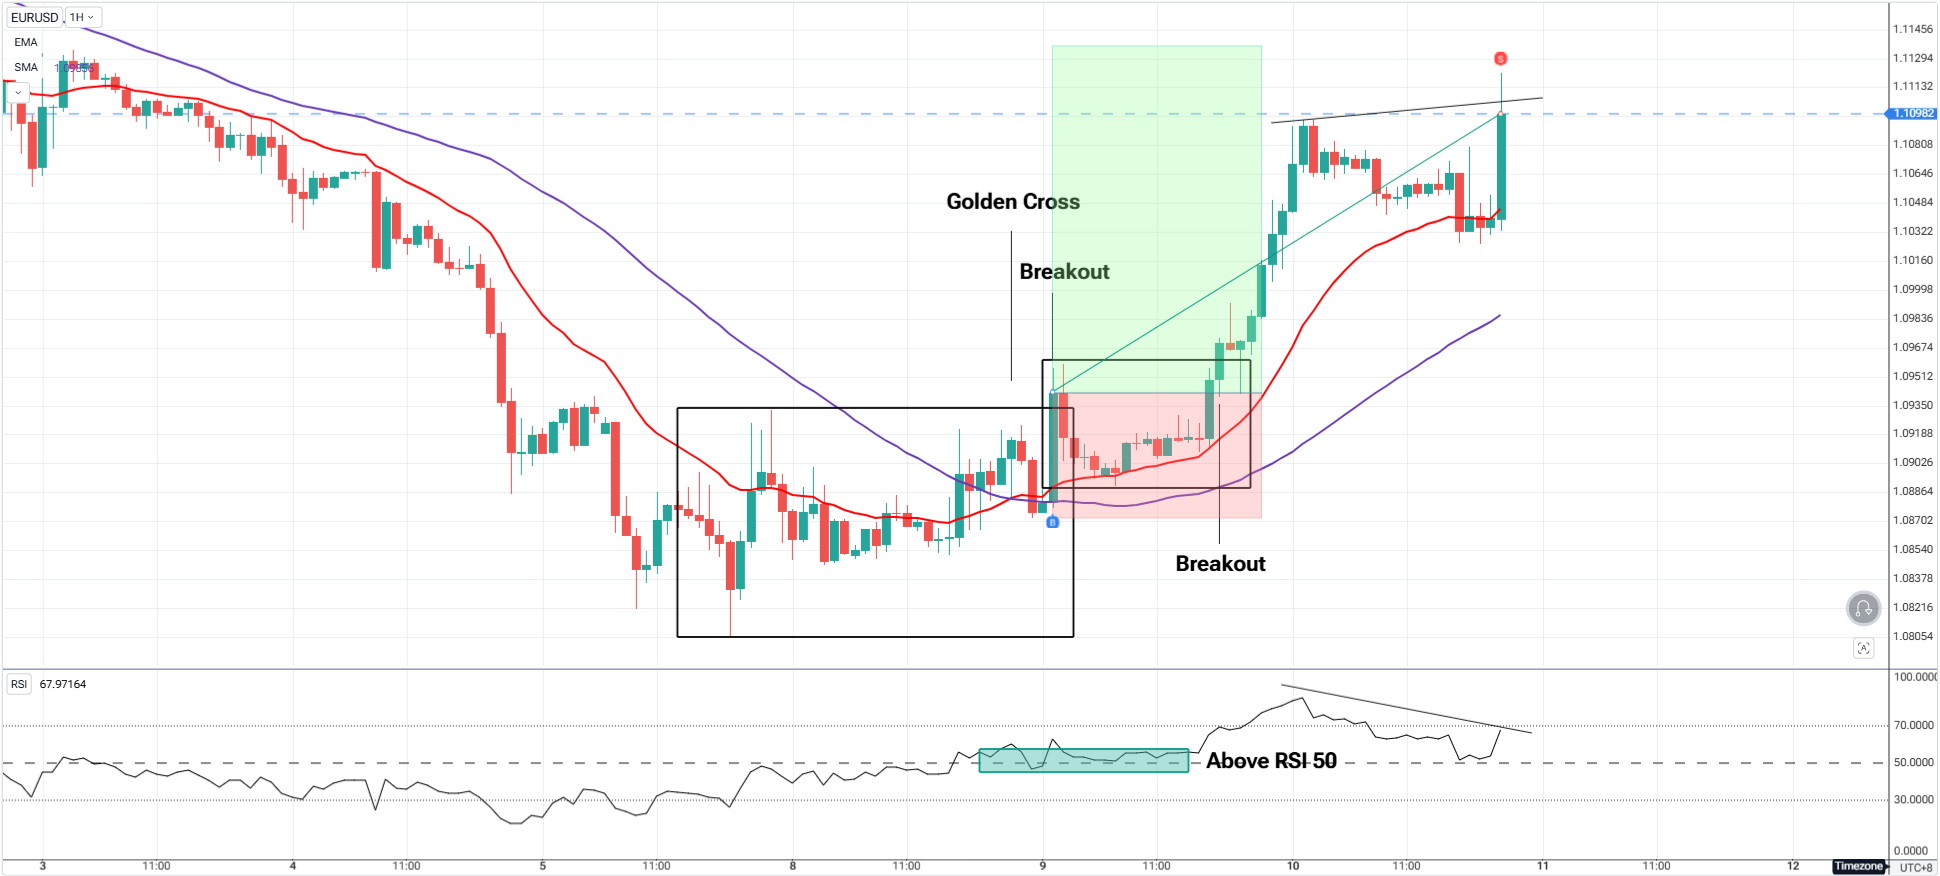
Trend Breakouts with MA + RSI Confluence
Sometimes, price builds pressure just above the 20 EMA. It doesn’t dip — it compresses, then explodes upward.
In that case:
- 20 EMA holds as dynamic support
- RSI stays above 50, showing strength
- Price forms tight range → breaks out → BOS (break of structure)
Instead of waiting for a dip that never comes, you enter the breakout when all the signs align.
This flexibility lets you capture more opportunities without violating your system — because the MA and RSI are still your foundation.
Reminder:
You’re not “changing” your system — you’re adapting the entry style (pullback vs. breakout) to the trend’s behavior, while still using moving average + RSI confluence to filter the trade.
Step 4: Entry Trigger — Let RSI & Price Action Confirm
At this point:
- MAs are aligned (20 EMA above 50 SMA = uptrend)
- RSI is above 50 and climbing (momentum confirmation)
- Price is either pulling back into MAs or coiling for a breakout
Now you need one last thing: confirmation from the candles themselves.
Here’s how to spot it:
A. If Price Pulls Back to MAs:
Look for a reaction at 20 EMA or 50 SMA:
- Bullish engulfing candle
- Wick rejections
- CHoCH (change of character)
- Liquidity sweep + bounce
RSI should:
- Stay above 50 (uptrend)
- Bounce or climb as price bounces from MA
Enter on candle close after confirmation.
B. If Price Doesn’t Pull Back or You Missed It — Trade the Breakout:
If price stays above 20 EMA and forms a tight range:
- Wait for price breakout above structure
- RSI should remain above 50 or even spike above 60+
- This signals momentum continuation
Entry trigger: Break of short-term high + bullish candle close
Confirmation: No breakdown below 20 EMA + strong RSI
Where to Place Stops
| Entry Type | Stop-Loss Strategy |
|---|---|
| 20 EMA Pullback | Below swing low or wick under EMA |
| 50 SMA Pullback | Below structure or zone of interest |
| Breakout Entry | Below breakout range or structure |
| Aggressive RSI Entry | Below entry candle or minor structure |
Step 5: Trail Your Winner with Price & RSI Clues
Method 1: Structure-Based Trailing
- In uptrend, trail below each higher low
- In downtrend, trail above each lower high
- Adjust SL as structure develops
Method 2: RSI Divergence + MA Confluence Exit
- Stay in trade as long as price remains above 20 EMA
- RSI should remain above 50 in a long
- Exit if RSI creates a divergence
Method 3: Set Targets
- A minimum of 2R is good
Pro Tips for Trading MA + RSI Confluence
- Use Lower Timeframes for trades, and Higher Timeframes for confirmation bias
- Stick to trending conditions (MAs sloping, RSI directional)
- Avoid overtrading RSI overbought/oversold — focus on trend support
- RSI > 60 in uptrend or < 40 in downtrend often signals strong momentum
Common Mistakes to Avoid
- Entering against trend because RSI is “overbought” or “oversold”
- Taking MA bounces without RSI support
- Using RSI in sideways markets (very unreliable)
- Setting stops too tight around moving averages
Final Thoughts

When price moves with power, your job is to ride it with logic — not guess.
This strategy gives you a trend filter (moving averages) and a momentum meter (RSI) — two of the most reliable tools when used together.
You now have the complete playbook to:
- Spot the trend
- Time the pullback or breakout
- Confirm momentum
- Enter with clarity
- Manage the trade confidently
Trend + Momentum = High-Probability Trading.
Here’s your action plan:
- Add 20 EMA, 50 SMA, and RSI (14) to your chart
- Scan 5–10 pairs for clean trend conditions
- Backtest entries using price + RSI + MA confluence
- Log your trades in a journal — pullbacks and breakouts
When these tools align — don’t hesitate. Ride the momentum with structure and confidence.
Start Practicing with Confidence - Risk-Free!
Open a free demo account today and experience institutional-grade spreads, lightning-fast execution, and all the tools you need to grow as a trader.
- Trade forex, indices, gold, and more
- Access ACY, MT4, MT5, & Copy Trading Platforms
- Practice with zero risk
It’s time to go from theory to execution - risk-free.
Create an Account. Start Your Free Demo!
Check Out My Contents:
Strategies That You Can Use
How To Trade & Scalp Indices at the Open Using Smart Money Concepts (SMC)
How to Trade Breakouts Effectively in Day Trading with Smart Money Concepts
Complete Step-by-Step Guide to Day Trading Gold (XAU/USD) with Smart Money Concepts (SMC)
The Power of Multi-Timeframe Analysis in Smart Money Concepts (SMC)
Forex Trading Strategy for Beginners
Mastering Candlestick Pattern Analysis with the SMC Strategy for Day Trading
Mastering Risk Management: Stop Loss, Take Profit, and Position Sizing
How to Use Fibonacci to Set Targets & Stops (Complete Guide)
RSI Divergence Trading Strategy for Gold: How to Identify and Trade Trend Reversals
Stochastics Trading Secrets: How to Time Entries in Trending Markets using Stochastics
Gold Trading Stochastics Strategy: How to Trade Gold with 2R–3R Targets
RSI Hidden Divergence Explained: How to Spot Trend Continuations Like a Pro
How To Trade News
Why Smart Money Concepts Work in News-Driven Markets - CPI, NFP, and More
How to Trade NFP Using Smart Money Concepts (SMC)-A Proven Strategy for Forex Traders
How to Trade CPI Like Smart Money - A Step-by-Step Guide Using SMC
Learn How to Trade US Indices
How to Start Trading Indices and Get into the Stock Market with Low Capital (2026 Guide)
Best Indices to Trade for Day Traders | NASDAQ, S&P 500, DAX + Best Times to Trade Them
How To Trade & Scalp Indices at the Open Using Smart Money Concepts (SMC)
NAS100 - How to Trade the Nasdaq Like a Pro (Smart Money Edition)
How to Trade CPI Like Smart Money - A Step-by-Step Guide Using SMC
Why Smart Money Concepts Work in News-Driven Markets - CPI, NFP, and More
How to Start Trading Gold
How to Swing Trade Gold (XAU/USD) Using Smart Money Concepts: A Simple Guide for Traders
Complete Step-by-Step Guide to Day Trading Gold (XAU/USD) with Smart Money Concepts (SMC)
The Ultimate Guide to Backtesting and Trading Gold (XAU/USD) Using Smart Money Concepts (SMC)
Why Gold Remains the Ultimate Security in a Shifting World
How to Trade Japanese Candlesticks
How to Trade Candlestick Patterns with High Probability: A Complete Guide for Beginners
The Top Japanese Candlestick Guide: What is an Engulfing Pattern and How to Trade It?
Piercing Pattern Candlestick Explained: How to Trade It - Step-By-Step Guide
Morning & Evening Star Candlestick Patterns – How to Trade Market Reversals with Confidence
How to Start Day Trading
5 Steps to Start Day Trading: A Strategic Guide for Beginners
8 Steps How to Start Forex Day Trading in 2026: A Beginner’s Step-by-Step Guide
3 Steps to Build a Trading Routine for Consistency and Discipline - Day Trading Edition
The Ultimate Guide to Understanding Market Trends and Price Action
Trading with Momentum: The Best Trading Session to Trade Forex, Gold and Indices
Learn how to navigate yourself in times of turmoil
How to Identify Risk-On and Risk-Off Market Sentiment: A Complete Trader’s Guide
How to Trade Risk-On and Risk-Off Sentiment - With Technical Confirmation
The Ultimate Guide to Understanding Market Trends and Price Action
Want to learn how to trade like the Smart Money?
Why Smart Money Concepts Work: The Truth Behind Liquidity and Price Action
Mastering the Market with Smart Money Concepts: 5 Strategic Approaches
Mastering Candlestick Pattern Analysis with the SMC Strategy for Day Trading
Understanding Liquidity Sweep: How Smart Money Trades Liquidity Zones in Forex, Gold, US Indices
The SMC Playbook Series Part 4: How to Confirm Trend Reversal & Direction using SMC
The SMC Playbook Series Part 5: The Power of Multi-Timeframe Analysis in Smart Money Concepts (SMC)
Fair Value Gaps Explained: How Smart Money Leaves Footprints in the Market
The Best Time to Use Smart Money Concepts (SMC): Why Timing Is Everything in Trading SMC
How to Trade the London Session Using Smart Money Concepts (SMC)
Trading Psychology and Continuous Improvement Contents
The Mental Game of Execution - Debunking the Common Trading Psychology
5 Steps to Backtest a Trading Strategy with AI: A Step-by-Step Guide
Managing Trading Losses: Why You Can Be Wrong and Still Win Big in Trading
The Hidden Threat in Trading: How Performance Anxiety Sabotages Your Edge
Why You Fail in Trading: You Don’t Have Enough Capital to Survive
Why 90% of Retail Traders Fail Even with Profitable Trading Strategies
The Top 10 Best Trading Books That Changed My Mindset, Strategy & Performance
Discovering Your Trader Profile: What Kind of Trader Are You?
Follow me for more daily market insights!
Jasper Osita - LinkedIn - FXStreet - YouTube
This content may have been written by a third party. ACY makes no representation or warranty and assumes no liability as to the accuracy or completeness of the information provided, nor any loss arising from any investment based on a recommendation, forecast or other information supplies by any third-party. This content is information only, and does not constitute financial, investment or other advice on which you can rely.
Try These Next

