How to Plot Key Support & Resistance Levels the SMC Way for Day Trading
2025-05-06 14:17:29


Goal of This Lesson:

To shift your understanding of Support and Resistance (S&R) from a basic, retail mindset into a precision-based confirmation model used by smart money traders. You’ll learn how to properly draw key S&R levels, identify role reversals, and focus on true key levels that matter—ones that are backed by liquidity, structure, and confirmation.
By the End of This Lesson, You Should Be Able To:
- Identify true support & resistance vs meaningless levels
- Draw key S&R levels: PDH/PDL, previous sessions, and major swings
- Avoid false breakouts using confirmations
- Trade S&R with liquidity sweeps and market structure shifts (MSS)
Real-Life Analogy:

Imagine you’re navigating a city with hundreds of roads—but only a few major intersections matter for traffic control, signals, and movement.
Don’t treat every street like a highway.
In the market, only a handful of levels truly govern direction—the rest are noise.
What Is Support and Resistance?
| Term | Description |
|---|---|
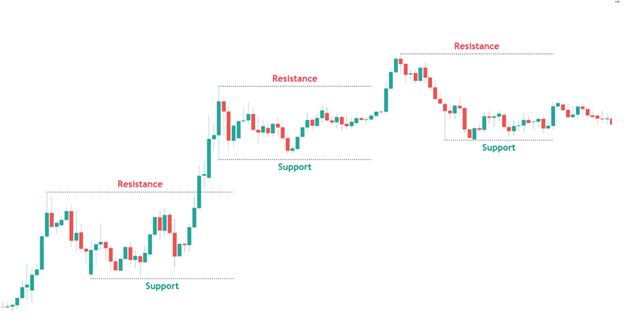
| Support | A price level where price previously stopped falling and reversed upward. |
| Resistance | A price level where price previously stopped rising and reversed downward. |
But in Smart Money terms:
- These are not permanent walls—they’re liquidity pools.
- They’re not levels to “buy” or “sell” automatically—they’re areas where price will either react or manipulate.
Why Not All Support & Resistance Levels Are Created Equal

Most traders are taught to draw dozens of horizontal lines. Every swing high or low becomes “support” or “resistance.” But that’s a trap.
Just because price reacted to a level once doesn’t mean it will again.
In Smart Money trading, we don’t just draw levels—we define key ones. We only trade those that hold significance, like:
- Where liquidity was taken
- Where displacement began
- Where sessions closed or opened
- Where structure shifted
These are key levels—because smart money is involved there.
The Retail Trap: Blind SnR Trading

Most traders:
- Buy at support, expecting it to bounce.
- Sell at resistance, expecting a drop.
- Trade breakouts with no confirmation.
- Draw 15+ levels per chart.
This creates indecision, clutter, and losses.
Smart Money Traders do this instead:
- Mark Key Levels only (PDH, PDL, Session Highs/Lows)
- Wait for liquidity sweep
- Then look for confirmation (displacement, FVG, MSS)
Retail vs Smart Money S&R
| Approach | Retail Trader | Smart Money Trader |
|---|---|---|
| Breakout Execution | Enters immediately on break | Waits for Sweep → Surge → Shift confirmation |
| Stop Placement | Just below/above level | Anchored beyond liquidity sweep |
| Risk Exposure | High (no structure confirmation) | Low (uses confluence + structure) |
| Trades All Levels | Yes | Selectively filters based on HTF context & time |
Marking Key Support & Resistance Levels Based on Time and Price

When marking S&R zones, focus on historical reactions and institutional interest areas:
Key Levels to Mark:
- PDH / PDL – Previous Day’s High & Low
- PSH / PSL – Previous Session’s High & Low (Asian, London, NY)
Tip:
Don’t mark 10+ levels. Focus on zones with clean reactions and significance on M15 or higher timeframes.
S&R Is About Context, Not Just the Line
Anyone can draw horizontal lines—but only professionals know:
- When not to trade them
- When price is faking a breakout
- When the level is likely to flip (role reversal)
Combine S&R with time (Kill Zones), liquidity (sweeps), and structure (MSS) for precision entries.
When to Avoid S&R Trades
- If the level is not a key level
- If it lies in mid-range consolidation
- If there’s no sweep + surge
- If price reacted outside kill-zones
Actionable Playbook:
| Step | Description |
|---|---|
| 1. | Mark PDH, PDL, previous session highs/lows |
| 2. | Wait for price to reach a level inside the Kill Zone |
| 3. | Look for a sweep (e.g., wick above PDH) |
| 4. | Confirm with displacement and market structure shift on lower timeframe |
| 5. | Enter on the pullback with SL below/above the sweep zone |
| 6. | Target next clean liquidity level (ERL or HTF FVG) |
Final Thought:

Every level isn’t a trade.
But every trade comes from a key level.
Support and resistance only matter when smart money interacts with them. Wait for the sweep, the surge, the shift.
Confirmation gives you clarity. And clarity protects your capital
Check out my previous blog plotting simple support and resistance levels: https://acy.com/en/market-news/education/ultimate-guide-market-trends-price-action-j-o-03252025-141804/
This content may have been written by a third party. ACY makes no representation or warranty and assumes no liability as to the accuracy or completeness of the information provided, nor any loss arising from any investment based on a recommendation, forecast or other information supplies by any third-party. This content is information only, and does not constitute financial, investment or other advice on which you can rely.
Try These Next

