Order Blocks and AMD Market Structure (Smart Money Concepts)
2025-11-12 09:04:10


Order blocks don’t exist in isolation. They live inside the skeleton of market structure - where breakouts, reversals, and continuations reveal whether institutions are defending, reloading, or exiting their positions. To truly understand order blocks, you must see them as the structural language that institutions speak through AMD (Accumulation–Manipulation–Distribution) - the rhythmic flow of every market cycle. This process forms the foundation of Smart Money Concepts, transforming what looks like random candles into a readable story of intent and control.
When you learn to combine structure (BOS, CHoCH) with correctly marked order blocks, something shifts: you stop reacting to price and start interpreting it. Every move begins to make sense because you now understand why it’s happening, not just what is happening.
Understanding the Framework: AMD in Context
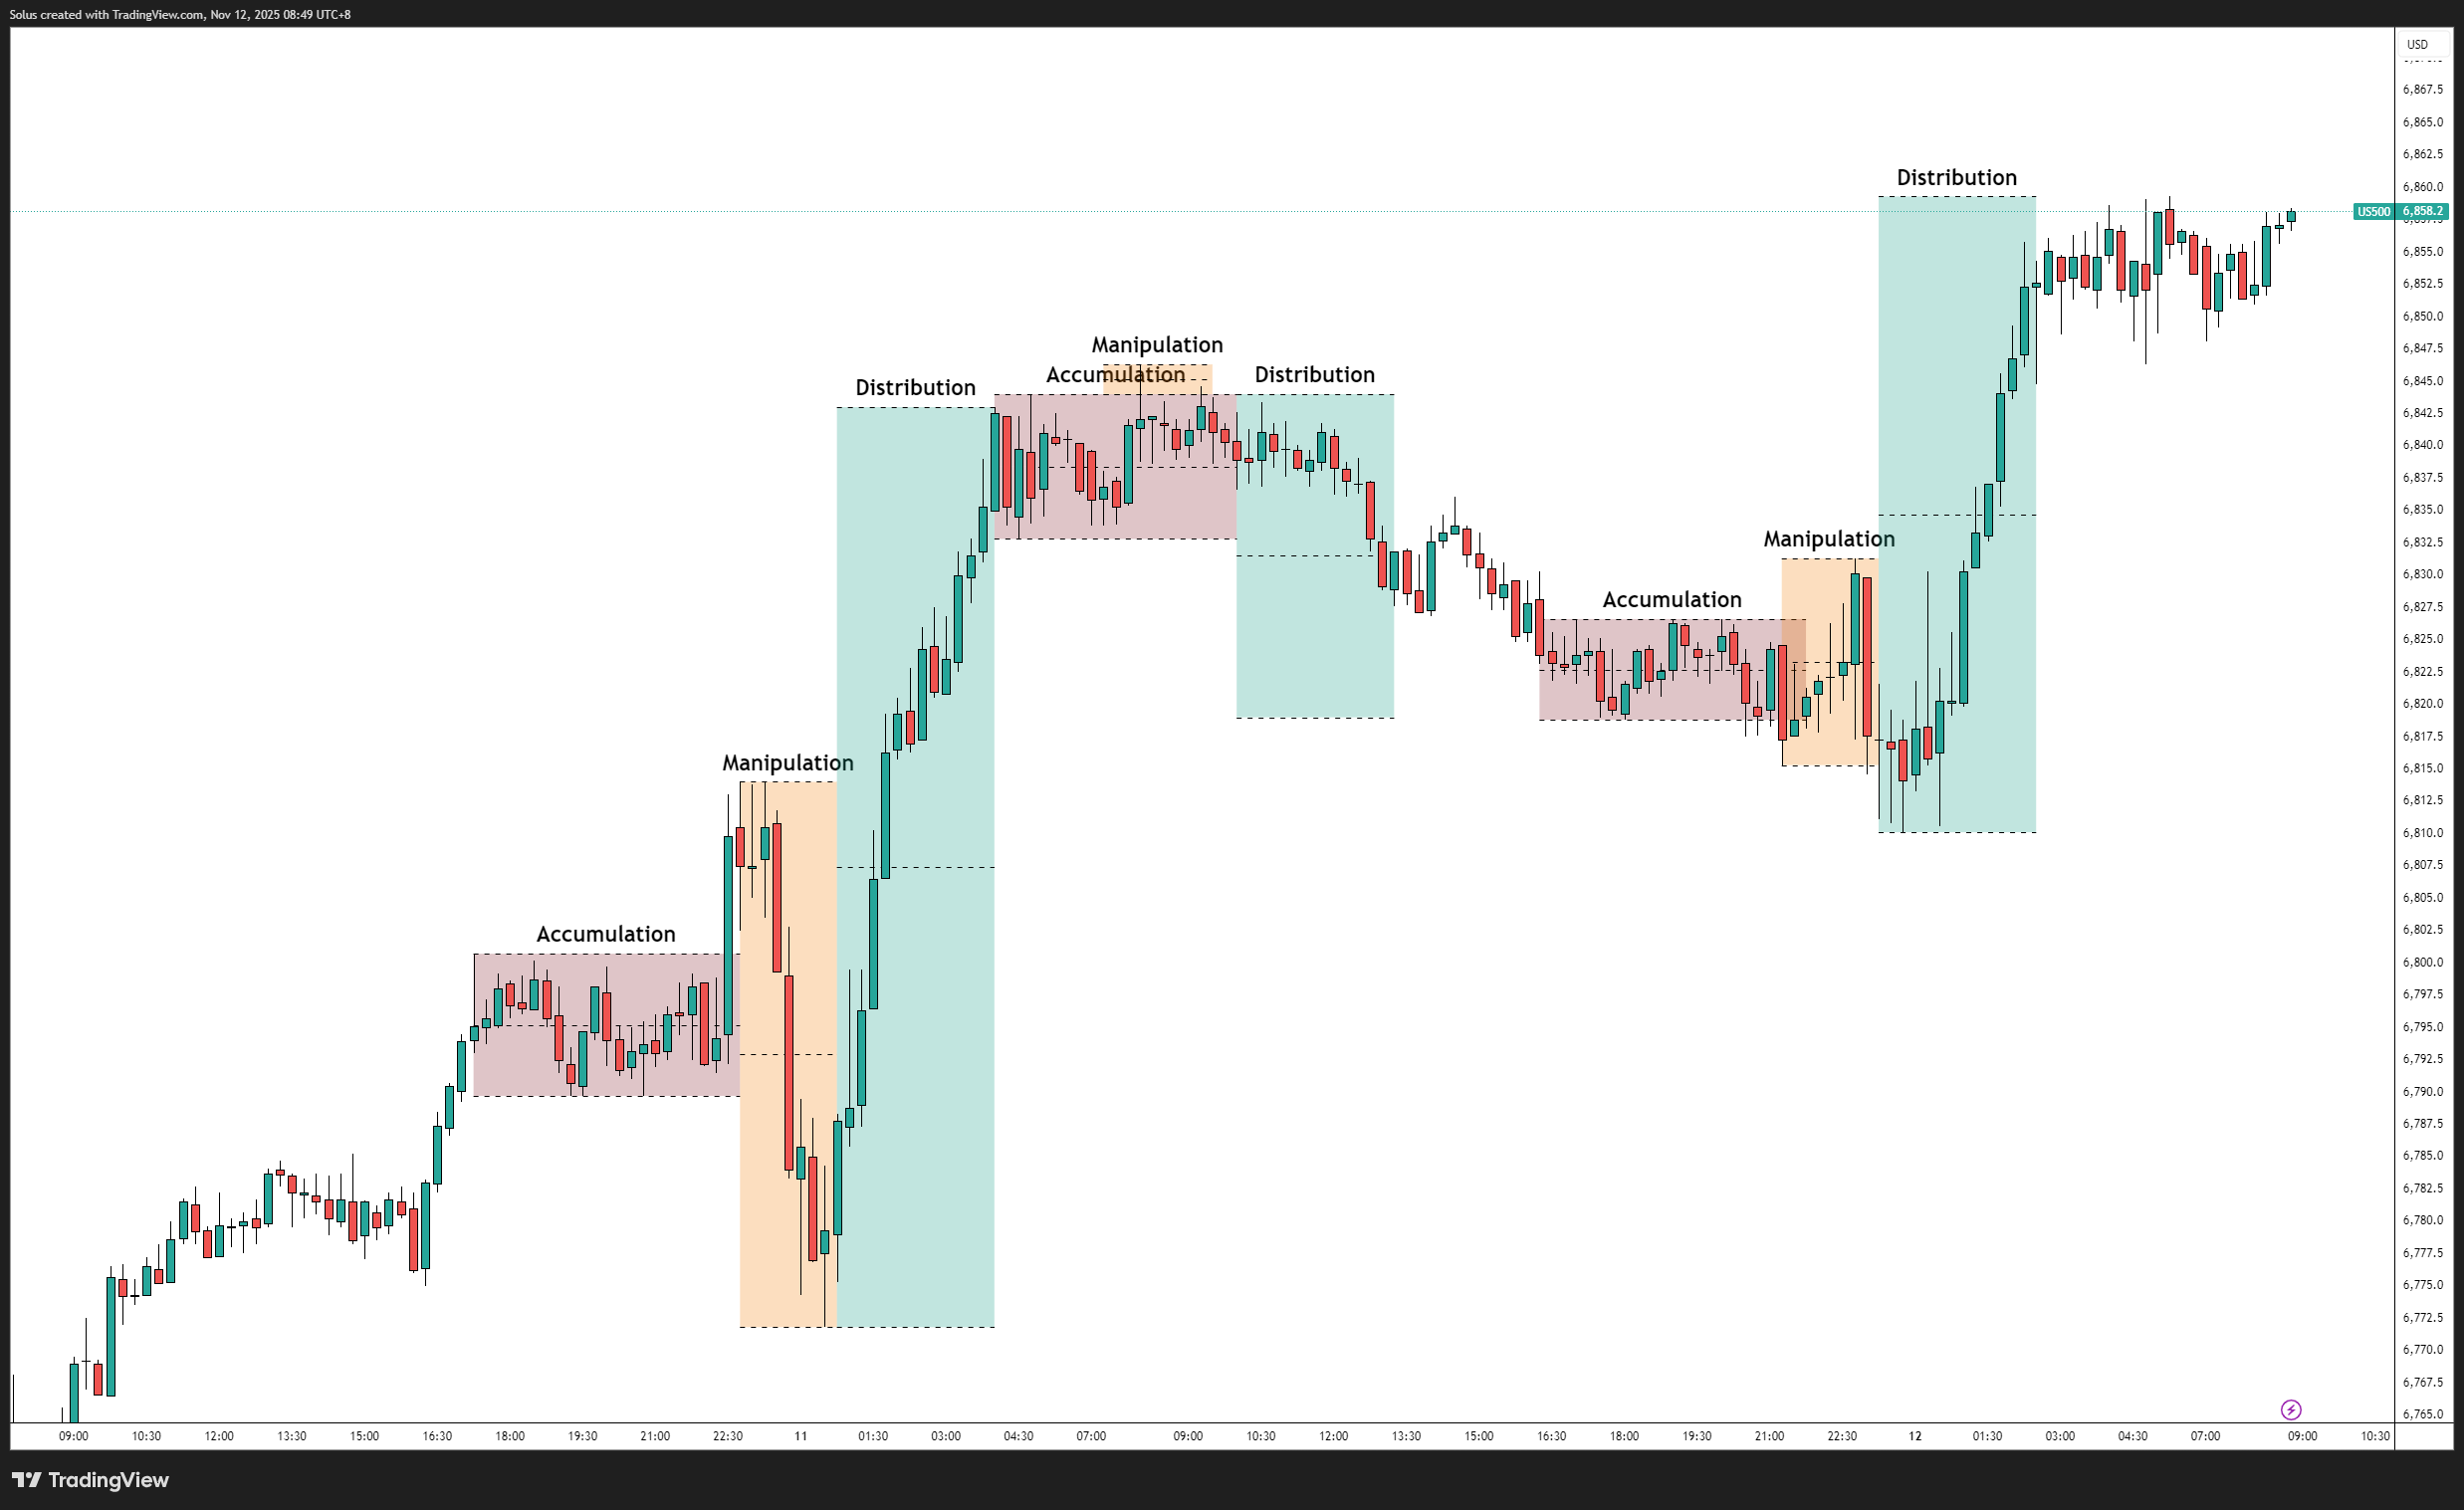
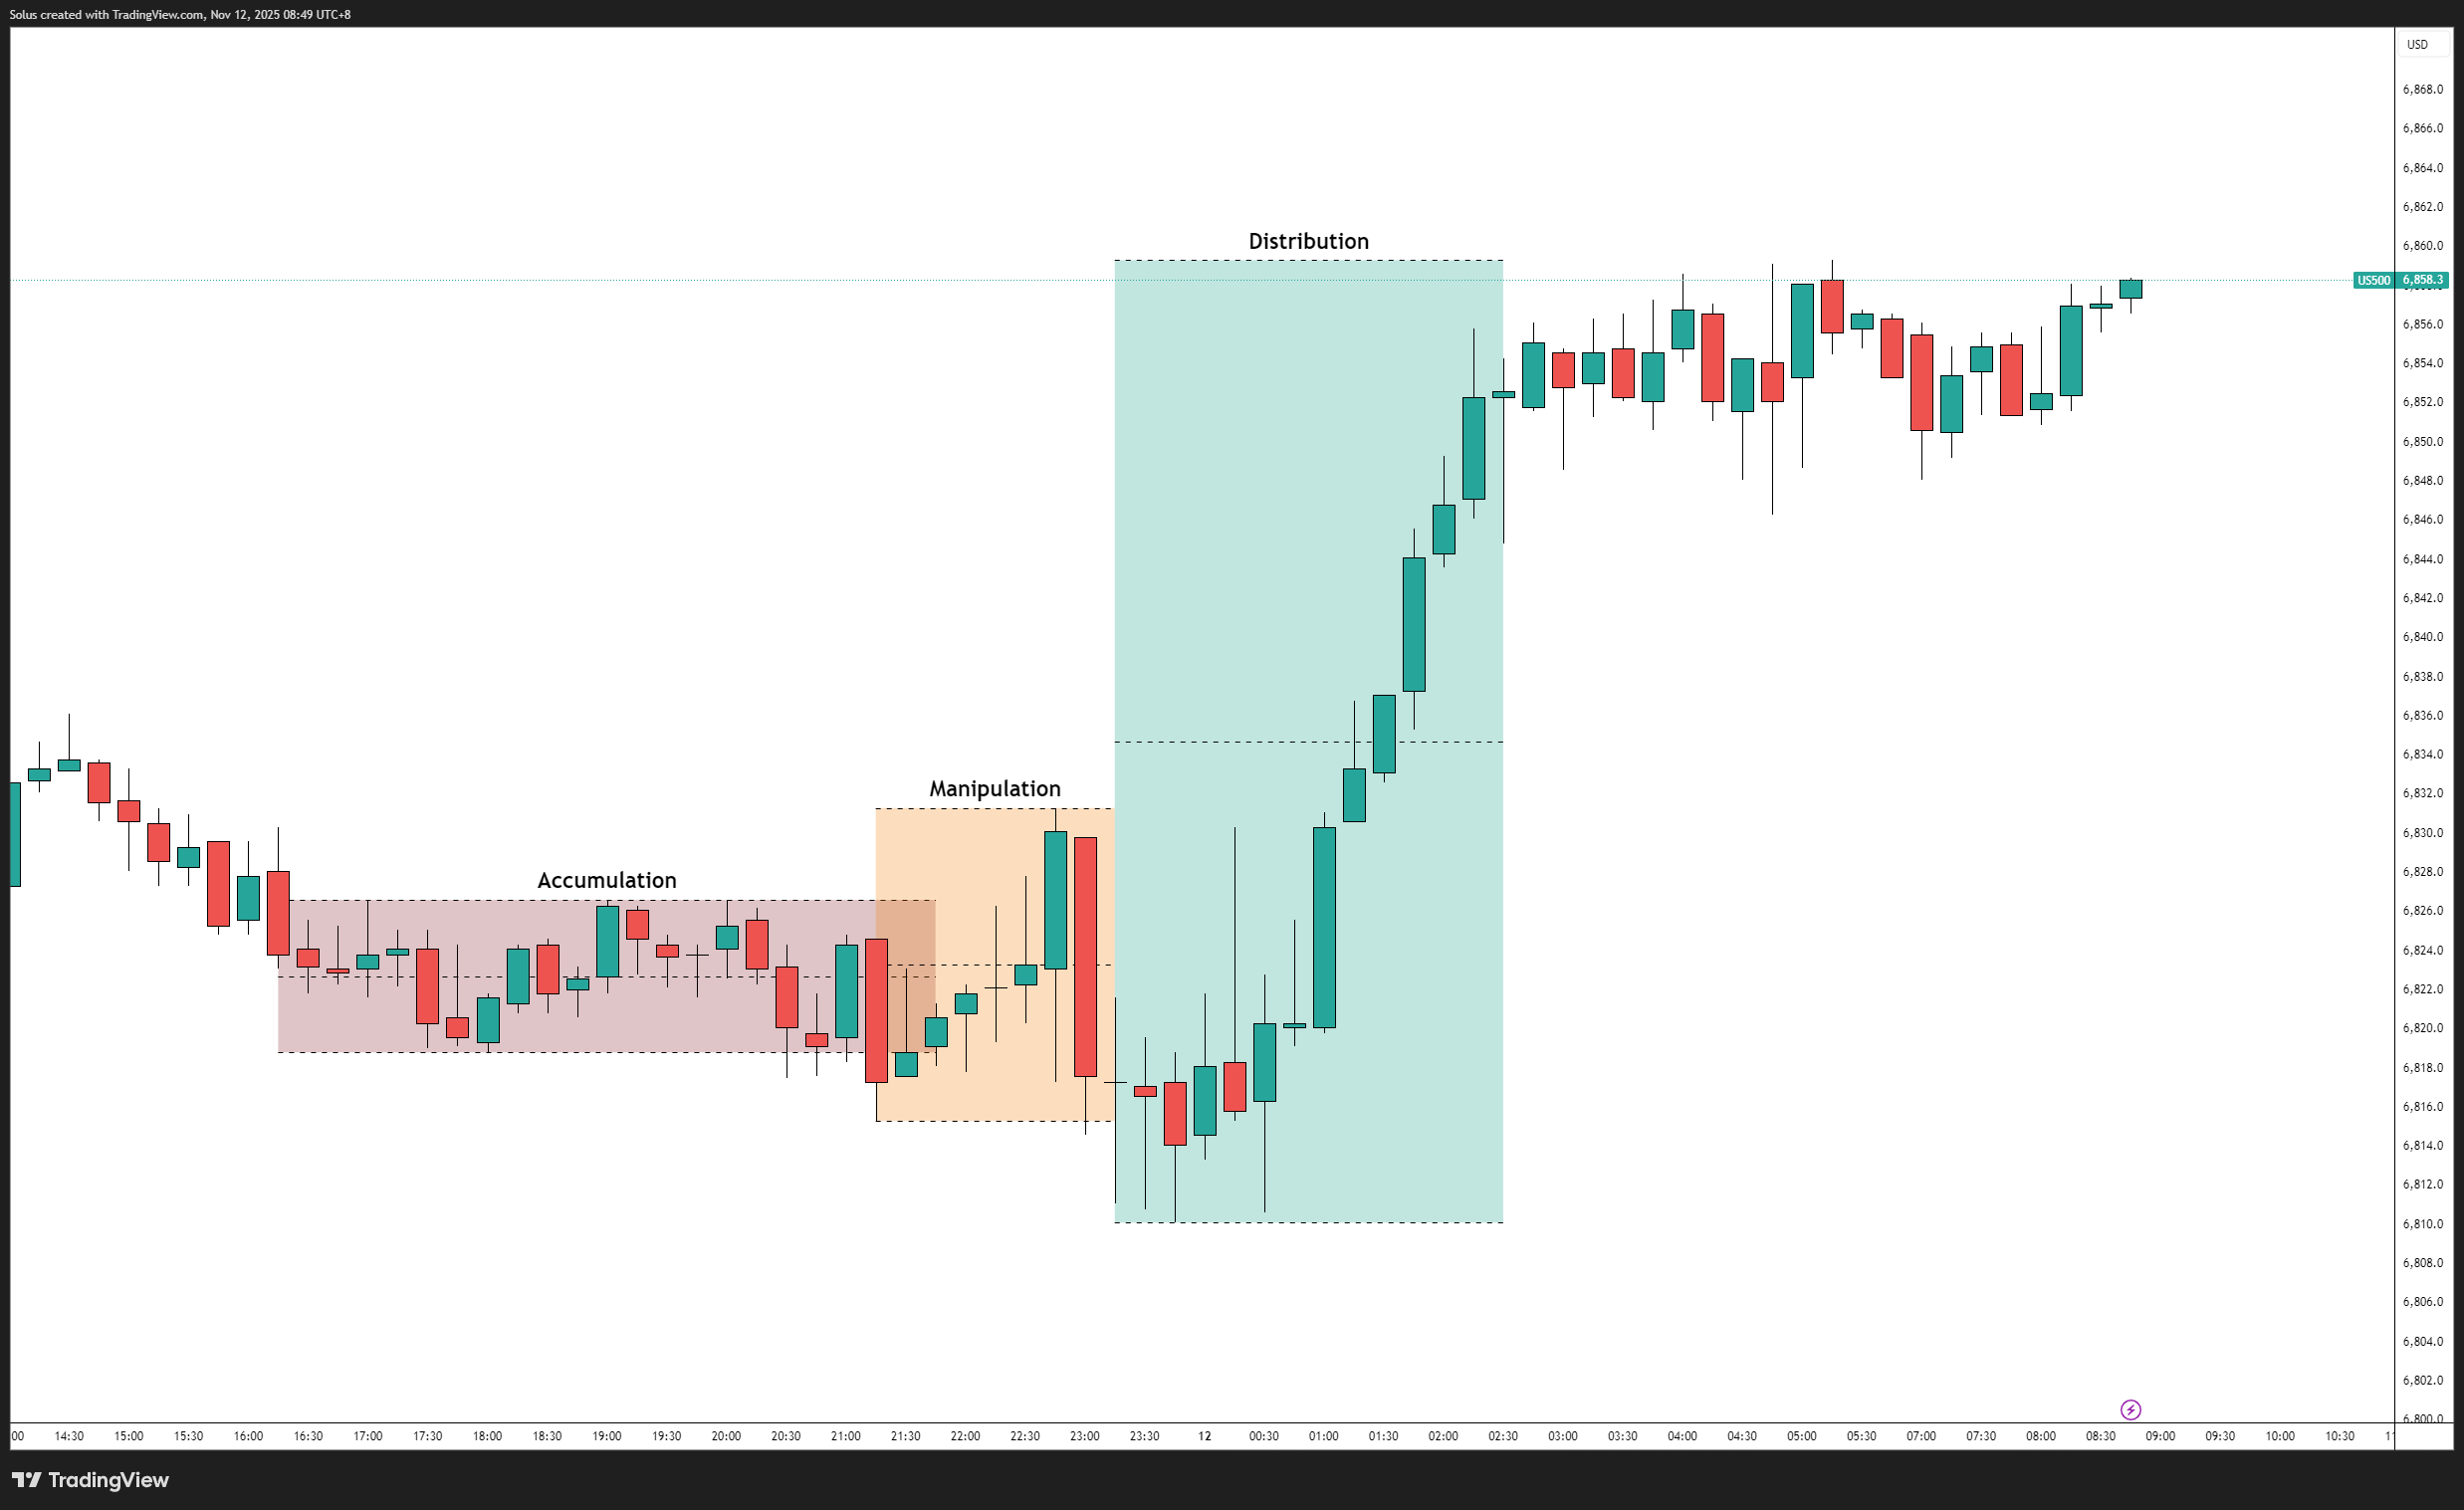
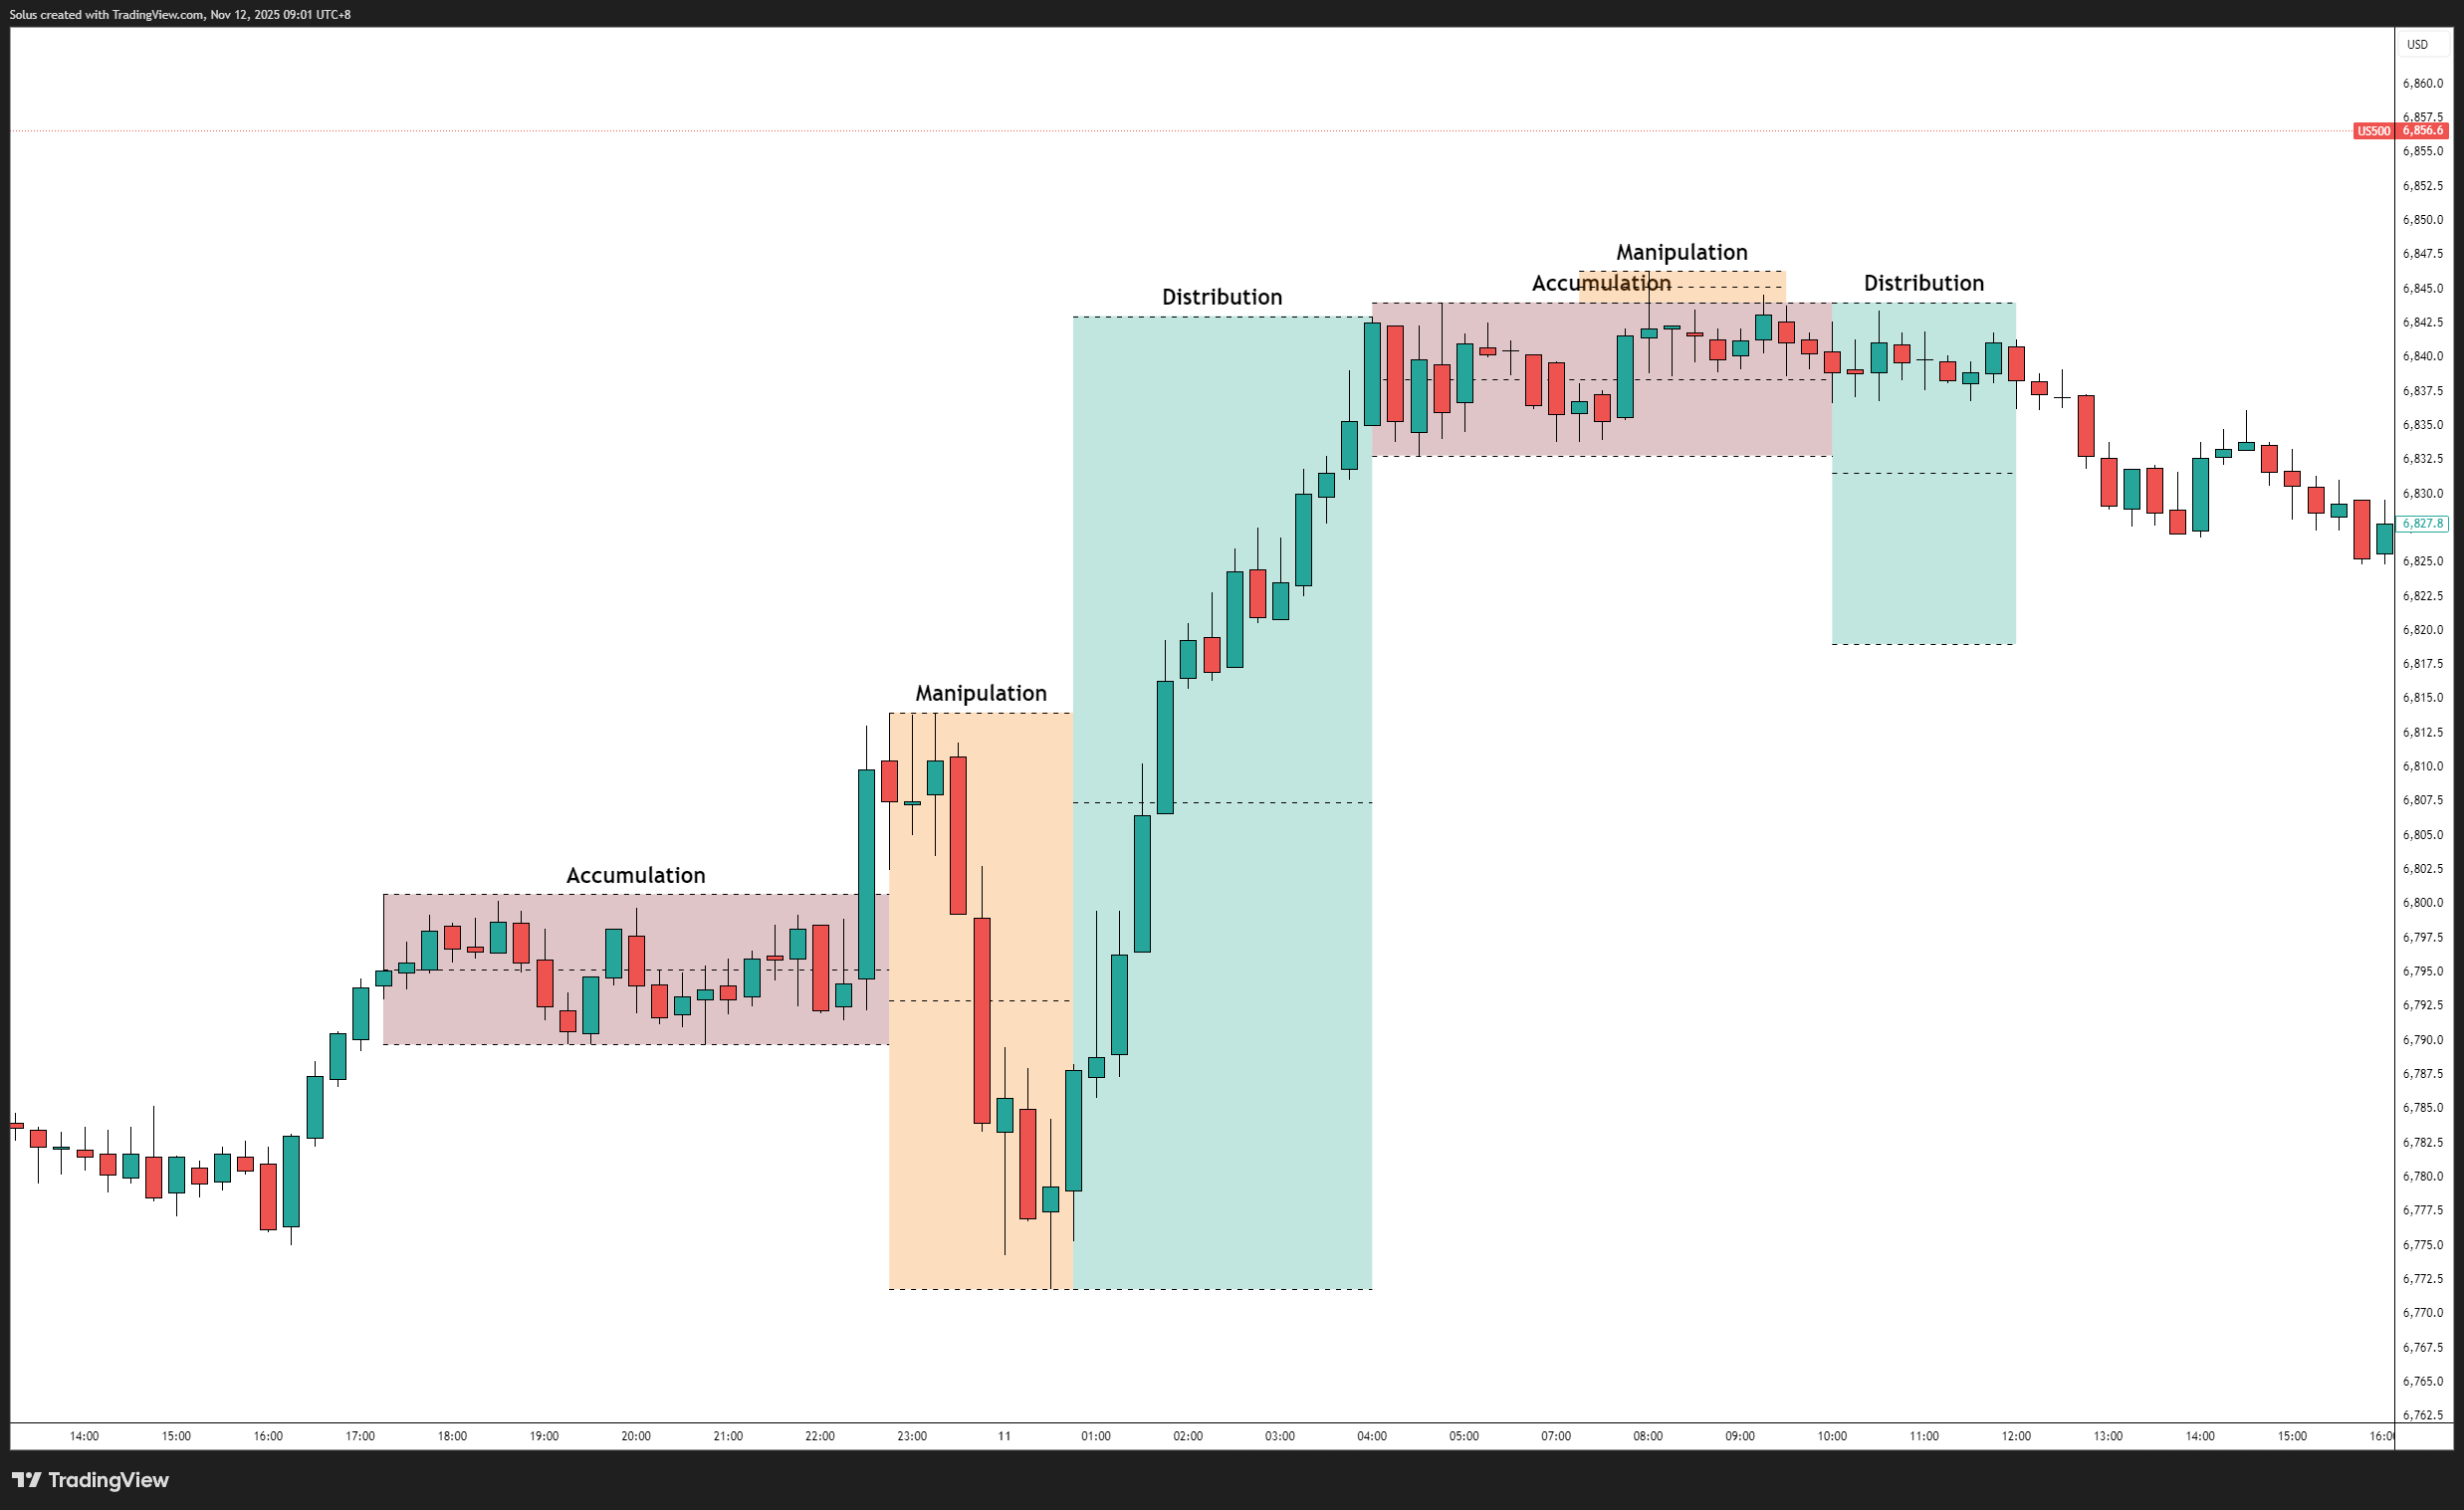
The AMD Framework breaks down all price movements into three recurring stages - Accumulation, Manipulation, and Distribution - each showing how smart money engineers liquidity and transitions from one phase to the next. It’s the silent choreography behind the markets, reflecting the same logic outlined in Accumulation, Manipulation, Distribution.
- Accumulation – Institutions quietly position within a range. Price moves sideways, absorbing liquidity from both sides while retail traders grow impatient or uncertain.
- Manipulation – The market creates an illusion of breakout - taking stops above or below key levels - to mislead retail positions. This phase cleans the books, triggering emotional entries.
- Distribution – Once liquidity is cleared, institutions deliver the true move. Price displaces powerfully, leaving footprints like Fair Value Gaps and valid Order Blocks behind.
Inside this rhythm, order blocks are the anchor points - zones of accumulation or distribution that reveal where smart money re-enters the trend. They are the memory of institutional action, the reference points that define how price returns to balance before its next leg.
Think of market structure as the skeleton, and order blocks as the vertebrae that hold it upright. Without them, the entire body of price action collapses into noise.
Why AMD Is the Pivotal Principle in SMC
The AMD model is the heartbeat of Smart Money Concepts. It’s what separates random trading boxes from meaningful institutional footprints. Without understanding which phase the market is in, an order block is just a rectangle with no story.
1. Accumulation Creates the Setup
In the accumulation phase, price consolidates within a narrow range. Many traders misinterpret this chop as indecision - but in reality, it’s position building. Institutions are absorbing liquidity quietly. Every “mini” OB you mark here is likely internal and weak because intent hasn’t yet been revealed.
The goal is not to trade accumulation; it’s to observe it. Only after manipulation occurs does the true bias emerge. This is where patience pays.
2. Manipulation Confirms the Trap
This is where the “fake breakout” happens. Liquidity above or below the range gets taken, retail traders are trapped, and institutions prepare for displacement.
The OB that forms right before manipulation resolves is often the real institutional footprint. It’s the candle that led to the liquidity sweep before the market chose its real direction.
3. Distribution Delivers the Intent
Here, price expands decisively. This is the phase where your BOS (Break of Structure) confirms direction. The last OB before the move becomes a continuation zone - the same logic detailed in Anatomy of a Perfect Execution.
Once this OB forms, every retracement back into it should be seen as a potential institutional re-entry point.
This repetitive cycle of build–trap–displace is what gives Smart Money traders a map. Every time you identify where the market currently sits within AMD, you regain clarity in chaos.
Change of Character (CHoCH) – The Reversal Order Block
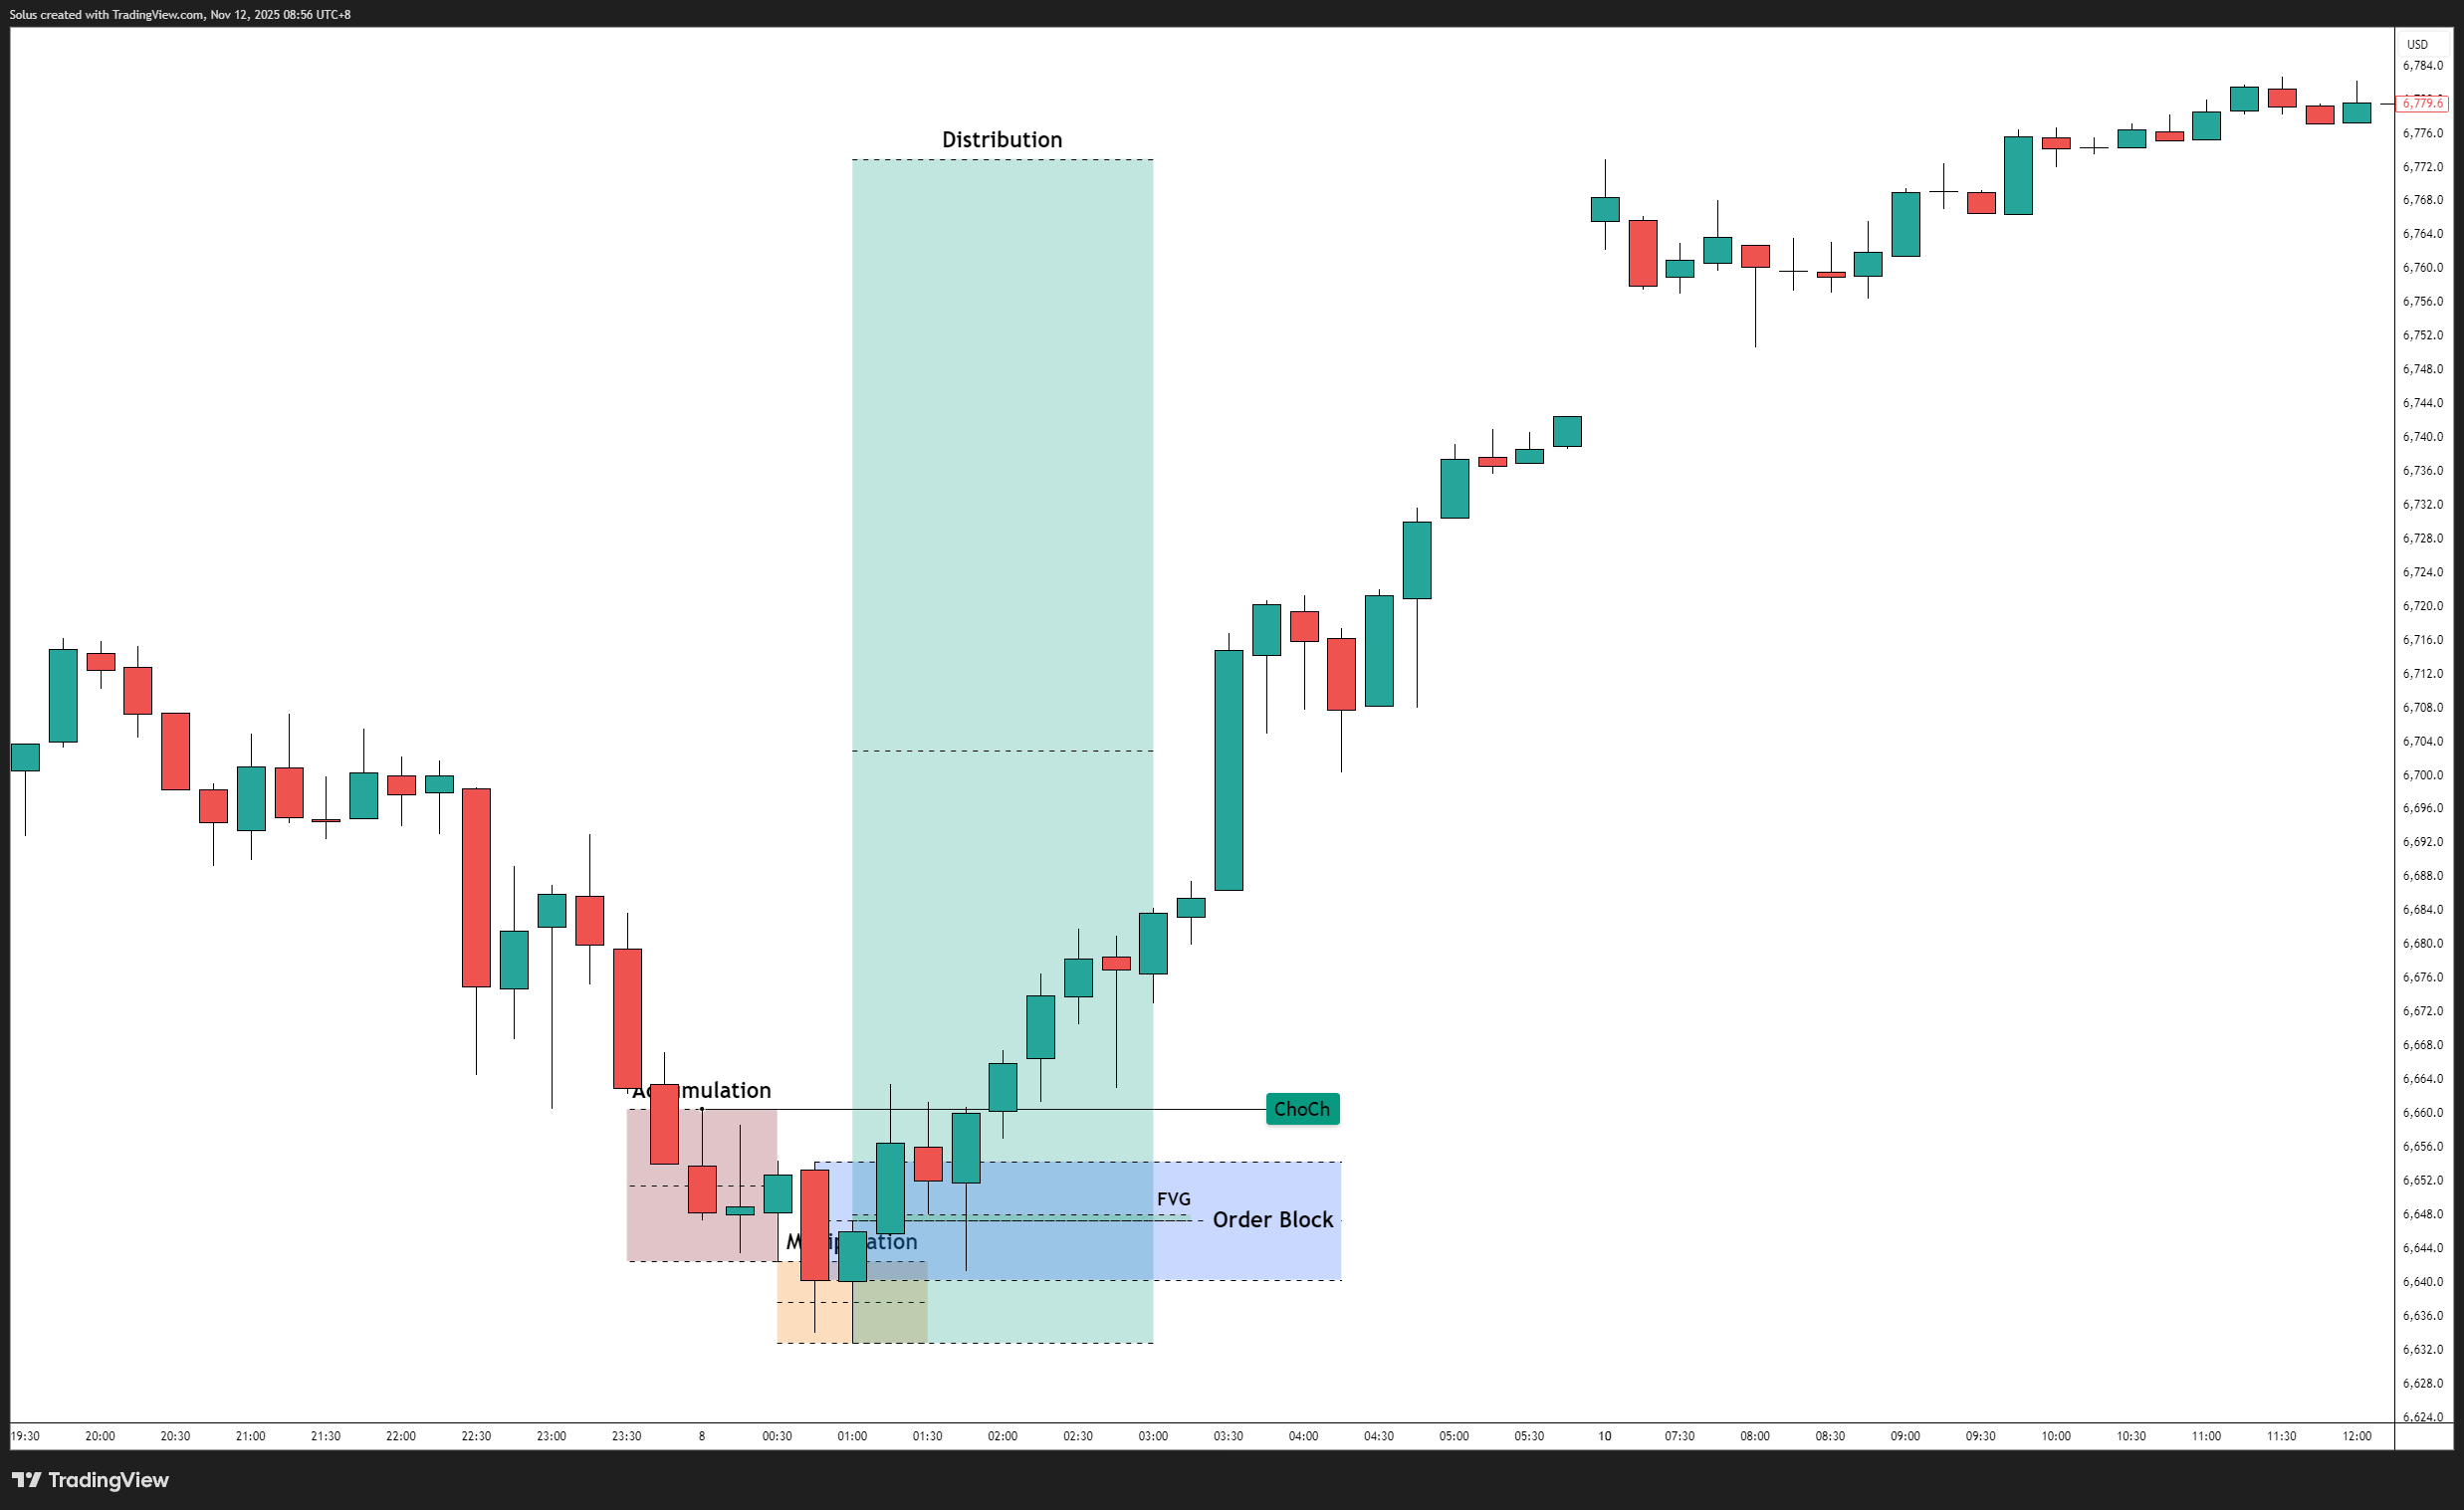
A Change of Character (CHoCH) signals the transition between AMD cycles. It tells you that manipulation has finished and a new accumulation/distribution phase is beginning.
This is where many traders get confused: a CHoCH is not just a break of structure - it’s a shift in intent. When price sweeps liquidity and moves in the opposite direction with momentum, the last opposing candle becomes the CHoCH order block.
These OBs often form at key pivot zones where the market switches from distribution to accumulation or vice versa. To identify them accurately, study the broader Institutional Order Flow and look for where displacement aligns with liquidity engineering.
Break of Structure (BOS) – The Continuation Order Block
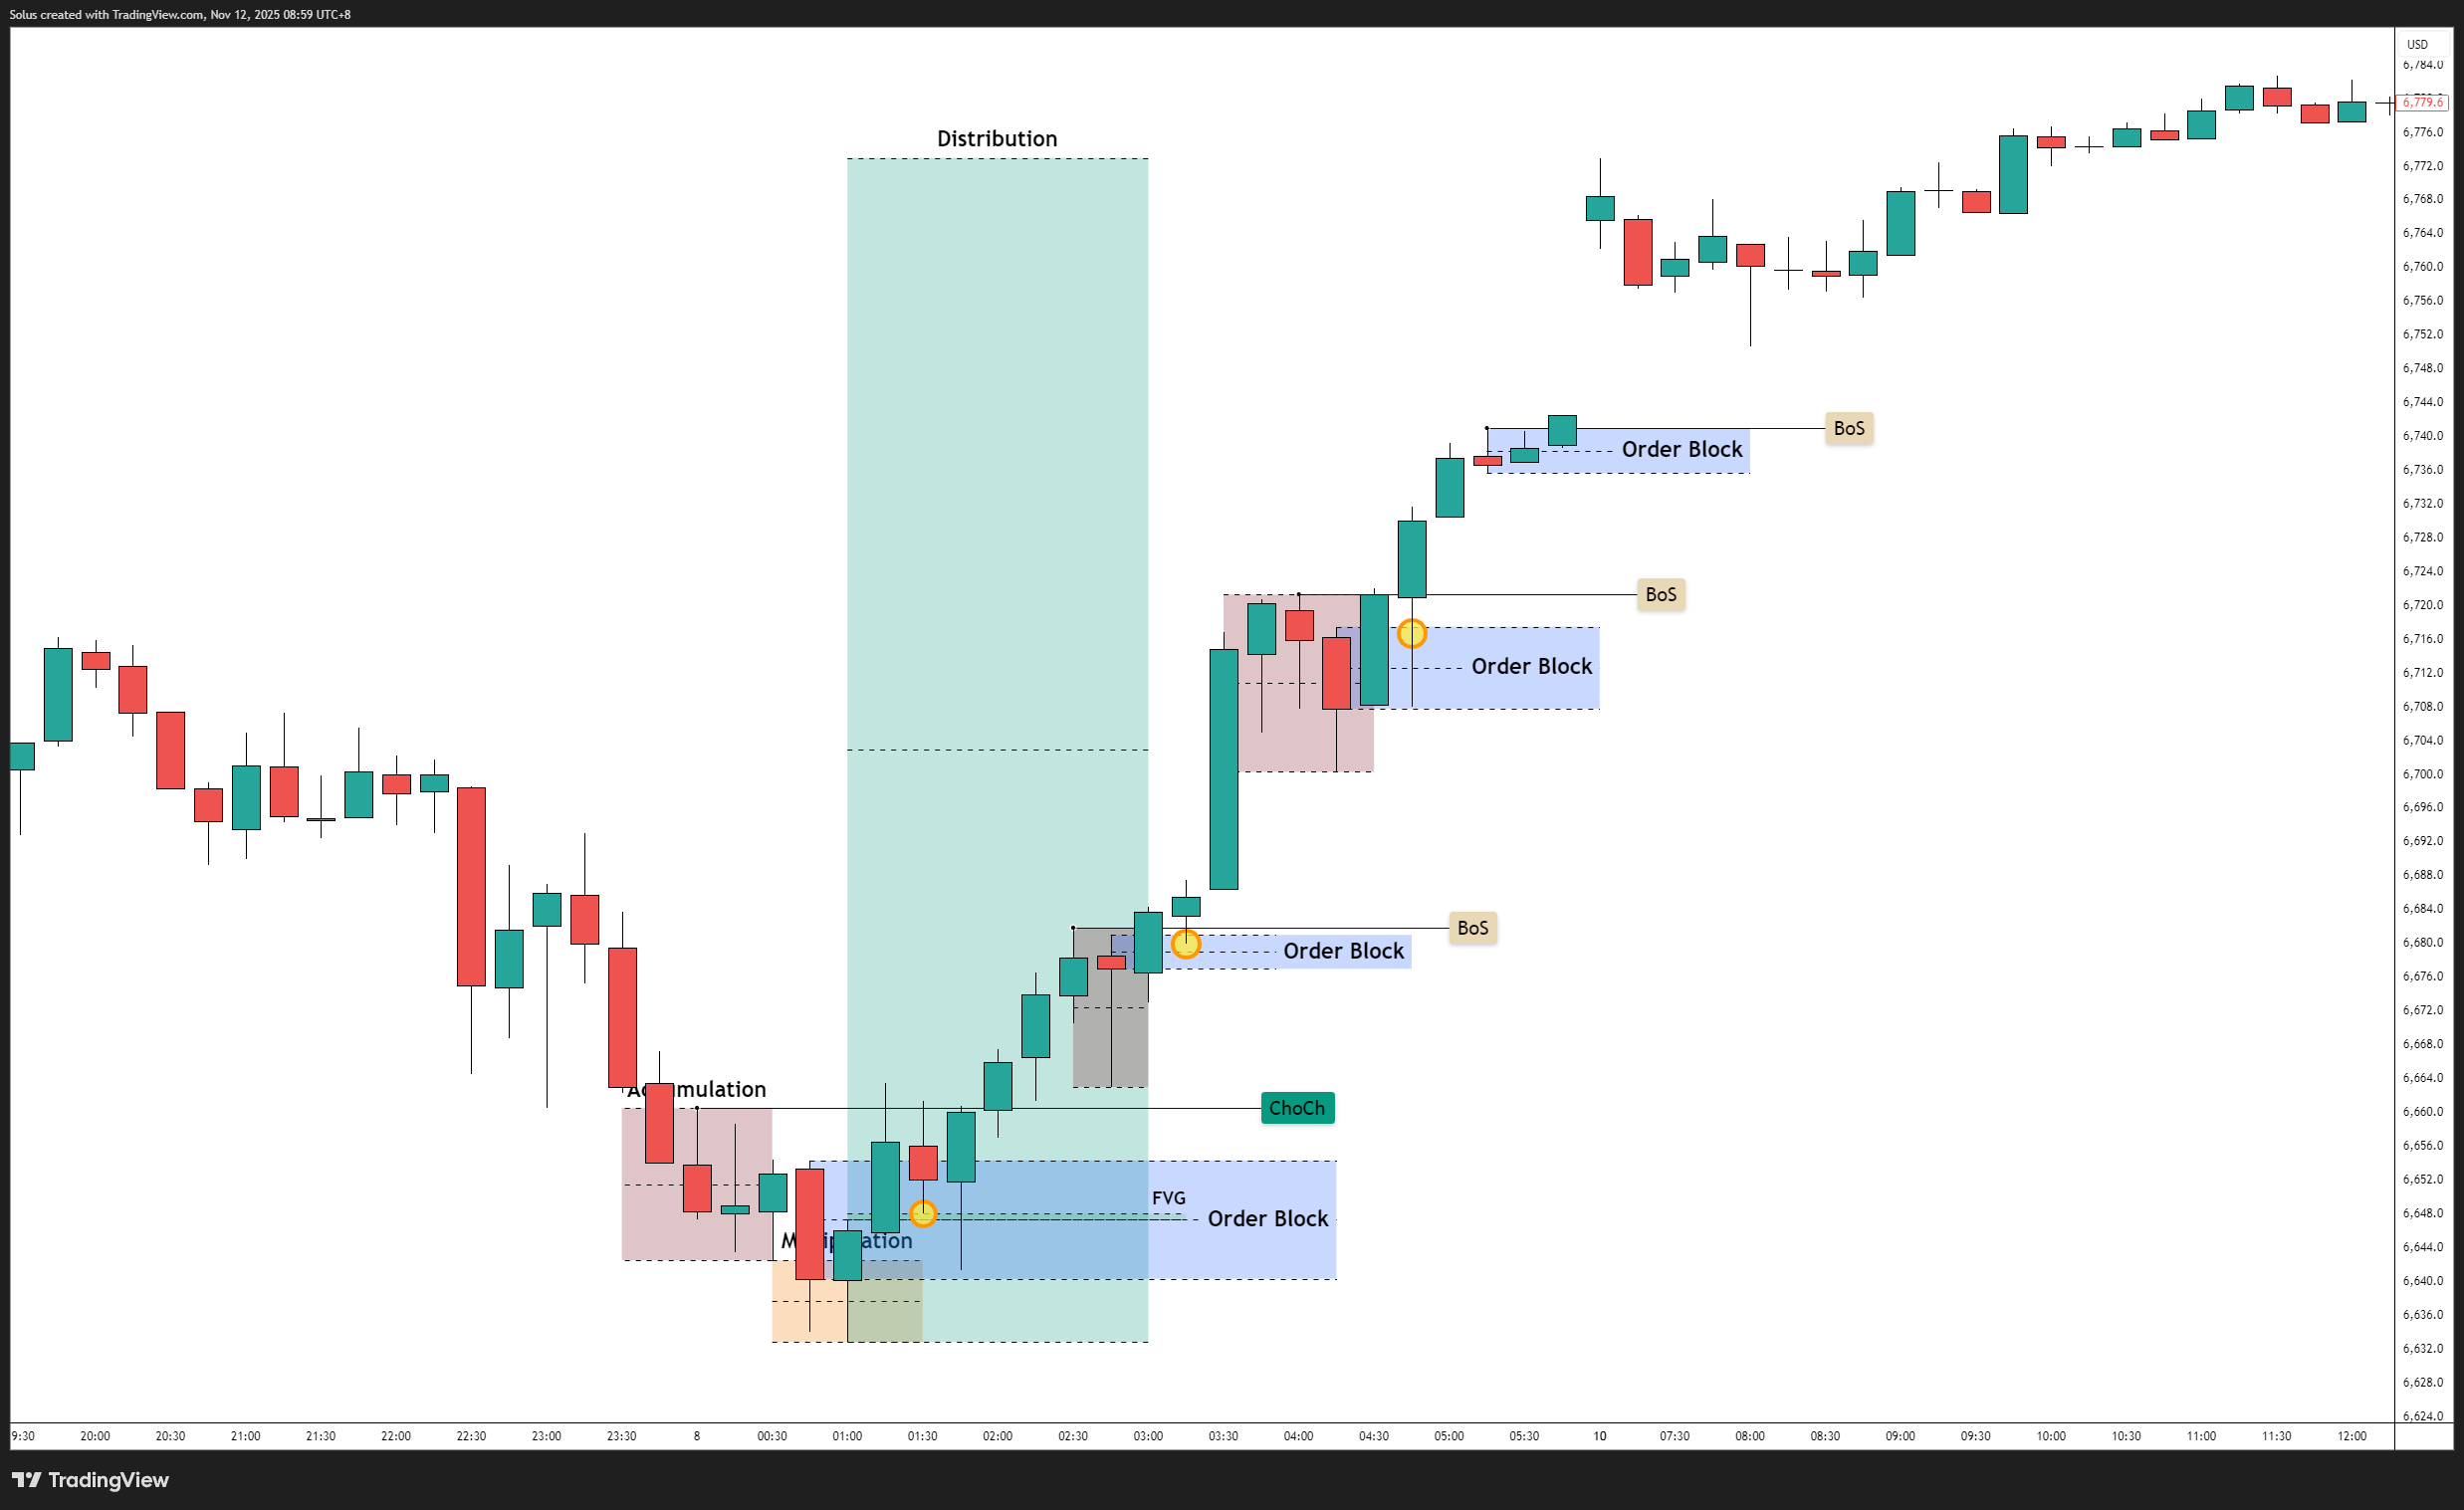
A Break of Structure (BOS) is confirmation of trend continuation. It represents institutional conviction - when price breaks a prior high or low with force and displacement. The OB before that break is your continuation zone, showing where institutions reloaded positions.
How to Identify BOS-Based Order Blocks
- Spot a strong displacement candle (an impulsive move, not a slow crawl).
- Identify the last opposite candle before that displacement.
- Confirm that a prior structural point has been broken.
- Mark the zone as your continuation OB.
These OBs are usually found in the distribution phase of the AMD cycle, where price leaves behind unmitigated imbalances that often overlap with Fair Value Gaps. When price revisits this zone, it’s not random - it’s smart money refilling orders to continue the trend.
Internal Range Order Blocks
Inside accumulation, internal OBs are everywhere. Every minor reaction looks like an entry - but they’re often false signals. These OBs form from micro-balances within the range, representing transactions between short-term participants rather than institutions.
Until manipulation happens, these internal OBs should be treated with caution. They don’t represent true intent; they’re placeholders of liquidity buildup.
Internal range OBs are useful only for intraday refinement - for example, dropping from H1 to M5 to pinpoint smaller zones for precise entries. But on higher timeframes, they hold little structural value until the AMD phase completes.
BOS vs. CHoCH: Key Structural Differences
| Feature | BOS-Based OB | CHoCH-Based OB |
|---|---|---|
| Direction | With trend | Against prior trend |
| Function | Continuation / Reload | Reversal / Shift |
| Phase (AMD) | Distribution | Manipulation to Accumulation |
| Context | After impulsive displacement | After liquidity sweep |
| Reliability | High in trending markets | High at exhaustion points |
Both play crucial roles in confirming institutional behavior. BOS-based OBs show continuation strength, while CHoCH OBs show where control changes hands.
Why AMD Is the Filter That Removes Noise
Here’s the reality: every candle can look like an order block inside accumulation.
If you start marking OBs before manipulation and displacement occur, your chart will become a jungle of boxes - each fighting for meaning. This is why most traders experience “fake” order blocks; they’re identifying them before the AMD cycle completes.
Until liquidity has been taken (manipulation) and the real move (distribution) has displaced price, those internal OBs are meaningless. They’re just byproducts of accumulation - activity without direction.
This is why patience is everything. Wait for AMD to unfold before drawing your OB. Let the story complete its chapter before reading the next one.
Confluence and Strength: Measuring OB Validity
Not all OBs are created equal. Some carry immense institutional weight; others are fragile. Here’s what adds strength:
- Displacement quality – The stronger the impulse that leaves the OB, the more significant it becomes.
- Liquidity engineering – The OB must form after a liquidity sweep, not randomly in the middle of a range.
- Inefficiency proximity – OBs near or overlapping an FVG carry more conviction.
- Structure alignment – The OB should agree with the higher timeframe BOS/CHoCH structure confirmed by displacement.
If these align, your OB is not just a rectangle - it’s a reflection of institutional control.
Real-Life Analogy: The Storm System
Think of AMD like a storm system. Accumulation is the quiet humidity before the thunder. Manipulation is the lightning that strikes unpredictably, shaking confidence. Distribution is the downpour - the release of energy that moves everything in one clear direction.
Order blocks are like the pressure zones where the storm began to form. Trying to identify them before the storm builds is like guessing where lightning will hit based on a few clouds. The sequence must mature first.
Final Thoughts
Order blocks are the fingerprints of smart money - but they only make sense inside the bigger story of AMD. Without understanding the buildup, trap, and release cycle, every rectangle becomes just a guess.
When you learn to map the rhythm of Accumulation, Manipulation, and Distribution, you stop seeing the market as chaos and start recognizing its pattern of intent. Combine this with structural confirmation and institutional flow, and you’ll finally trade with the market - not against it.
Once you can identify structure and order flow with confidence, it’s time to start trading live and apply these concepts on real charts.
FAQs
Why is AMD so critical for order blocks?
Because AMD gives every OB its context. It tells you whether an OB represents accumulation noise or institutional intent.
Can order blocks exist in all phases?
Yes, but their strength varies. OBs that form after manipulation and during distribution carry the highest probability.
Why do OBs fail?
Because they’re drawn too early - inside accumulation - before the market reveals its true phase.
How do BOS and CHoCH fit into AMD?
BOS confirms trend continuation during distribution, while CHoCH marks manipulation giving way to a new accumulation cycle.
Start Trading Live!
- Trade forex, indices, gold, and more
- Access ACY, MT4, MT5, & Copy Trading Platforms
It’s time to go from theory to execution!
Create an Account. Start Your Live Trading Now!
Check Out My Contents:
Strategies That You Can Use
Looking for step-by-step approaches you can plug straight into the charts? Start here:
- How To Trade & Scalp Indices at the Open Using Smart Money Concepts (SMC)
- How to Trade Breakouts Effectively in Day Trading with Smart Money Concepts
- Complete Step-by-Step Guide to Day Trading Gold (XAU/USD) with Smart Money Concepts (SMC)
- The Power of Multi-Timeframe Analysis in Smart Money Concepts (SMC)
- Forex Trading Strategy for Beginners
- Mastering Candlestick Pattern Analysis with the SMC Strategy for Day Trading
- How to Use Fibonacci to Set Targets & Stops (Complete Guide)
- RSI Divergence Trading Strategy for Gold: How to Identify and Trade Trend Reversals
- Stochastics Trading Secrets: How to Time Entries in Trending Markets using Stochastics
- Gold Trading Stochastics Strategy: How to Trade Gold with 2R - 3R Targets
- RSI Hidden Divergence Explained: How to Spot Trend Continuations Like a Pro
- Moving Averages Trading Strategy Playbook
- Mastering Fibonacci Trading Psychology - Trusting the Levels, Managing the Mind
- Mastering Price Action at Key Levels - How to Spot, Trade, and Win at the Most Crucial Zones
- Mastering Retests: How to Enter with Confirmation After a Breakout
Indicators / Tools for Trading
Sharpen your edge with proven tools and frameworks:
- The Ultimate Guide to Risk Management in Trading - A Complete Compilation for 2026
- Moving Averages Trading Strategy Playbook
- How to Think Like a Price Action Trader
- Mastering Fibonacci Trading Psychology - Trusting the Levels, Managing the Mind
How To Trade News
News moves markets fast. Learn how to keep pace with SMC-based playbooks:
- Why Smart Money Concepts Work in News-Driven Markets - CPI, NFP, and More
- How to Trade NFP Using Smart Money Concepts (SMC) - A Proven Strategy for Forex Traders
- How to Trade CPI Like Smart Money - A Step-by-Step Guide Using SMC
- Learn to Trade News by Backtesting it with Forex Tester
Learn How to Trade US Indices
From NASDAQ opens to DAX trends, here’s how to approach indices like a pro:
- How to Start Trading Indices and Get into the Stock Market with Low Capital (2026 Guide)
- Best Indices to Trade for Day Traders | NASDAQ, S&P 500, DAX + Best Times to Trade Them
- How To Trade & Scalp Indices at the Open Using Smart Money Concepts (SMC)
- NAS100 - How to Trade the Nasdaq Like a Pro (Smart Money Edition)
How to Start Trading Gold
Gold remains one of the most traded assets - here’s how to approach it with confidence:
- How to Swing Trade Gold (XAU/USD) Using Smart Money Concepts: A Simple Guide for Traders
- Complete Step-by-Step Guide to Day Trading Gold (XAU/USD) with Smart Money Concepts (SMC)
- The Ultimate Guide to Backtesting and Trading Gold (XAU/USD) Using Smart Money Concepts (SMC)
- Why Gold Remains the Ultimate Security in a Shifting World
- How to Exit & Take Profits in Trading Gold Like a Pro: Using RSI, Range Breakdowns, and MAs as Your Confluence
- Backtest Gold using Forex Tester Online
How to Trade Japanese Candlesticks
Candlesticks are the building blocks of price action. Master the most powerful ones:
- Mastering the Top Japanese Candlesticks: The Top 5 Candlesticks To Trade + Top SMC Candlestick Pattern
- How to Trade Candlestick Patterns with High Probability: A Complete Guide for Beginners
- The Top Japanese Candlestick Guide: What is an Engulfing Pattern and How to Trade It?
- Piercing Pattern Candlestick Explained: How to Trade It - Step-By-Step Guide
- Morning & Evening Star Candlestick Patterns - How to Trade Market Reversals with Confidence
How to Start Day Trading
Ready to go intraday? Here’s how to build consistency step by step:
- 5 Steps to Start Day Trading: A Strategic Guide for Beginners
- 8 Steps How to Start Forex Day Trading in 2026: A Beginner’s Step-by-Step Guide
- 3 Steps to Build a Trading Routine for Consistency and Discipline - Day Trading Edition
- The Ultimate Guide to Understanding Market Trends and Price Action
- Trading with Momentum: The Best Trading Session to Trade Forex, Gold and Indices
Swing Trading 101
- Introduction to Swing Trading
- The Market Basics for Swing Trading
- Core Principles of Swing Trading
- The Technical Foundations Every Swing Trader Must Master
- Swing Trader’s Toolkit: Multi-Timeframe & Institutional Confluence
- The Psychology of Risk Management in Swing Trading
- Swing Trading Concepts To Know In Trading with Smart Money Concepts
- Becoming a Consistent Swing Trader: Trading Structure & Scaling Strategy
Learn how to navigate yourself in times of turmoil
Markets swing between calm and chaos. Learn to read risk-on vs risk-off like a pro:
- How to Identify Risk-On and Risk-Off Market Sentiment: A Complete Trader’s Guide
- How to Trade Risk-On and Risk-Off Sentiment - With Technical Confirmation
- The Ultimate Guide to Understanding Market Trends and Price Action
- Metals in Risk-On and Risk-Off Environments: How Sentiment Moves Gold and Commodities
Want to learn how to trade like the Smart Money?
Step inside the playbook of institutional traders with SMC concepts explained:
- Why Smart Money Concepts Work: The Truth Behind Liquidity and Price Action
- Mastering the Market with Smart Money Concepts: 5 Strategic Approaches
- Understanding Liquidity Sweep: How Smart Money Trades Liquidity Zones in Forex, Gold, US Indices
- The SMC Playbook Series Part 1: What Moves the Markets? Key Drivers Behind Forex, Gold & Stock Indices
- The SMC Playbook Series Part 2: How to Spot Liquidity Pools in Trading - Internal vs External Liquidity Explained
- Fair Value Gaps Explained: How Smart Money Leaves Footprints in the Market
- Accumulation, Manipulation, Distribution: The Hidden Cycle That Runs Every Market
- Institutional Order Flow - Reading the Market Through the Eyes of the Big Players
- London Session Trading Secrets: How Smart Money Sets the High & Low of the Day
- Mastering the New York Session - Smart Money Concepts Guide
- Anatomy of a Perfect Execution: How SMC Traders Trade with Precision
- Step-by-Step Trading Confirmation Guide for Precise Execution
- Execution Psychology: Turning Hesitation into Confidence
- What Is an Order Block? The Institutional Footprint Explained
- Anatomy of a Valid Order Block in Smart Money Concepts
- How to Draw Order Blocks Accurately - Day Trading Style
Master the World’s Most Popular Forex Pairs
Forex pairs aren’t created equal - some are stable, some are volatile, others tied to commodities or sessions.
- The Top 5 All-Time Best Forex Pairs to Trade
- Top Forex Pairs Beyond the Big Five
- EUR/USD: The King of Forex
- USD/JPY: The Fast Mover
- GBP/USD: The Volatile Cable
- AUD/USD: The Commodity Currency
- USD/CAD: The Oil-Backed Pair
- GBP/JPY: How to Trade The Beast
- Asian & London Session Secrets
- Mastering the New York Session
Metals Trading
- Metals Trading: Why Gold and Metals Are Rising Again
- Silver Trading: The Underdog with Dual Identity
- Gold vs Silver: Institutional Demand Breakdown Explained
- How to Day Trade Silver Like a Pro: Smart Money Tactics for XAG/USD
- Platinum & Palladium: The Quiet Power Duo of Industrial Metals
- How to Trade Metals with SMC and Fundamentals - Gold Trading Strategy
- Metals in Risk-On and Risk-Off Environments: How Sentiment Moves Gold and Commodities
- Future of Metals Market: Gold Forecast 2026 & Long-Term Commodities Outlook
Stop Hunting 101
If you’ve ever been stopped out right before the market reverses - this is why:
- Stop Hunting 101: How Swing Highs and Lows Become Liquidity Traps
- Outsmarting Stop Hunts: The Psychology Behind the Trap
- How to Lessen Risk From Stop Hunts in Trading
- How Stop Hunts Trigger Revenge Trading - Breaking the Pain Cycle
- How to Accept Stop Hunts Without Losing Discipline - Shifting From Frustration to Focus
Trading Psychology
Mindset is the deciding factor between growth and blowups. Explore these essentials:
- The Mental Game of Execution - Debunking the Common Trading Psychology
- Managing Trading Losses: Why You Can Be Wrong and Still Win Big in Trading
- The Hidden Threat in Trading: How Performance Anxiety Sabotages Your Edge
- Why 90% of Retail Traders Fail Even with Profitable Trading Strategies
- Top 10 Habits Profitable Traders Follow Daily to Stay Consistent
- Top 10 Trading Rules of the Most Successful Traders
- Top 10 Ways to Prevent Emotional Trading and Stay Disciplined in the Markets
- Why Most Traders Fail - Trading Psychology & The Hidden Mental Game
- Emotional Awareness in Trading - Naming Your Triggers
- Discipline vs. Impulse in Trading - Step-by Step Guide How to Build Control
- Trading Journal & Reflection - The Trader’s Mirror
- Overcoming FOMO & Revenge Trading in Forex - Why Patience Pays
- Risk of Ruin in Trading - Respect the Math of Survival
- Identity-Based Trading: Become Your Trading System for Consistency
- Trading Psychology: Aligning Emotions with Your System
- Mastering Fear in Trading: Turn Doubt into a Protective Signal
- Mastering Greed in Trading: Turn Ambition into Controlled Growth
- Mastering Boredom in Trading: From Restless Clicking to Patient Precision
- Mastering Doubt in Trading: Building Confidence Through Backtesting and Pattern Recognition
- Mastering Impatience in Trading: Turn Patience Into Profit
- Mastering Frustration in Trading: Turning Losses Into Lessons
- Mastering Hope in Trading: Replacing Denial With Discipline
- When to Quit on Trading - Read This!
- The Math of Compounding in Trading
- Why Daily Wins Matter More Than Big Wins
- Scaling in Trading: When & How to Increase Lot Sizes
- Why Patience in Trading Fuels the Compounding Growth
- Step-by-Step Guide on How to Manage Losses for Compounding Growth
- The Daily Habits of Profitable Traders: Building Your Compounding Routine
- Trading Edge: Definition, Misconceptions & Casino Analogy
- Finding Your Edge: From Chaos to Clarity
- Proving Your Edge: Backtesting Without Bias
- Forward Testing in Trading: How to Prove Your Edge Live
- Measuring Your Edge: Metrics That Matter
- Refining Your Edge: Iteration Without Overfitting
- The EDGE Framework: Knowing When and How to Evolve as a Trader
- Scaling Your Edge: From Small Account to Consistency
- Trading in the Zone: Execution Through Habit and Structure
- Trading in the Zone: Thinking in Probabilities
- The Inner War: Fear, Greed, and the Illusion of Control
- Detachment Discipline in Trading: How to Let Go of the Need to Be Right
- Trading Hack: Why You Keep Breaking Your Own Rules (And How to Stop)
- Trading Mindset Mastery: Building Confidence Through Data
- Flow State Trading: Entering the Zone Through Structure
- Cognitive Traps in Trading: Overconfidence, Recency Bias & Revenge Trades
- The Psychology of Risk in Trading: Fear of Loss vs Fear of Missing Out
- Self-Trust in Trading – Building Confidence from Repetition, Not Just Results
- The Zen of Trading: Becoming the Observer, Not the Reactor
Market Drivers
- Central Banks and Interest Rates: How They Move Your Trades
- Inflation & Economic Data: CPI Trading Strategy and PPI Indicator Guide
- Geopolitical Risks & Safe Havens in Trading (Gold, USD, JPY, CHF)
- Jobs, Growth & Recession Fears: NFP, GDP & Unemployment in Trading
- Commodities & Global Trade: Oil, Gold, and Forex Explained
- Market Correlations & Intermarket Analysis for Traders
Risk Management
The real edge in trading isn’t strategy - it’s how you protect your capital:
- Mastering Risk Management: Stop Loss, Take Profit, and Position Sizing
- Why Risk Management Is the Only Edge That Lasts
- How Much Should You Risk per Trade? (1%, 2%, or Less?)
- The Ultimate Risk Management Plan for Prop Firm Traders - Updated 2026
- Mastering Position Sizing: Automate or Calculate Your Risk Like a Pro
- Martingale Strategy in Trading: Compounding Power or Double-Edged Sword?
- How to Add to Winners Using Cost Averaging and Martingale Principle with Price Confirmation
- Managing Imperfect Entries in Trading - How Professionals Stay Composed
Suggested Learning Path
If you’re not sure where to start, follow this roadmap:
- Start with Trading Psychology → Build the mindset first.
- Move into Risk Management → Learn how to protect capital.
- Explore Strategies & Tools → Candlesticks, Fibonacci, MAs, Indicators.
- Apply to Assets → Gold, Indices, Forex sessions.
- Advance to Smart Money Concepts (SMC) → Learn how institutions trade.
- Specialize → Stop Hunts, News Trading, Turmoil Navigation.
This way, you’ll grow from foundation → application → mastery, instead of jumping around randomly.
Follow me for more daily market insights!
Jasper Osita - LinkedIn - FXStreet - YouTube
This content may have been written by a third party. ACY makes no representation or warranty and assumes no liability as to the accuracy or completeness of the information provided, nor any loss arising from any investment based on a recommendation, forecast or other information supplies by any third-party. This content is information only, and does not constitute financial, investment or other advice on which you can rely.

