Mastering Technical Analysis in Forex Trading: Essential Guide
2023-06-15 09:23:03


Welcome, future forex traders! If you're stepping into the world of forex trading, you're likely hearing the term "technical analysis" quite a bit. Fear not, because we're here to break it down and make it fun and exciting for you!
Technical analysis is like being a trading detective. Using past market data, it helps predict future price movements. This method started making its mark in the 17th century with Japanese rice traders and has grown in sophistication and popularity since then, becoming a mainstay in the toolkit of successful forex traders.
The Role of Technical Analysis in Forex Trading
The role of technical analysis in Forex trading is multifaceted and significant. It is a methodology that helps traders identify potential trading opportunities based on the analysis of past market data, primarily price movements, and volume.
This analysis is undertaken using various statistical tools and techniques that seek to identify patterns or trends in the market, providing valuable insights that can inform trading decisions.
For instance, technical analysis can assist traders in recognizing market trends (upward, downward, or sideways), enabling them to develop strategies to capitalise on these trends.
Additionally, through the use of charting tools and indicators, such as Moving Average Convergence Divergence (MACD) and Relative Strength Index (RSI), traders can gain a clearer understanding of market sentiment and price momentum.
Thus, technical analysis is a crucial aspect of Forex trading, offering a systematic approach to market analysis and facilitating informed decision-making.
Identifying Trends and Patterns
Identifying trends and patterns in forex trading is akin to spotting animal tracks in the wild. Each footprint or pattern provides crucial clues about the direction the creature, or in our case, the market is heading. By studying these patterns, just as a tracker would interpret animal footprints, traders can anticipate future market movements.
These patterns often lead in three distinct directions:
- Upward (bullish)
- Downward (bearish)
- Sideways (consolidation)

- An upward or bullish trend signifies increasing prices and a favourable market for buyers.
- On the other hand, a downward or bearish trend indicates falling prices, favouring sellers.
- Lastly, a sideways or consolidating trend represents a market in equilibrium, with neither buyers nor sellers gaining significant control.
However, these trends are not always straightforward. They can often be interspersed with minor counter-trends. For example, within a broader bullish trend, there may be minor bearish trends. These are akin to an animal momentarily changing its direction before continuing on its main path.
By distinguishing these minor counter-trends from the overarching trend, traders can make more informed predictions about future price movements.
Using Charting Tools and Indicators
Charting tools and indicators are your map and compass on this journey through the unpredictable terrain of forex trading. They serve as the translators of the raw market data into digestible information, helping you to uncover hidden patterns and crucial insights about market dynamics.
Just as maps display different topographic features and a compass provides cardinal direction, charting tools and indicators give traders a structured way to view price movements and gauge market sentiment.
They span a broad spectrum, ranging from simple, like price and volume charts, to complex, like Moving Average Convergence Divergence (MACD) and Relative Strength Index (RSI).
Price charts visually represent the fluctuation in prices over a specific time period. They provide a bird's-eye view of the market, allowing traders to see where the price has been and to make informed guesses about where it might be heading next.
There are three types of price charts: Line Chart, Bar Chart, and Candlestick Chart. Out of these, the Candlestick Chart is the most popular and commonly used.

Volume charts, on the other hand, demonstrate the number of shares or contracts traded within a set period. They add depth to the price information by showing the strength of price moves. You can think of volume as the footprints left behind by traders. Larger volumes signify deeper footprints, indicating strong investor interest and market activity.

Volume chart - Source: Finlogix
On the complex end of the spectrum, we have tools like the MACD and the RSI.
Charting Tools and Indicators
Consider charting tools, your personal pair of binoculars, letting you zoom in on the market action. Common types include line charts, bar charts, and candlestick charts, each offering a unique perspective.
Popular Technical Indicators and Oscillators
Now that you're equipped with the tools and the tracks, it's time to develop your strategy, and your plan for hunting down those profitable trades. This strategy will help you decide when to buy or sell by pinpointing entry and exit points.
Moving Average Convergence Divergence (MACD)
The Moving Average Convergence/Divergence, commonly known as MACD, is an indicator used in technical analysis to detect shifts in the momentum of price trends. Despite being an oscillator – a type of indicator that varies over time within a specific range – the MACD doesn't typically identify overbought or oversold conditions, which distinguishes it from other oscillators.
Instead, the MACD uses two oscillating lines that function similarly to a two moving average system, helping traders identify potential buy and sell signals.
Imagine the MACD as a pair of detectives, represented by two lines that criss-cross each other on your chart. These lines don't have any boundaries, allowing them to wander freely across your chart, like detectives seeking clues about the market's direction.
Now let's decode how these detectives provide clues to trading:
1. MACD Line Crosses Zero: Consider the zero line as the 'neutral zone' in your chart's crime scene. When the MACD line crosses above the zero line, it's a bullish signal – suggesting it might be a good time to buy. Conversely, when the MACD line crosses below the zero, it's a bearish signal, hinting that it might be time to sell or short.

MACD Bearish Crossover - Source: Finlogix
2. Direction of the MACD Line: The direction in which the MACD line turns from the zero line also provides valuable insights.

MACD Buy Signal - Source: Finlogix
When the MACD line turns upward from below zero, it's seen as bullish, indicating a potential increase in price. When it turns downward from above zero, it's considered bearish, signalling a potential price decrease.
3. MACD Line Crosses the Signal Line: The MACD line and the signal line (a 9-day exponential moving average of the MACD line) act like partners solving a case together. When the MACD line (faster) crosses from below to above the signal line (slower), the indicator gives a bullish signal. This suggests that the momentum is shifting in favour of the buyers, and it could be an opportune time to enter a long position. The further below the zero line this crossover happens, the stronger the signal.

MACD Sell Signal - Source: Tradingview
4. On the other hand, when the MACD line crosses from above to below the signal line, it's a bearish signal. This implies that the sellers are gaining control, and it might be a suitable time to sell or enter a short position. The further above the zero line this crossover occurs, the stronger the signal.
By understanding and applying these principles, traders can use the MACD to help navigate the ebbs and flows of the market and make more informed trading decisions.
Relative Strength Index (RSI)
RSI, meanwhile, is akin to a thermometer, measuring the speed and change of price movements. It's typically used to identify overbought or oversold conditions in a market. When the temperature gets too hot (overbought) or too cold (oversold), it could indicate a potential market reversal.

RSI Indicator - Source: Finlogix
The RSI, a type of momentum oscillator, shows us the intensity of price movements by assigning a value between 1 and 100. This measurement enables traders to identify potentially overbought or oversold conditions in the market.
Oversold - When RSI readings fall below 30, it's akin to the engine running cold, suggesting that price action has been weak, and the asset could be oversold. This could potentially signal an upcoming rise in price as the market corrects and buyers might come in. Imagine it like a pendulum that has swung too far in one direction and is due to swing back.

RSI in Oversold Zone - Source: Finlogix
Conversely, when the RSI rises above 70, it's as if the engine is running too hot, indicating strong price action, potentially signifying that the asset is overbought. In this scenario, the market could be due for a correction as sellers may step in, leading to a possible drop in price.

RSI in Overbought Zone - Source: Finlogix
Like a vehicle, markets can run hot or cold for a while before correcting. So, while an RSI reading above 70 or below 30 suggests a market is overbought or oversold, it doesn't guarantee immediate price changes. External factors can sustain these conditions for a period of time.
In essence, RSI is a tool that aids in spotting potential market turnarounds. However, it's not infallible and should be used alongside other indicators and contextual market understanding for more accurate trading decisions. Hence, with the array of charting tools available, traders can interpret market language more effectively and navigate its unpredictability with increased confidence.
Using Fibonacci Retracements and Extensions
Fibonacci retracements and extensions are powerful tools used by traders and analysts to identify potential levels of support and resistance in financial markets. Derived from the Fibonacci sequence, these levels are calculated by applying mathematical ratios to significant price moves.
Fibonacci retracements are commonly used to determine potential levels where price corrections may end, and the overall trend may resume. Traders plot retracement levels such as 38.2%, 50%, and 61.8% on a price chart to identify areas where buying or selling pressure may increase.
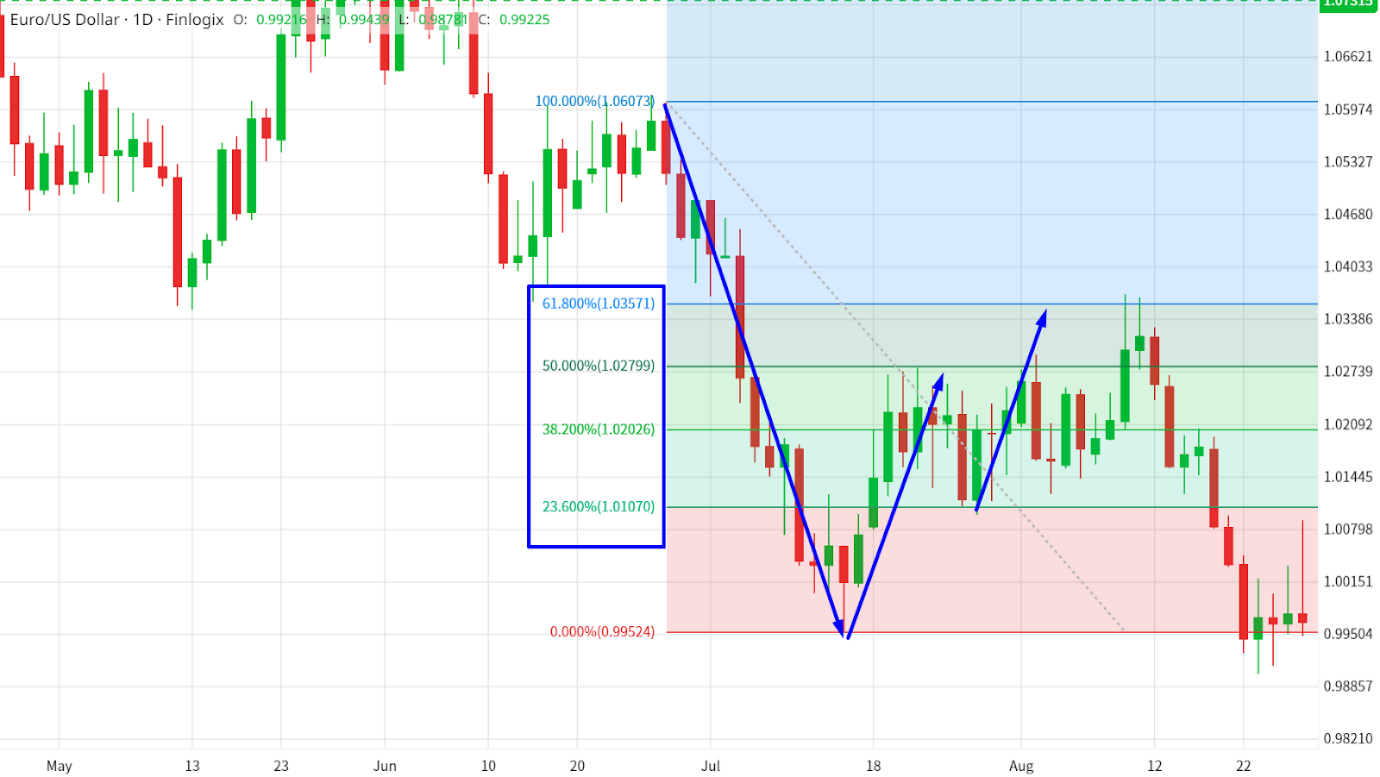
Fibonacci Retracement Tool - Source: Finlogix
These levels can act as strategic entry or exit points for traders, often coinciding with psychological levels or previous price reactions.
Fibonacci Extensions
On the other hand, Fibonacci extensions are employed to project potential price targets beyond the initial move.
Traders use extension levels such as 127.2%, 161.8%, and 261.8% to anticipate where the price may reach if the trend continues. These extensions can be useful in setting profit targets or identifying areas of potential trend reversal.

Fibonacci Extension Tool - Source: Finlogix
It's important to note that Fibonacci retracements and extensions are not foolproof indicators and should be used with other technical analysis tools and market factors. Traders often combine them with trend lines, moving averages, and other chart patterns to enhance their analysis.
Overall, Fibonacci retracements and extensions provide traders with valuable insights into potential levels of support, resistance, and price targets. By incorporating these tools into their trading strategies, traders can make more informed decisions and improve their trading performance.
Identifying and Using Trend Lines
Trend lines, the dotted lines on your trading treasure map, connect highs or lows and show the market's direction. There are three types:
- Uptrend lines (bullish)
- Downtrend lines (bearish)
- Sideways trend lines (neutral)
Drawing and interpreting trend lines is an essential skill in your trading journey.

Downtrend Lines (Bearish)
They provide critical insights into market trends and potential reversal points. With these trend lines incorporated into your trading strategy, you're another step closer to the treasure!
Trading with Support and Resistance Levels

Support and resistance levels are like the floor and ceiling of a room in forex trading. Spotting these levels helps you know when to enter or exit a trade.
Identifying these levels is akin to using a metal detector on a beach. Once you locate them, you can draw horizontal lines on your chart to visualize these barriers.
These lines will then become integral to your trading strategy. We will delve into support and resistance levels and other technical indicators in detail, providing an in-depth analysis of each tool.
This serves as an introduction to familiarize you with everything you can expect in technical analysis.
Harnessing the Power of Technical and Fundamental Analysis
Combining technical analysis with fundamental analysis is a powerful approach in forex trading that can provide a more comprehensive understanding of the market. While technical analysis focuses on studying price charts, patterns, and indicators to identify potential trading opportunities, fundamental analysis delves into economic data, news events, and market trends to assess the intrinsic value of a currency.
Both approaches have their unique strengths and weaknesses.
- Technical analysis helps traders identify patterns and trends, determine entry and exit points, and manage risk using various indicators and tools.
- Fundamental analysis provides insights into the underlying factors driving market movements, such as economic indicators, monetary policies, geopolitical events, and market sentiment. It helps traders understand the bigger picture and long-term trends in the market.
However, relying solely on one analysis method may limit a trader's perspective. By combining technical and fundamental analysis, traders can gain a more holistic view of the market.
For instance, traders can utilize technical analysis to identify potential trading opportunities by analysing chart patterns and indicators. They can then validate and reinforce these findings by conducting fundamental analysis to ensure alignment with prevailing economic trends and market conditions.
To illustrate, consider the EUR/USD currency pair's significant decline, breaking below the double bottom pattern, following the release of favourable GDP figures from the US economy. By adopting this integrated approach, traders can make well-informed trading decisions and enhance their chances of achieving success.

In summary, combining technical analysis with fundamental analysis in Forex trading can enhance traders' understanding of the market dynamics and improve their trading strategies. By leveraging the strengths of both approaches, traders can gain a more comprehensive view of the market, increase their confidence in their trading decisions, and ultimately improve their overall trading performance.
The Risks and Limitations of Technical Analysis in Forex Trading
While technical analysis can be a valuable tool in Forex trading, it is important to acknowledge its inherent risks and limitations.
- One of the main challenges is the possibility of false signals and misinterpretations. Technical indicators and chart patterns are not foolproof and can sometimes generate misleading or contradictory signals, leading to potential trading losses if not used judiciously.
- Unforeseen events and unpredictable market conditions can significantly impact the efficacy of technical analysis. Economic news releases, geopolitical developments, or sudden market shifts can render previously identified patterns or trends irrelevant, causing rapid price movements that deviate from technical expectations.
Traders should be mindful of these risks and understand that technical analysis is just one aspect of a comprehensive trading strategy. It is crucial to supplement technical analysis with other forms of analysis, such as fundamental analysis and risk management techniques, to mitigate the limitations and enhance the overall effectiveness of their trading decisions.
Conclusion
In summary, technical analysis is vital in Forex trading, providing insights into market trends and potential trading opportunities. However, it's important to be aware of its limitations, such as false signals and unforeseen events. To mitigate risks, combine technical analysis with fundamental analysis, considering economic indicators and news events.
This holistic approach enhances decision-making. Continuously educate yourself, stay updated, and refine your strategies. For more learning and to start trading, check out more of our educational resources here.

